MEMBERS ONLY
Weekly Market Review & Outlook - QQQ Leads Bull Market - Ranking the 9 Sectors - Turn in T-yields could affect Staples, Utilities, Gold and Banks - Oil Grinds - Dollar Corrects
by Arthur Hill,
Chief Technical Strategist, TrendInvestorPro.com
Weekly Market Review & Outlook .... All Time Highs Affirm Bull Market .... QQQ Continues to Lead on the Charts .... Small-caps Extend Stall .... Eight of Nine Sectors have Golden Crosses .... Tech, Industrials and Consumer Discretionary Lead .... Finance Breaks mid December low .... Energy Sports a Bullish Wedge .... Staples and Utilities Hit Potential Reversal...
READ MORE
MEMBERS ONLY
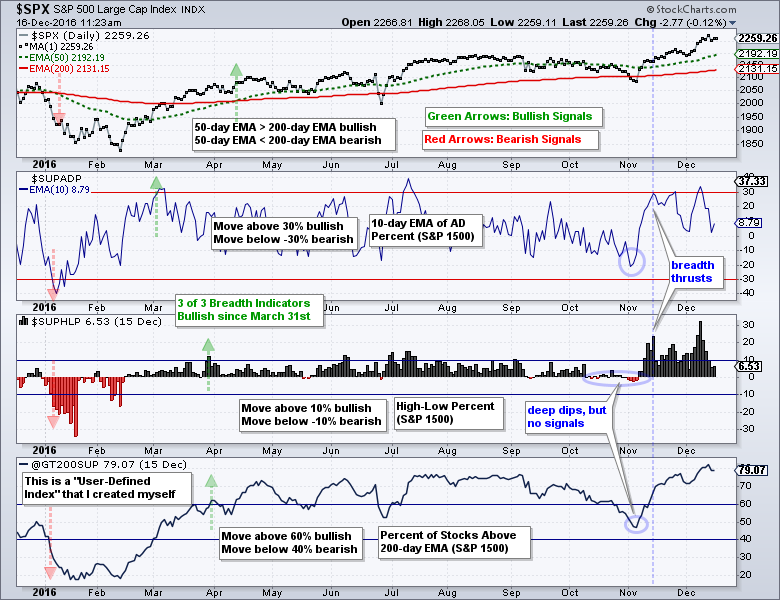
Broad Market Breadth Indicators are Far from Bearish Signals - Using %Above 20-day EMA for Short-term Bullish Setups and Signals
by Arthur Hill,
Chief Technical Strategist, TrendInvestorPro.com
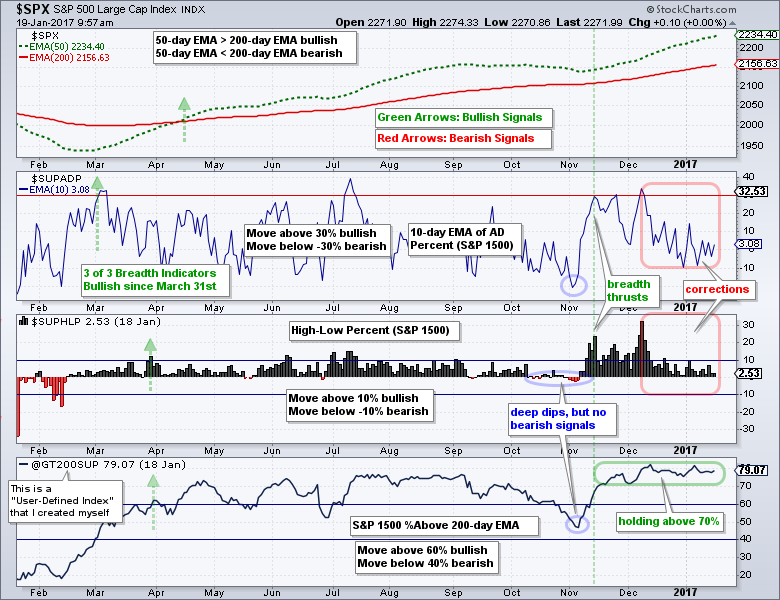
Broad Market Breadth Corrects During Consolidation .... Still Far from Bearish Breadth Signals .... New Highs Shrink, but New Lows have yet to Appear .... Over 70% of Stocks remain above 200-day EMAs .... Identifying Pullbacks with %Above 20-day EMA .... //// ....
The S&P 500 consolidated with a trading range the last five weeks...
READ MORE
MEMBERS ONLY
BroadCom Holds Gap Zone and Resumes Breakout
by Arthur Hill,
Chief Technical Strategist, TrendInvestorPro.com
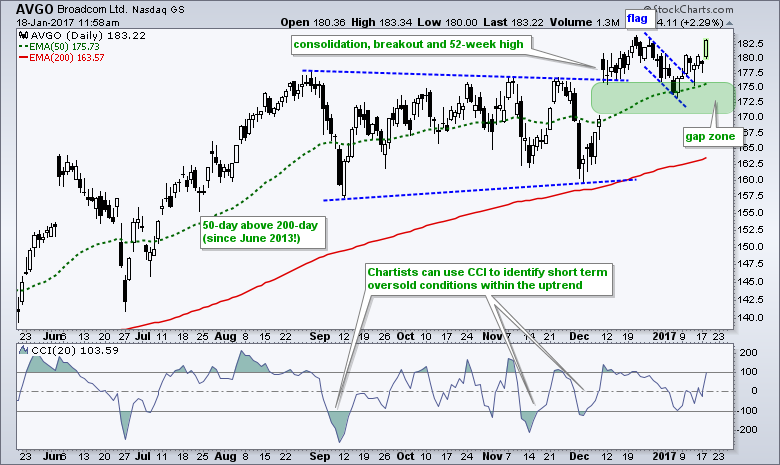
BroadCom (AVGO) is showing upside leadership again with a flag breakout last week and a 2% surge today. Overall, the stock advanced to a 52-week high in August and then embarked on a long consolidation. A large symmetrical triangle formed as the stock traded flat from September to early December....
READ MORE
MEMBERS ONLY
Webinar Video - QQQ and its Top Components Lead - 5 Sectors within 2% of 52-week Highs - XLF and XLI Extend Consolidations
by Arthur Hill,
Chief Technical Strategist, TrendInvestorPro.com
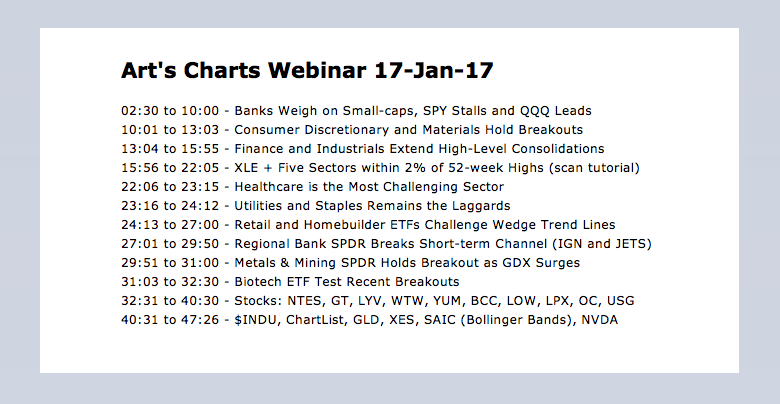
Small-caps Pull back after Big Surge .... SPY Stalls Near 52-week High .... QQQ and its Top Components Lead .... Five Sectors within 2% of 52-week Highs .... Consumer Discretionary and Materials Hold Breakouts .... Finance and Industrials Extend High-Level Consolidations .... Healthcare is the Most Challenging Sector .... Utilities and Staples Remains the Laggards .... //// ....
----Art'...
READ MORE
MEMBERS ONLY
Fewer New Highs, but Even Fewer New Lows
by Arthur Hill,
Chief Technical Strategist, TrendInvestorPro.com
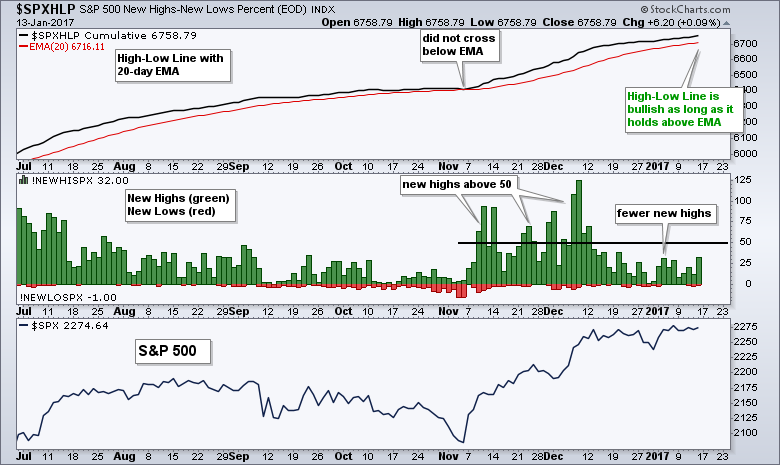
The chart below shows the High-Low Line for the S&P 500, new highs/lows as a histogram, and the S&P 500. Notice that new highs exceeded 50 several times from mid November to mid December. This showed good internal strength because over 10% of stocks in...
READ MORE
MEMBERS ONLY
Weekly Recap Video - A Pretty Normal Uptrend - QQQ Leads - Oil Grinds Higher - XLE and XES Correct within Uptrends
by Arthur Hill,
Chief Technical Strategist, TrendInvestorPro.com
----- Weekly Recap Video ----- Art's Charts ChartList -----
Weekly Recap Video .... A Pretty Normal Uptrend .... QQQ is Leading the Broader Market .... Small-caps Take a Rest .... Oil Continues to Grind Higher .... Energy SPDR Corrects within Uptrend .... Oil & Gas Equip & Services SPDR Outperforms XLE .... //// ....
A Pretty Normal...
READ MORE
MEMBERS ONLY
Fab Five Look Strong - Healthcare SPDR Falls on Yuge Volume - Watching MACD on Gold and Bonds for a Reversal
by Arthur Hill,
Chief Technical Strategist, TrendInvestorPro.com
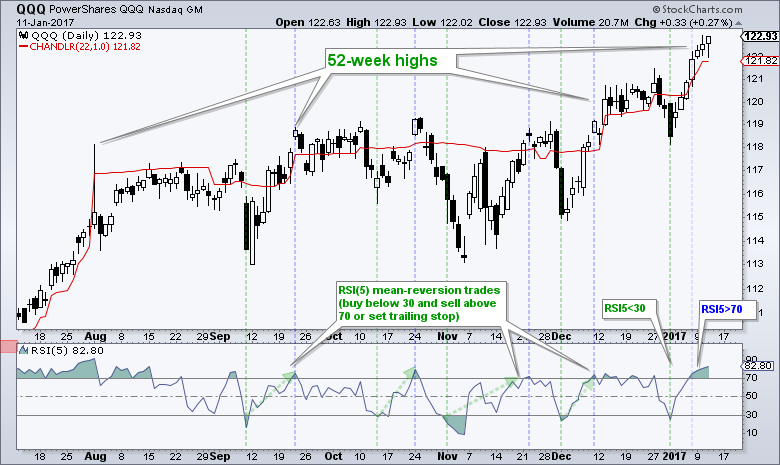
QQQ Closes near another 52-week High .... Fab Five Holding Strong .... HealthCare SPDR Falls on Huge Volume .... Biotech ETFs Test Breakout Zones .... ITB Still Setting Up Bullish .... Watching MACD for a Reversal in Gold .... A Precarious Bounce for Treasury Bonds ... ChartList Update .... //// ....
QQQ closed at the high of the day and...
READ MORE
MEMBERS ONLY
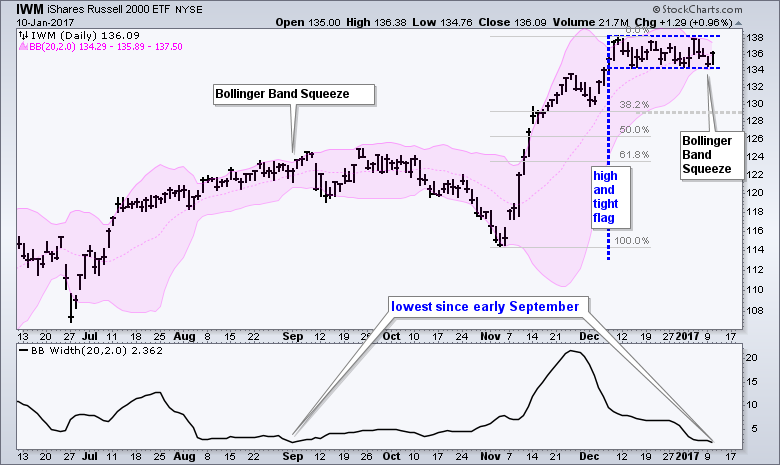
A High and Tight Consolidation for IWM
by Arthur Hill,
Chief Technical Strategist, TrendInvestorPro.com
After a big surge from early November to early December, the Russell 2000 iShares (IWM) moved into a tight trading range the last four weeks. Chartists should watch the resolution of this trading range for the next directional clue. The chart shows Bollinger Bands confirming a volatility contraction as the...
READ MORE
MEMBERS ONLY
Webinar Video - SPY/QQQ Get Oversold Bounces, but IJR Falls - Healthcare Leads the New Year - Housing and Retail Off to Rough Start
by Arthur Hill,
Chief Technical Strategist, TrendInvestorPro.com
----- Webinar Video ----- Art's Charts ChartList (updated 10-Jan) -----
QQQ and SPY Get Oversold Bounces .... IJR Fails to Hold Breakout .... Healthcare Leads in 2017 .... Biotechs Lead Healthcare Sector Higher .... Vanguard Financials and Regional Bank SPDR Extend Stall .... Housing and Retail Off to a Rough Start .... //// ....
Let'...
READ MORE
MEMBERS ONLY
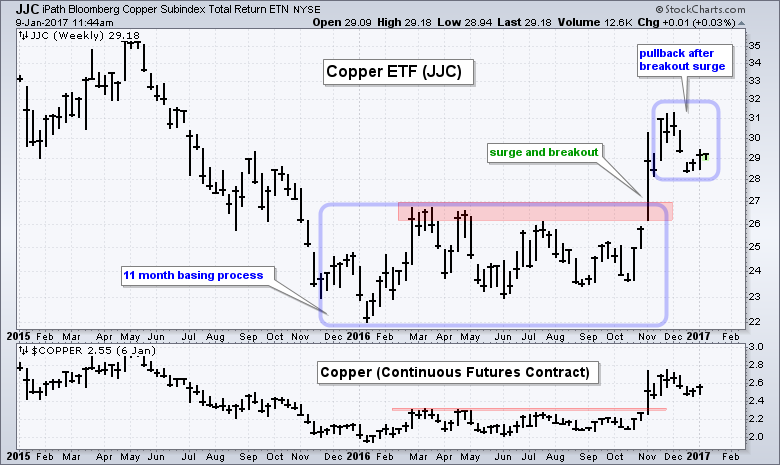
Copper Hits Key Fibonacci Level after Shallow Pullback
by Arthur Hill,
Chief Technical Strategist, TrendInvestorPro.com
The Copper ETN (JJC) broke out with a big surge in October-November and then pulled back in December. This pullback looks like a normal correction after a big move and chartists should be alert for a continuation higher. The weekly chart shows JJC and the Copper Continuous Futures Contract ($COPPER)...
READ MORE
MEMBERS ONLY
SystemTrader - Testing the January Barometer - 50 Years of Gravy - 17 Years of Famine
by Arthur Hill,
Chief Technical Strategist, TrendInvestorPro.com
SystemTrader .... Testing the January Barometer .... Long-term Bullish Bias for Stocks is Clear .... Setting Up the Backtest .... 1950 to 2016 - The Big Test .... 1950 to 1999 - The Gravy Train .... 2000 to 2016 - The Lean Years .... Conclusions.... .... //// ........
Testing the January Barometer
Greg Morris' yearend blog post (New Year...
READ MORE
MEMBERS ONLY
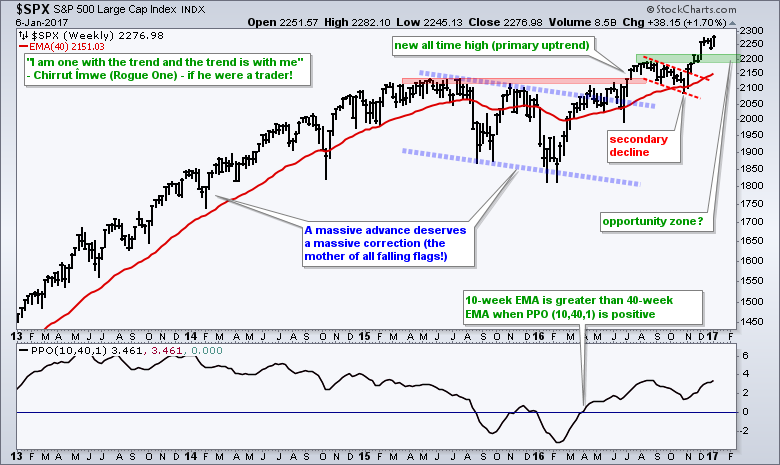
I am One with the Trend and the Trend is with Me
by Arthur Hill,
Chief Technical Strategist, TrendInvestorPro.com
I recently saw the new Star Wars movie, Rogue One, and found a way to tie technical analysis to one of the more interesting characters. This happens all of the time because technical analysis is so ingrained in my membrane. Chirrut Îmwe is a blind warrior monk who repeated: "...
READ MORE
MEMBERS ONLY
Video - SPY through the Mean-Reversion Lens and the Trend-Breakout Lens - IJR Leads - ChartList Update (30 stocks)
by Arthur Hill,
Chief Technical Strategist, TrendInvestorPro.com
SPY through the Mean-Reversion Lens .... SPY through the Trend-Breakout Lens .... Small-caps Continue to Lead (IJR and QQQ) .... Five Sector SPDRs Get Oversold Bounces .... Chartlist Update (30 Stocks including the Fab 5) .... //// .... Commentary Video ----- Art's Charts ChartList (updated 5-Jan) -----
SPY through the Mean-Reversion Lens
There is a...
READ MORE
MEMBERS ONLY
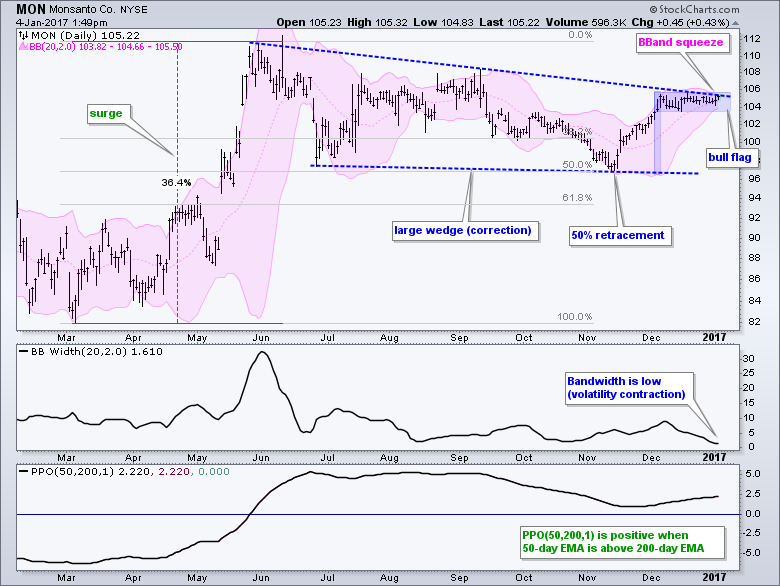
Squeeze Play Hits Monsanto at Key Juncture
by Arthur Hill,
Chief Technical Strategist, TrendInvestorPro.com
Monsanto (MON) is in the midst of a tight consolidation and the resolution of this consolidation could trigger a big breakout. Let's first start with the bigger picture. MON surged 36.4% from March to June and then corrected with a large wedge. The low of this wedge...
READ MORE
MEMBERS ONLY
Webinar Video - Tides, Waves and Ripples - Checking the Primary Trends for Stocks, Bonds, Oil, Gold and the Dollar
by Arthur Hill,
Chief Technical Strategist, TrendInvestorPro.com
----- Webinar Video ----- Art's Charts ChartList -----
Tides, Waves, Ripples and Charles Dow .... Primary and Secondary Trend for SPY .... Using 5-day RSI for the Minor Trend .... QQQ Becomes Oversold as IJR Stalls .... Bonds are Not the Place to Be Right Now .... Oil Extends Slow Uptrend .... Primary Downtrend...
READ MORE
MEMBERS ONLY
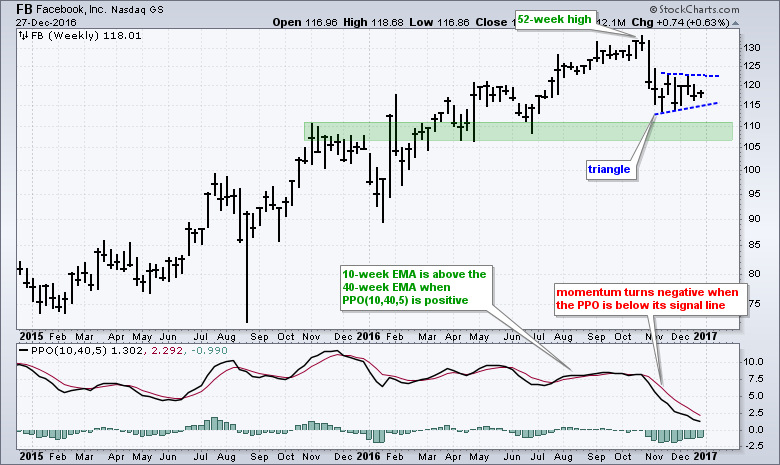
Facebook Continues to Stall - Here's What to Watch $FB
by Arthur Hill,
Chief Technical Strategist, TrendInvestorPro.com
The Nasdaq 100 ETF and S&P 500 SPDR hit new highs in mid December, but Facebook (FB) did not partake in these new highs and remains stuck in a consolidation. Even though relative weakness since late October is negative, the stock remains in a long-term uptrend and we...
READ MORE
MEMBERS ONLY
Rethinking Healthcare and Biotech - Telecoms Defy T-Yield Surge - Yield Curve Turns Up - XLF Near 2007 High
by Arthur Hill,
Chief Technical Strategist, TrendInvestorPro.com
Rethinking Healthcare .... Breadth Indicators for Healthcare Remain Net Bearish .... Biotech ETFs Extend the Long Stall .... HealthCare Providers ETF Holds Bull Flag .... Medical Devices ETF Firms in Potential Reversal Zone .... Telecoms Surge along with Treasury Yields .... Yield Curve Turns Up .... 2007 Comparison Suggests Room-to-Run for XLF .... Do Dividends Matter? .... Regional Banks...
READ MORE
MEMBERS ONLY
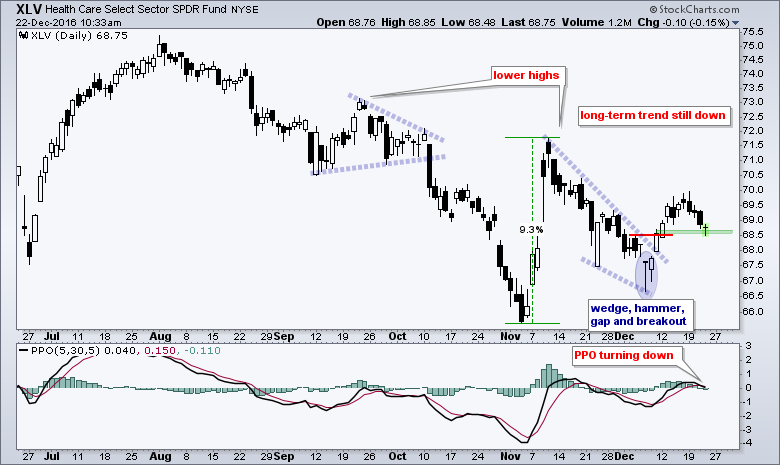
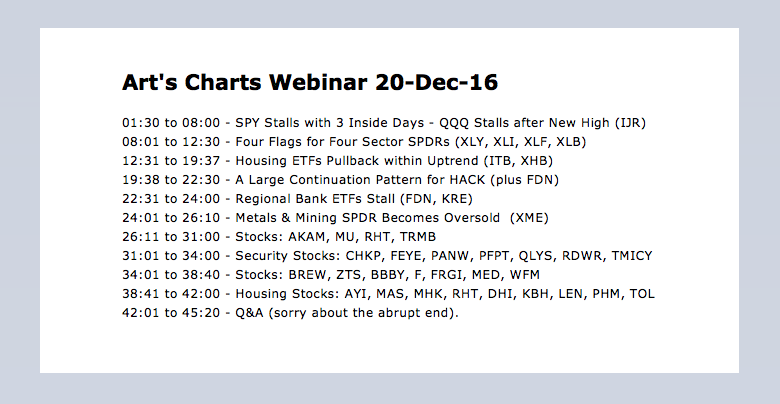
Webinar Video - 3 Consecutive Inside Days for SPY - Bull Flags in Several ETFs - A Big Continuation Pattern for HACK
by Arthur Hill,
Chief Technical Strategist, TrendInvestorPro.com
SPY Stalls with 3 Inside Days .... QQQ Stalls after New High .... Four Flags for Four Sector SPDRs .... Housing ETFs Pullback within Uptrend .... A Large Continuation Pattern for HACK .... Metals & Mining SPDR Becomes Oversold .... Webinar Preview .... //// ....
SPY Stalls with 3 Inside Days ....
The major index ETFs stalled over the last...
READ MORE
MEMBERS ONLY
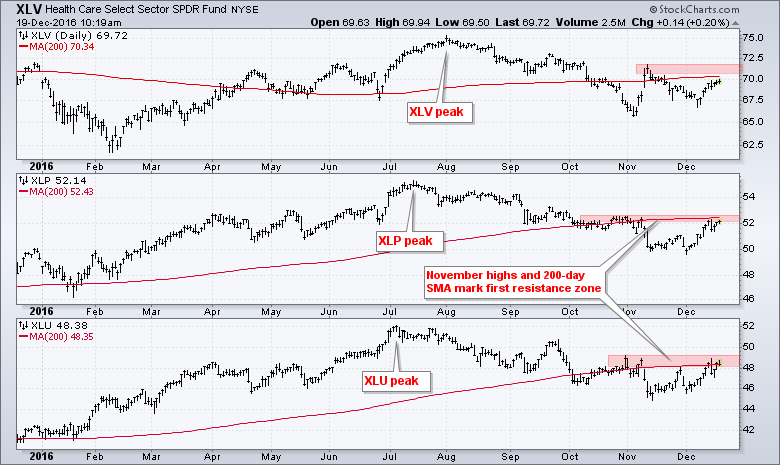
Defensive Sectors Hit Moment of Truth
by Arthur Hill,
Chief Technical Strategist, TrendInvestorPro.com
The HealthCare SPDR (XLV), Consumer Staples SPDR (XLP) and Utilities SPDR (XLU) are lagging the broader market in 2016, but they are now challenging their 200-day moving averages with bounces this month. The chart below shows these three sectors peaking in July-August and moving lower the last four to five...
READ MORE
MEMBERS ONLY
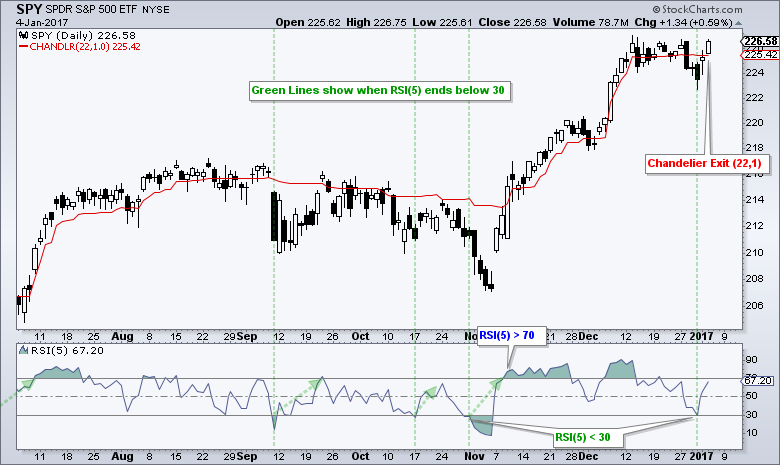
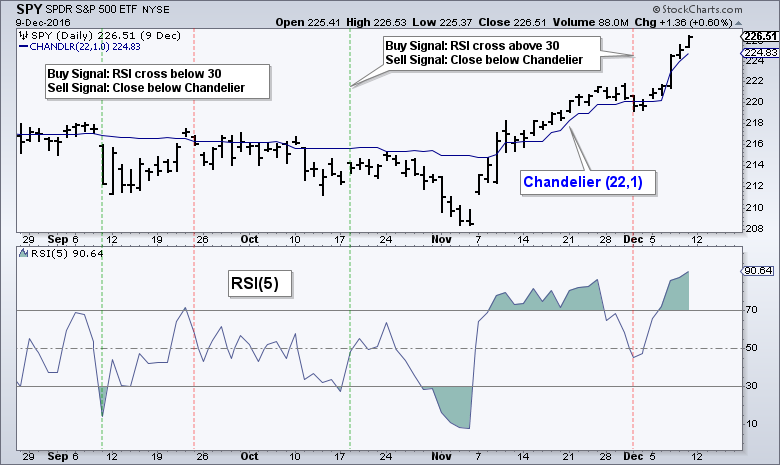
SystemTrader - Testing a Mean-Reversion System with the Chandelier Exit (SPY, QQQ, IJR) - RSI(5)
by Arthur Hill,
Chief Technical Strategist, TrendInvestorPro.com
Last week's System Trader article tested a mean reversion system using 5-day RSI for entries and exits. This article will test a system using 5-day RSI for entries and the Chandelier Exit for exits. This is an attempt to trail the stop-loss and ride some winners. This is...
READ MORE
MEMBERS ONLY
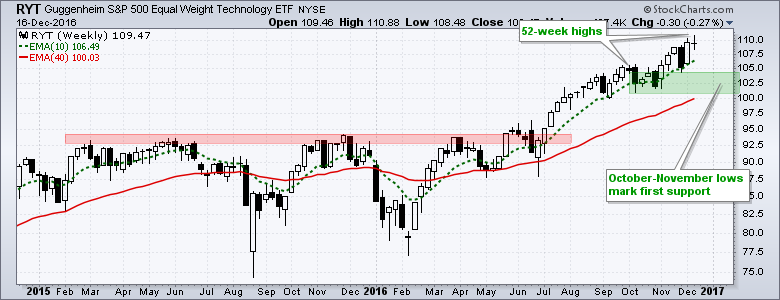
Tech Sector and Key Tech Groups are Still Leading
by Arthur Hill,
Chief Technical Strategist, TrendInvestorPro.com
Even though the finance, energy and industrials sectors are grabbing most of the headlines these days, the tech sector is doing just fine with the Nasdaq 100 ETF (QQQ), the Nasdaq 100 EW ETF (QQEW), the Technology SPDR (XLK) and the EW Technology ETF (RYT) hitting new highs this week....
READ MORE
MEMBERS ONLY
Setting the Market Environment with One Chart - Techs Lead with New Highs - XLV Follows Up Hammer
by Arthur Hill,
Chief Technical Strategist, TrendInvestorPro.com
Setting the Market Environment with One Chart .... Marking First Support for SPY .... QQQ Breaks out of Consolidation .... Tech Stocks are Still Leading ..... XLV Follows Through on Weekly Hammer .... Biotech ETFs Attempt to Firm .... //// ....
I am starting with my most important chart for the stock market. This is my go-to chart...
READ MORE
MEMBERS ONLY
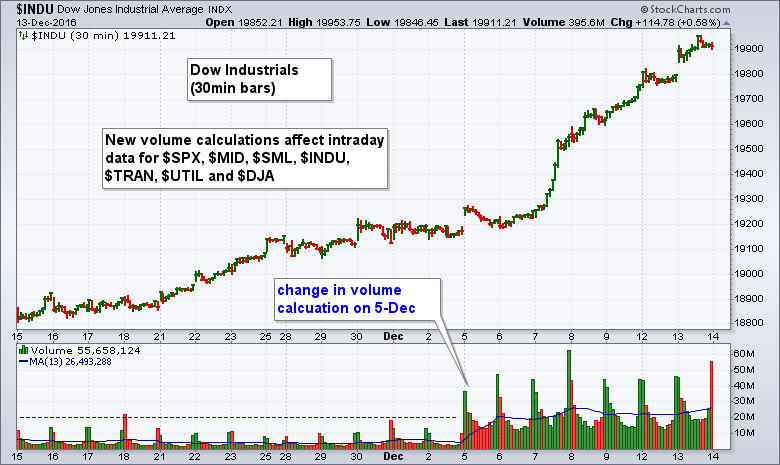
What's the Deal with that Intraday Volume Spike on the Dow?
by Arthur Hill,
Chief Technical Strategist, TrendInvestorPro.com
There has been a big change to intraday data for S&P Dow Jones Indices and chartists using volume indicators should take this into consideration. Basically, S&P Dow Jones started using data from the "Consolidated Tape of all recognized U.S. exchanges". This change resulted...
READ MORE
MEMBERS ONLY
Webinar Video - Another High for SPY - QQQ and IJR Remain on Signal - XLV Breaks Out, but Biotechs Hold Back
by Arthur Hill,
Chief Technical Strategist, TrendInvestorPro.com
----- Webinar Video ----- Art's Charts ChartList -----
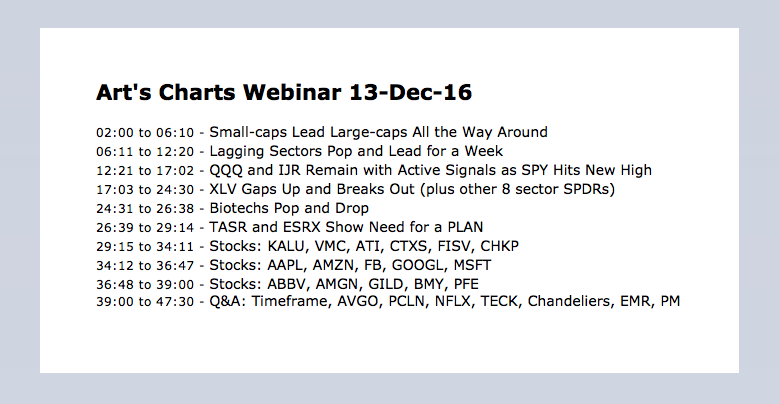
SPY Hits Yet Another New High .... QQQ and IJR Remain with Active Signals .... Small-caps Lead Large-caps All the Way Around .... Lagging Sectors Pop and Lead for a Week .... XLV Gaps Up and Breaks Out .... Biotechs Pop and Drop .... TASR and...
READ MORE
MEMBERS ONLY
Small-caps Lead New High List
by Arthur Hill,
Chief Technical Strategist, TrendInvestorPro.com
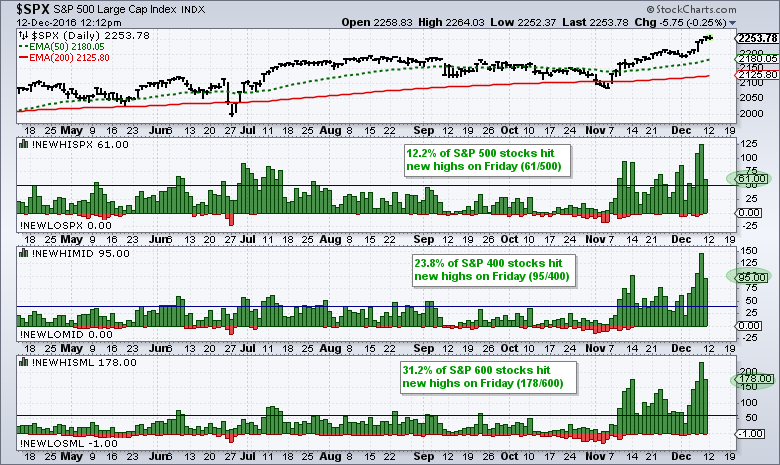
As a percentage of total issues, small-caps are churning out more new highs than large-caps and leading the market. The chart below shows new highs (green) and new lows (red) for the S&P 500, S&P MidCap 400 and S&P Small-Cap 600 over the last...
READ MORE
MEMBERS ONLY
SystemTrader - Testing and Tweaking a Mean-Reversion System for SPY, QQQ and IJR
by Arthur Hill,
Chief Technical Strategist, TrendInvestorPro.com
SystemTrader .... An RSI Mean-Reversion System .... Setting Market Conditions .... System Rules .... Why 5-day RSI and 30/70? .... The Four Backtests .... Key Performance Metrics .... Test Tables: Buy Cross Above/Below 30 and Sell Cross Above/Below 70.... Conclusions - IJR is King .... Further Study .... //// ........
Testing and Tweaking RSI(5) with SPY, QQQ...
READ MORE
MEMBERS ONLY
Equal-weights Lead - Stock Supply Shrinks - IJR > IWM - QQQ Surges after RSI Signal - Charting the Fab Five - 4 Homebuilder Stocks
by Arthur Hill,
Chief Technical Strategist, TrendInvestorPro.com
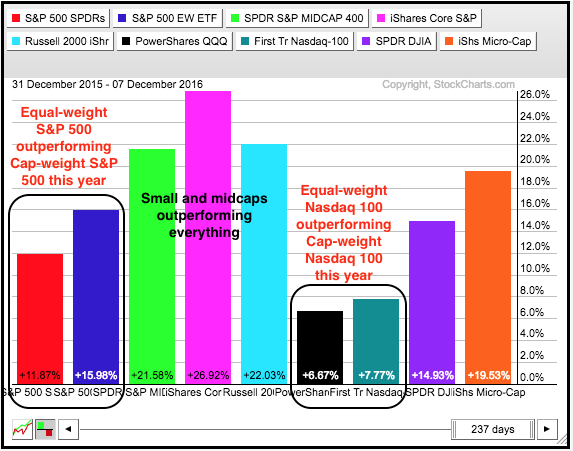
Equal-weights are Leading Large-caps .... IJR is Greater than IWM .... Supply of Stocks Continues to Shrink .... QQQ Surges within Uptrend .... Trailing the Bull Flag Breakout in IWM .... Charting the Fab Five (FB, AAPL, AMZN, GOOGL, MSFT) .... Leadership from Consumer Discretionary is Very Positive .... Four Homebuilder Stocks to Watch (DHI, KBH, LEN,...
READ MORE
MEMBERS ONLY
Can Apple Follow through on Weekly Reversal?
by Arthur Hill,
Chief Technical Strategist, TrendInvestorPro.com
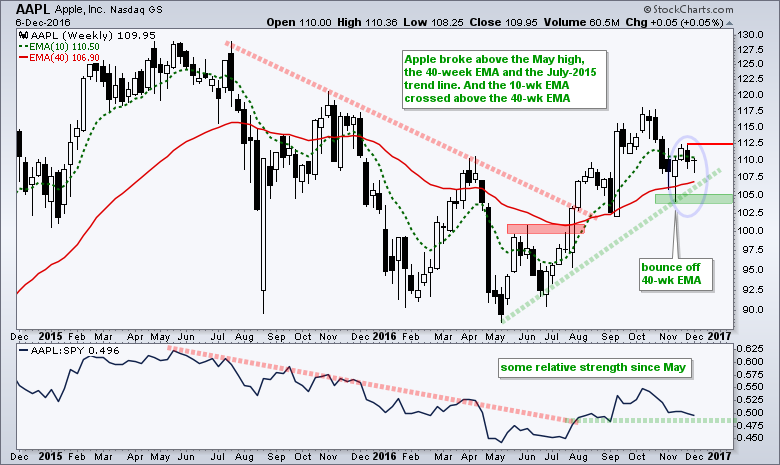
Apple (AAPL) reversed its long-term downtrend with a series of breakouts this summer and the stock is currently trading over 20% above its May low. Notice how the stock broke the early June high, the red trend line and the 40-week EMA with a surge in July-August. The 10-week EMA...
READ MORE
MEMBERS ONLY
Time to Go Slow on XLF, XLI and KRE? - Channel Target for XME - Webinar Video
by Arthur Hill,
Chief Technical Strategist, TrendInvestorPro.com
----- Webinar Video ----- Art's Charts ChartList -----
Slow Down Time for XLF, XLI, and KRE? .... XME Target Based on Rising Channel .... Broken Resistance Turns First Support for XES .... EuroTop Index Stalls Near Resistance .... Webinar Preview.... //// ....
Slow Down Time for XLF, XLI, and KRE?
The Finance SPDR (XLF)...
READ MORE
MEMBERS ONLY
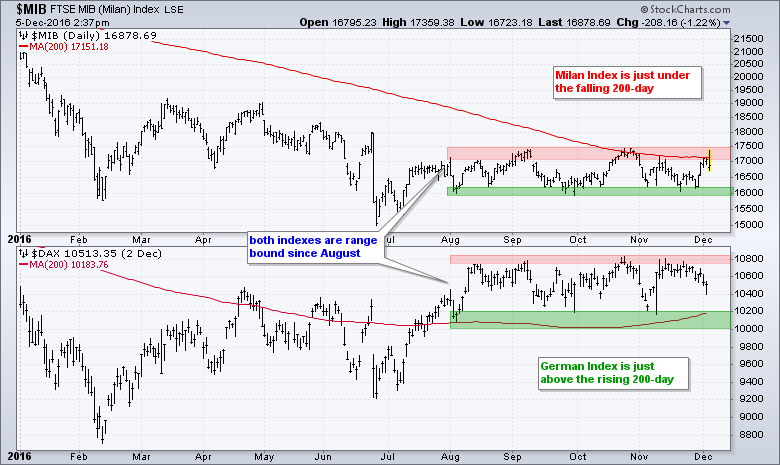
Italian and German Indexes Battle Different Sides of Key Moving Average
by Arthur Hill,
Chief Technical Strategist, TrendInvestorPro.com
The chart below shows year-to-date price action for the Milan Index ($MIB) and German DAX Index ($DAX). Note that the MIB is down around 22% year-to-date and the DAX is down around 2% since January. In contrast, the S&P 500 is up around 6% so far this year....
READ MORE
MEMBERS ONLY
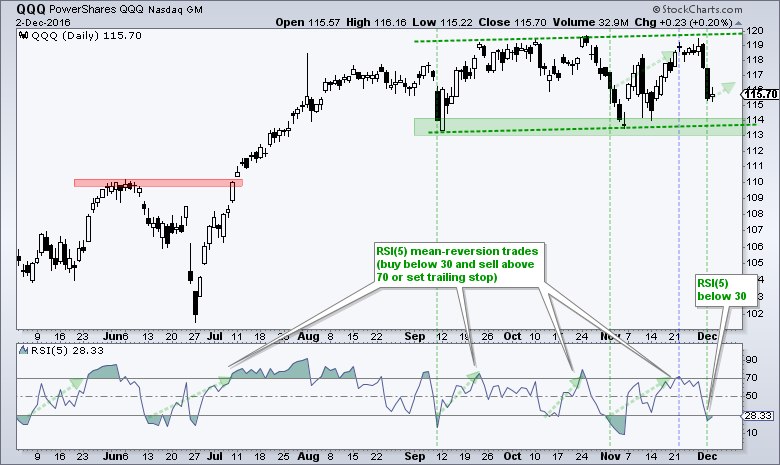
A Bull Flag for IWM - Short-Term RSI Setup for QQQ - 3 Sector SPDR Setups - ChartList Update (13 Stocks)
by Arthur Hill,
Chief Technical Strategist, TrendInvestorPro.com
An RSI(5) Setup for QQQ .... IWM Corrects with Bull Flag .... Three Sector SPDRs with Short-term Bullish Setups .... Biotechs Hold the Key to Healthcare .... ChartList Update .... QCOM, SYMC, ACN, ATI, AVGO, CHKP, CTRL, AMGN, BMY, MRK, PFE, TASR and XOM .... //// ....
An RSI(5) Setup for QQQ
QQQ plunged on Wednesday-Thursday...
READ MORE
MEMBERS ONLY
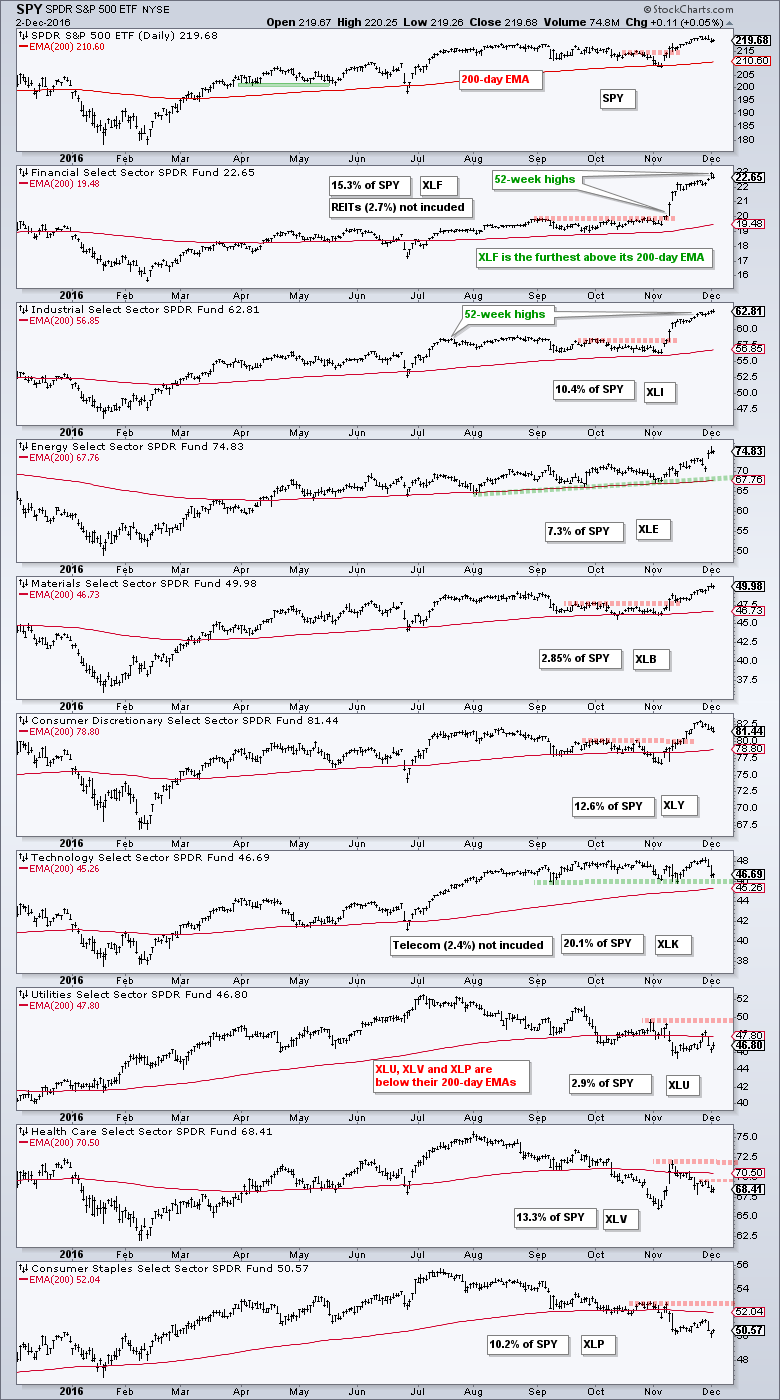
Sum of the Parts Analysis for the S&P 500
by Arthur Hill,
Chief Technical Strategist, TrendInvestorPro.com
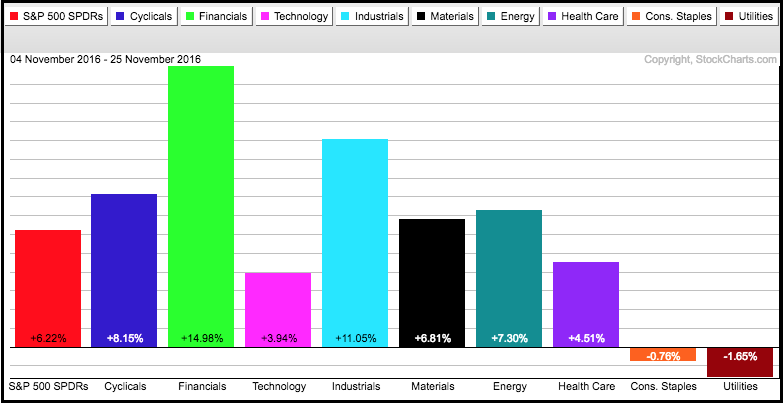
The whole is only as strong as the sum of its parts. Applying this logic to the stock market, the S&P 500 represents the whole and the nine sector SPDRs represent the sum of the parts. Let's see just how strong the parts of the S&...
READ MORE
MEMBERS ONLY
QQQ Lags, but Remains Bullish - Downloading Data and Creating Indexes - The Case for a Grind Higher
by Arthur Hill,
Chief Technical Strategist, TrendInvestorPro.com
Charting 52-week Highs on SPY .... QQQ Lags, but Chart Remains Bullish .... Downloading Data and Creating User-Defined Indexes .... Small-caps Ripe for Rest, but Still Bullish .... Top Ten Large-caps are Greater than All Small-caps .... The Case for a Grind Higher .... Scanning for Percent Above/Below EMA .... //// ....
Charting 52-week Highs on SPY
The...
READ MORE
MEMBERS ONLY
SPY is Last One Standing - XLF Defines Overbought Readings - Adjusting RSI for Trend Identification
by Arthur Hill,
Chief Technical Strategist, TrendInvestorPro.com
SPY is the Last One Standing .... XLF Defies Overbought Readings .... Materials Follows thru on Pennant Breakout .... Bigger Uptrend Overpowers Short-term Dip in XLE .... Adjusting RSI for Trend Identification .... Healthcare Remains Under Pressure .... //// ....
SPY is the Last One Standing
Modest selling pressure over the last three days triggered Chandelier Exits in...
READ MORE
MEMBERS ONLY
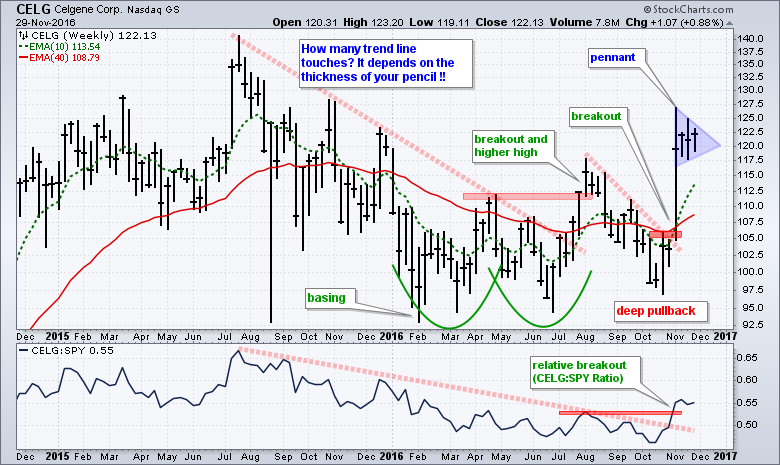
Base, Breakouts and Consolidation Bode well for this Big Biotech
by Arthur Hill,
Chief Technical Strategist, TrendInvestorPro.com
Celgene (CELG) showed bullish price action throughout 2016 and recently formed a bullish pennant that could set up an even more bullish 2017. Let's work from left to right on this chart starting with the big base that looks like a double bottom. CELG broke the "thick&...
READ MORE
MEMBERS ONLY
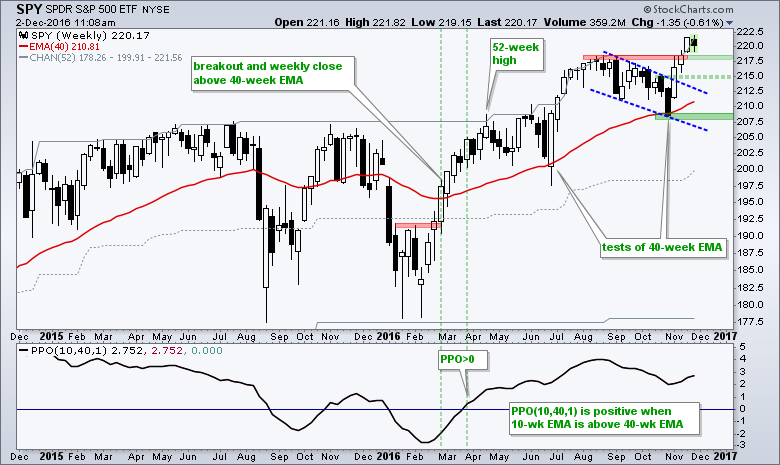
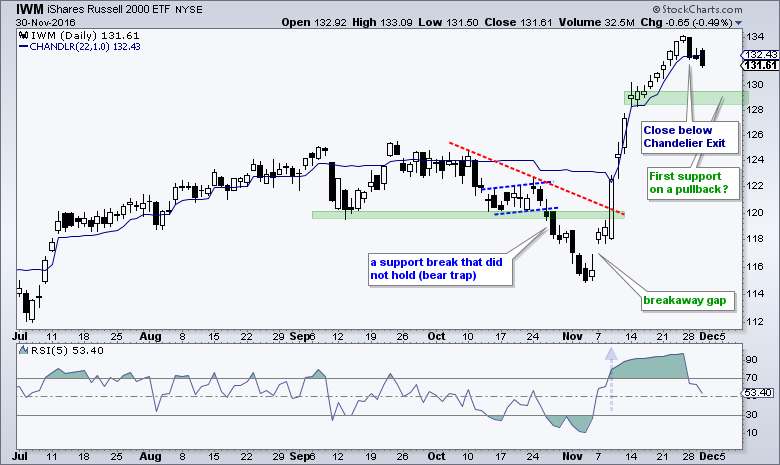
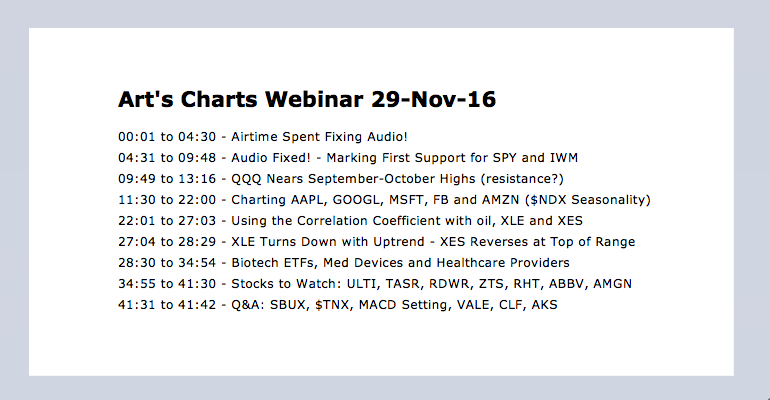
Marking First Support for SPY/IWM - QQQ Resistance? - Charting the Fab 5 (AAPL, GOOGL, MSFT, FB, AMZN) - Webinar Video
by Arthur Hill,
Chief Technical Strategist, TrendInvestorPro.com
----- Webinar Video ----- Art's Charts ChartList -----
Staples and Utilities Bounce During Pullback .... Marking First Support for SPY and IWM .... QQQ Nears September-October Highs .... Charting the Fab Five: AAPL, GOOGL, MSFT, FB and AMZN .... Oil Turns Volatile ahead of OPEC Meeting (USO, XLE, XES) .... //// ....
Staples and Utilities...
READ MORE
MEMBERS ONLY
Big Blue Notches a 52-week High
by Arthur Hill,
Chief Technical Strategist, TrendInvestorPro.com
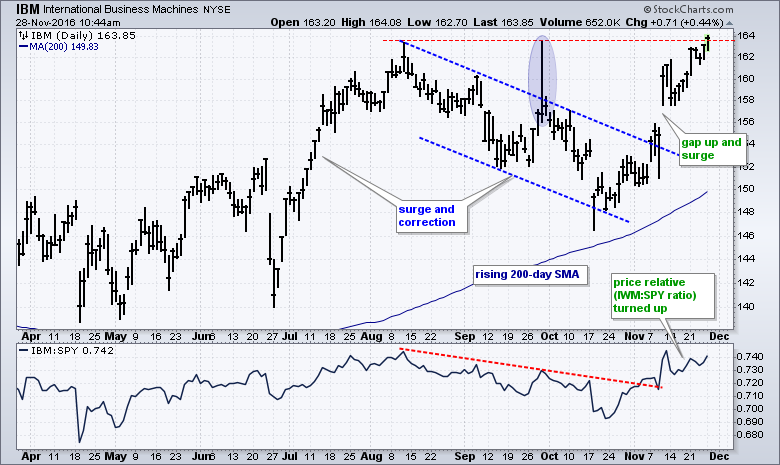
Even though its bell-weather status diminished over the years, IBM is still a big blue chip stock and remains a titan in the technology sector. Thus, a 52-week high in IBM bodes well for the market overall and the tech sector. The chart below shows IBM surging with the market...
READ MORE
MEMBERS ONLY
Overbought is Hard to Define and even Harder to Trade - Biotechs Recover to Keep Pullback Patterns Alive - ChartList Update
by Arthur Hill,
Chief Technical Strategist, TrendInvestorPro.com
Small-caps, Finance and Industrials Lead (sector PerfChart) .... The Overbought Progression (IWM, SPY, QQQ) .... Biotechs Recover to Keep Pullback Patterns in Play (XBI, IBB, XLV) .... Six of Nine Sectors with Active Golden Crosses .... New High Parade Shows Broad Strength (sector and industry group ETFs) .... ChartList Update (CHKP, INVN, RHT, SQ, AMGN,...
READ MORE
MEMBERS ONLY
Exxon Mobil is Lagging, but MACD is Firming and could be Turning
by Arthur Hill,
Chief Technical Strategist, TrendInvestorPro.com
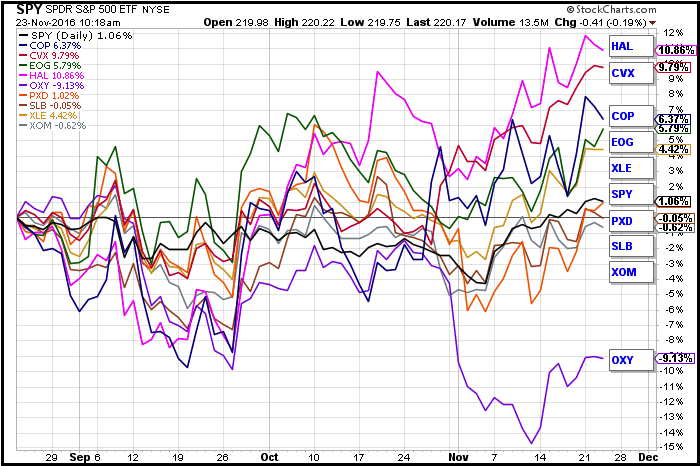
The Energy SPDR (XLE) hit a new 52-week high this week, but its largest component, Exxon Mobil (XOM) remains well below its summer high and is not participating. The second biggest component, Chevron (CVX), is leading the charge with a 6+ percent advance in November and a 52-week high. Note...
READ MORE
MEMBERS ONLY
Breadth Lines Hit New Highs - Trailing with a Chandelier Exit - Leading Sectors - An Island Reversal for XLV - Webinar Video
by Arthur Hill,
Chief Technical Strategist, TrendInvestorPro.com
-----Webinar Video ----- Art's Charts ChartList -----
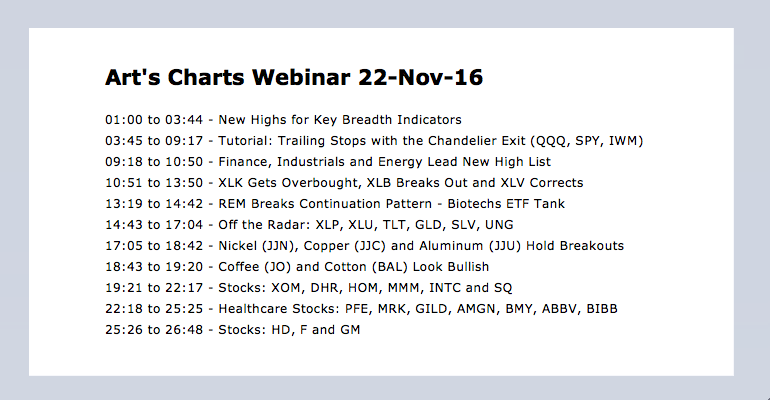
New Highs for Key Breadth Indicators .... Trailing with the Chandelier Exit .... QQQ Joins the Overbought Ranks .... Finance, Industrials and Energy .... Lead New High List .... XLK Becomes Overbought .... XLB Breaks out of Pennant .... XLV Corrects after Island Reversal .... REM Breaks Continuation Pattern...
READ MORE