MEMBERS ONLY
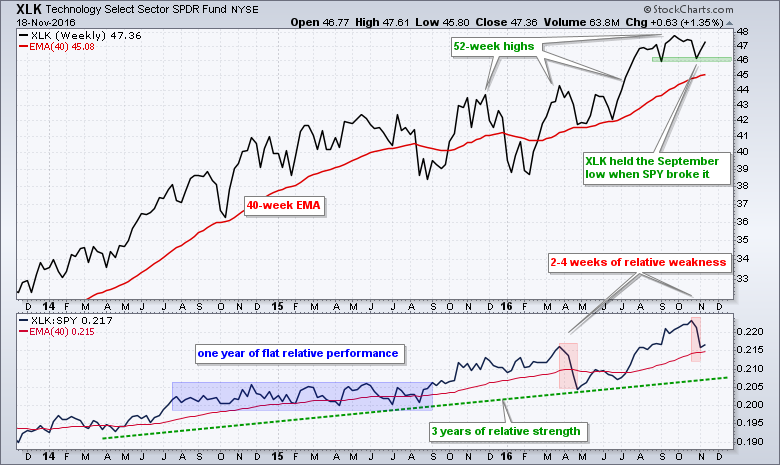
Technology SPDR: Lagging for 3 Weeks and Leading for 3 Years
by Arthur Hill,
Chief Technical Strategist, TrendInvestorPro.com
Despite relative weakness the last few weeks, XLK remains in a clear uptrend and shows no signs of weakness on the price chart. First, note that XLK recorded 52-week highs throughout 2016 and is currently less than 2% from a new high. Second, XLK held the September low when the...
READ MORE
MEMBERS ONLY
Breaking Down the Energy Sector - Oil, Breadth and Trends - XLE and XES - Symbols for Futures Contracts
by Arthur Hill,
Chief Technical Strategist, TrendInvestorPro.com
Near-by Futures, Continuous Futures and ETFs .... December Crude Shows Signs of a Reversal .... Brent Crude is Holding up Better .... Upside Targets for Light Crude and Bren .... Energy Breadth Still Bullish Overall .... XLE Extends Choppy Uptrend .... XES Surges toward Range Resistance .... Symbols for Futures Contracts .... //// ....
Today's commentary will dissect...
READ MORE
MEMBERS ONLY
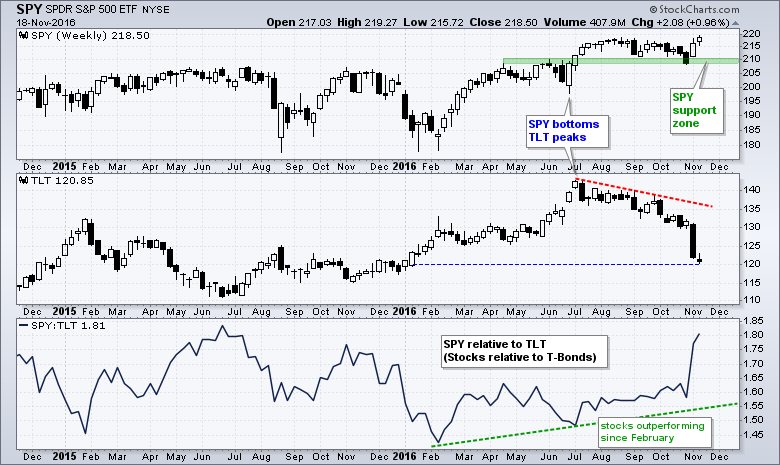
Move to Risk Began in July and Continued in November
by Arthur Hill,
Chief Technical Strategist, TrendInvestorPro.com
The market began its move to riskier assets in July and this move simply accelerated over the last two weeks. The chart below shows stocks (risk assets) bottoming in late June and Treasury bonds (safe-haven assets) peaking in early July. The S&P 500 SPDR (SPY) hit a new...
READ MORE
MEMBERS ONLY
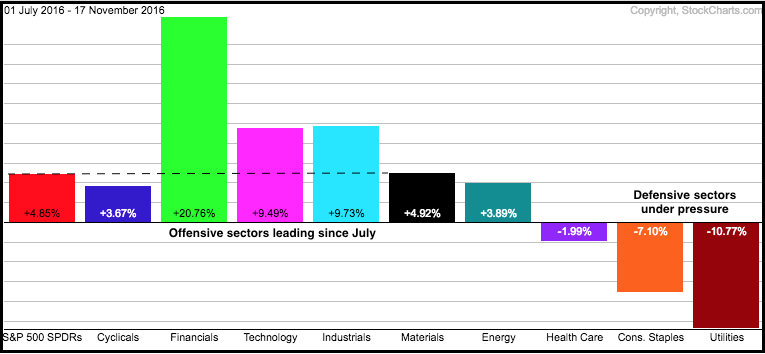
Another Bullish Breadth Surge - Marking Pullback Support for SPY - Biotech ETFs Hold Gaps
by Arthur Hill,
Chief Technical Strategist, TrendInvestorPro.com
Offensive Sectors Lead Defensive Sectors ..... Consumer Discretionary ETFs Hit New Highs .... Risk Ratios Hit New Highs .... This Week's Articles and ChartList .... Another Bullish Breadth Surge .... Marking Pullback Support for SPY .... Biotech ETFs Hold Gaps .... Medical Devices ETF Bounces off Retracement .... //// ....
Offensive Sectors Lead Defensive Sectors ....
The market began...
READ MORE
MEMBERS ONLY
Spotting Pullbacks and Upturns with RSI and MACD-Histogram - Scan Code
by Arthur Hill,
Chief Technical Strategist, TrendInvestorPro.com
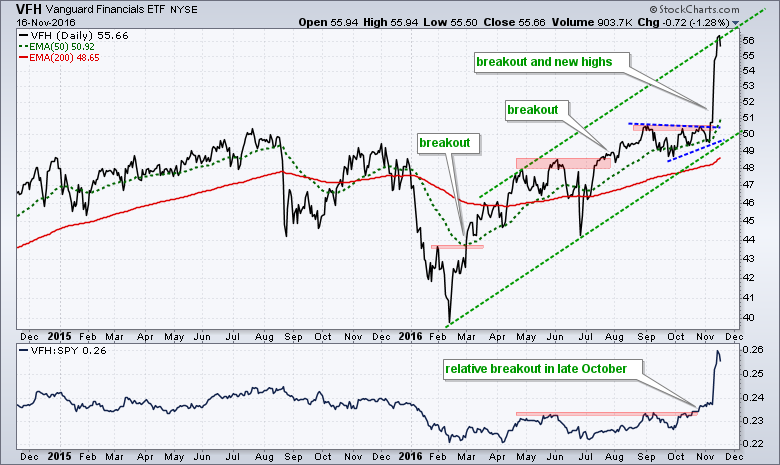
Vanguard Financials ETF Hits Channel Trend Line .... Spotting Pullbacks within an Uptrend .... Trading with MACD-Histogram and RSI .... Scan Code for Pullbacks .... Microsoft and Apple Trigger Signals.... //// ....
Vanguard Financials ETF Hits Channel Trend Line
Many stocks and ETFs surged over the last two weeks and became short-term overbought. Keep in mind...
READ MORE
MEMBERS ONLY
Watch this Key Stock for Clues on Housing and Retail
by Arthur Hill,
Chief Technical Strategist, TrendInvestorPro.com
Home Depot is the perfect cyclical stock because it sits at the crossroads of retail, housing and the consumer. The stock was a poster child of the bull market with a 200+ percent gain from 2013 to 2015. It did not stop there and even managed to hit new highs...
READ MORE
MEMBERS ONLY
Webinar Video - Market Shows Broad Strength - Overbought is not Bearish - Don't Blame all Techs - Economically Sensitive Sector Perks Up
by Arthur Hill,
Chief Technical Strategist, TrendInvestorPro.com
--- Webinar Video --- Art's Charts Chartlist ---
Stock Market Shows Broad Strength .... Record Highs in Mid-cap and Small-cap Indexes .... Don't Blame the Entire Tech Sector .... SPY Holds Breakout .... XLY Surges to Resistance Zone .... Consumer Discretionary Breadth Remains Bullish .... Scan Correction .... //// ....
Even though some stocks and...
READ MORE
MEMBERS ONLY
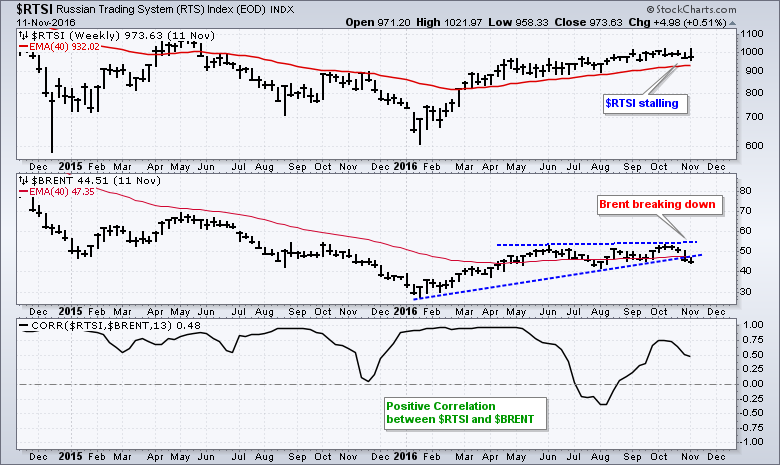
Russian Index Looks Vulnerable after Breakdown in Brent
by Arthur Hill,
Chief Technical Strategist, TrendInvestorPro.com
The Russian Trading System Index has yet to break down, but it is positively correlated to Brent Crude and the recent breakdown in Brent could foreshadow a breakdown in the Russian Index. The chart shows the index stalling just above its rising 40-week EMA over the last few months. Meanwhile,...
READ MORE
MEMBERS ONLY
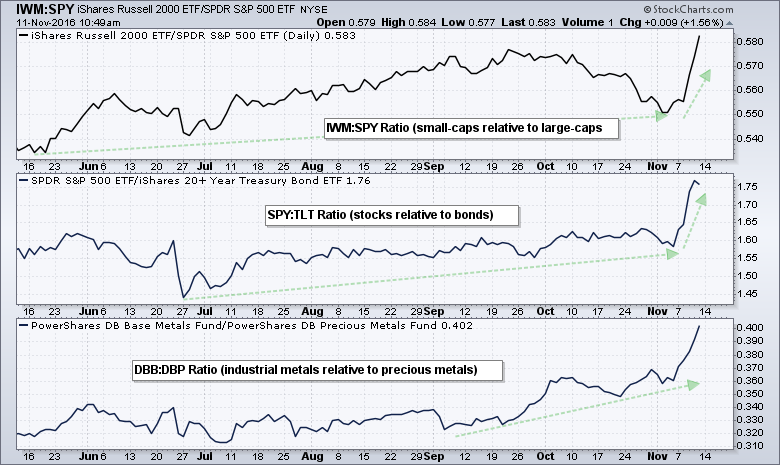
3 Ratios Showing Risk On - Small-Caps Lead New High List - Scanning for New Highs - A Relative Breakdown for EEM
by Arthur Hill,
Chief Technical Strategist, TrendInvestorPro.com
Three Ratios Showing Risk-On .... Small-caps Lead New High Expansion .... Finding and Scanning for New Highs .... How to Use a New High List .... Notes from the MTA Meeting ... A Relative Breakdown for EEM .... //// ....
Three Ratios Showing Risk-On
While there is no guarantee that the wicked rotations of the last two days...
READ MORE
MEMBERS ONLY
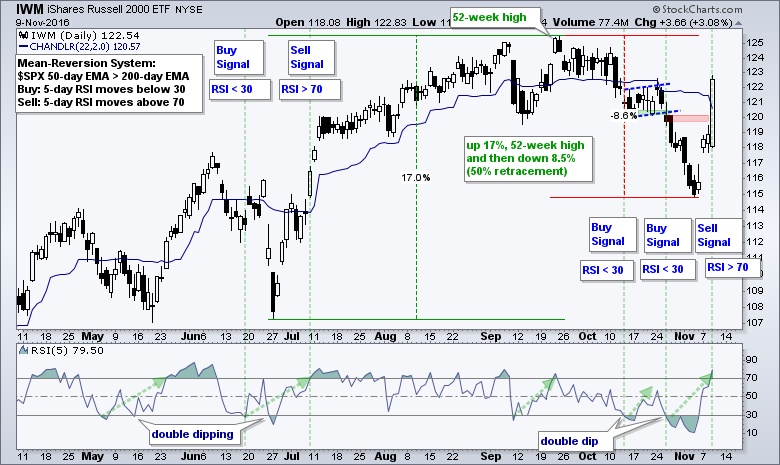
IWM and SPY Hit Key RSI Levels - Sectors Leading on New High List and %Above 200-day - Oil Gets Feeble Bounce
by Arthur Hill,
Chief Technical Strategist, TrendInvestorPro.com
Mean-Reversion Strategy Hits Key Level .... SPY Breaks Out of Corrective Channel .... Finance, Industrials and Materials Dominate New High List .... Ranking Sectors by %Above 200-day EMA .... Industrials, Materials and Mining Surge Together .... Oil Greets Moment-of-truth with Feeble Bounce .... //// ....
Mean-Reversion Strategy Hits Key Level
Developing a trading system is sometimes easier than...
READ MORE
MEMBERS ONLY
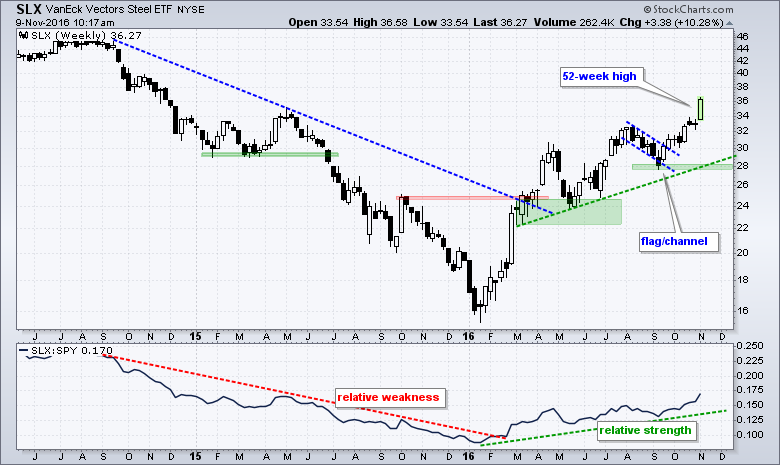
Steel Stocks Lead Stock Market with New Highs
by Arthur Hill,
Chief Technical Strategist, TrendInvestorPro.com
The Steel ETF (SLX) is leading the stock market on Monday with a 10% gain in early trading. Notice that this gain is simply extending an existing trend. In other words, chartists would have done just find by looking at the chart and ignoring the news. Notice that SLX surged...
READ MORE
MEMBERS ONLY
Key Levels and Indicators for S&P 500 - Surge in Treasury Yields could Influence Other Groups - Biotech ETFs Buck the Selling Pressure
by Arthur Hill,
Chief Technical Strategist, TrendInvestorPro.com
Key Levels and Indicators to Watch for SPY .... Indicators are Not Bearish until they Trigger .... Treasury Yields Surge .... Will Correlations with the 10-yr Yield Hold Up? .... Biotech ETFs Try for Higher Lows.... //// ....
Key Levels and Indicators to Watch for SPY
The S&P 500 SPDR (SPY) fell 2.54%...
READ MORE
MEMBERS ONLY
3 Sectors Standout - Copper and Aluminum Go for Breakouts - Using RSI Ranges - Medium Trend Dominates IEF
by Arthur Hill,
Chief Technical Strategist, TrendInvestorPro.com
Finance, Tech and Industrials Show Chart Leadership .... Copper and Aluminum Go for Big Breakouts .... Using RSI Ranges to Define the Trend .... Gold Indicators are Bullish, but Price Breakdown Looms .... Rising 10-yr Yield is Negative to Gold .... Intermediate Trend Dominates 7-10 YR T-Bond ETF .... No Webinar this Week .... //// ....
Finance, Tech and...
READ MORE
MEMBERS ONLY
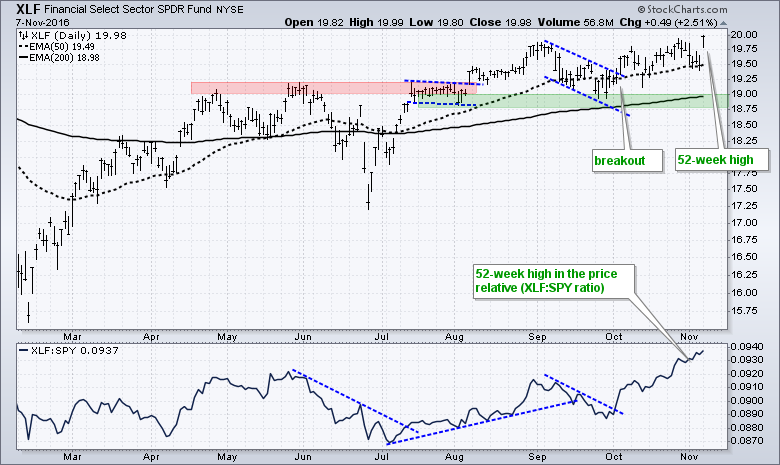
Finance SPDR Leads Market with New High
by Arthur Hill,
Chief Technical Strategist, TrendInvestorPro.com
The Finance SPDR (XLF) is leading the sector SPDRs with a new 52-week high on the price chart and with the price relative. On the price chart, XLF triggered its first breakout in early August with a move above the red resistance zone. Even though the ETF did not seem...
READ MORE
MEMBERS ONLY
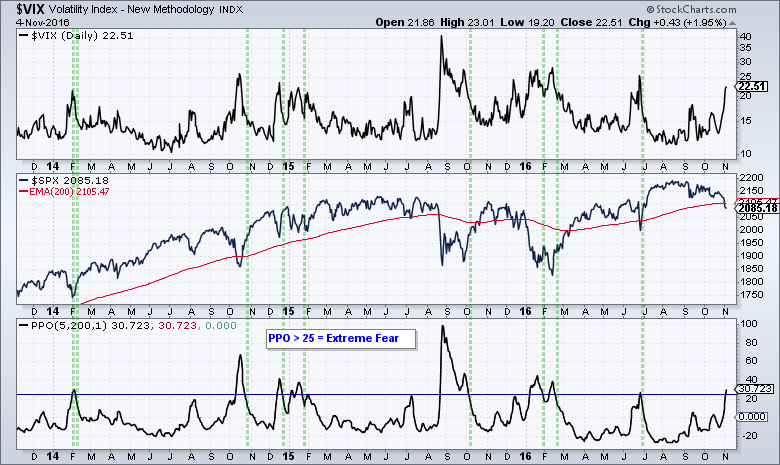
VIX Reaches a Momentum Extreme
by Arthur Hill,
Chief Technical Strategist, TrendInvestorPro.com
The S&P 500 fell softly (~3%) over the last nine trading days and the S&P 500 Volatility Index ($VIX) surged over 70%. This surge puts $VIX at its highest level in over three months - but this is not necessarily bearish. $VIX is a coincident indicator...
READ MORE
MEMBERS ONLY
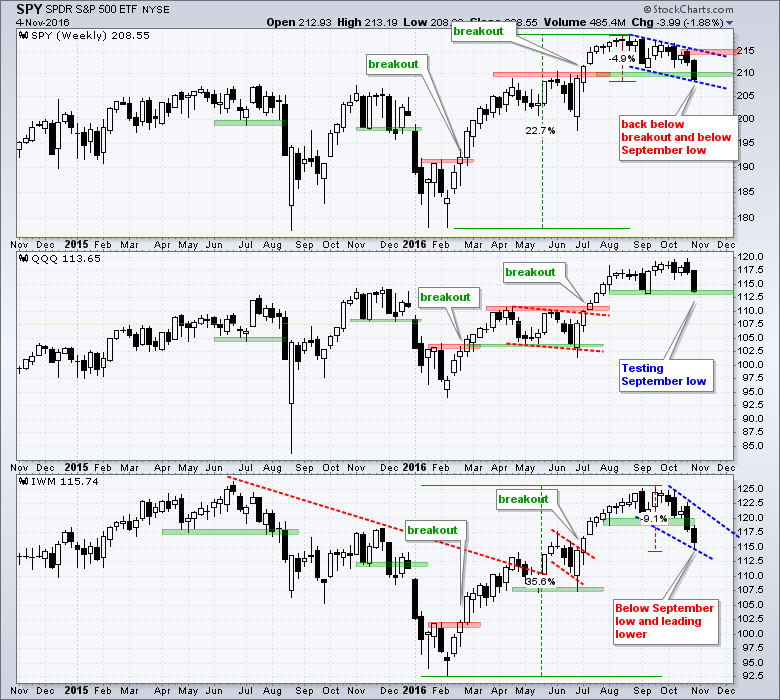
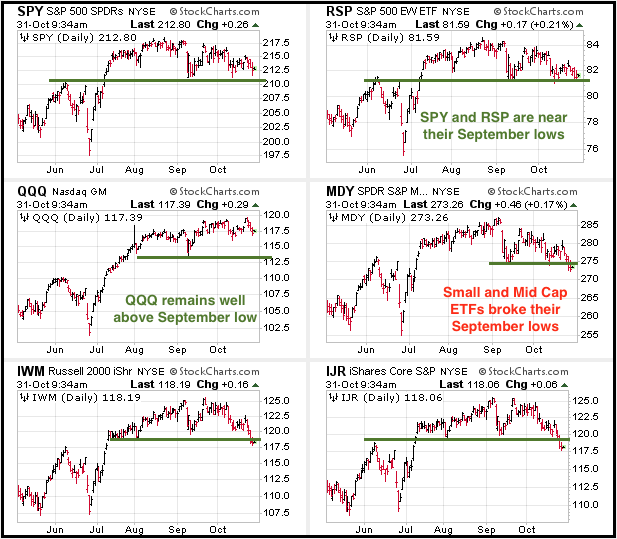
The Bigger they Surge, the Harder they Correct
by Arthur Hill,
Chief Technical Strategist, TrendInvestorPro.com
The S&P 500 SPDR (SPY) and the Russell 2000 iShares (IWM) both broke below their September lows with IWM leading the way lower. QQQ is still holding up the best because it hit a 52-week high the week before and remains above the September low. Looking at SPY...
READ MORE
MEMBERS ONLY
SystemTrader - How to become a Smooth Operator with Moving Averages - Backtesting Different Moving Average Pairs
by Arthur Hill,
Chief Technical Strategist, TrendInvestorPro.com
SystemTrader .... Why Focus on the S&P 500? .... Moving Averages Love Whipsaws .... Adding a Smooth Operator .... Backtesting Moving Average Performance .... Scaling into Positions with Moving Averages .... Backing testing an Array of EMAs .... Conclusions.... //// ....
Why Focus on the S&P 500?
The S&P 500 is the most...
READ MORE
MEMBERS ONLY
Bulls Still at Bat with Two Strikes - Using Key Lows to Find Chart Leaders and Laggards
by Arthur Hill,
Chief Technical Strategist, TrendInvestorPro.com
Another Seven Day Decline .... Channel Defines Correction in SPY .... Revisiting the Mean-Reversion Strategy .... Is Mean-Reversion Broken? .... Strike Two for the S&P 500 .... Benchmark Lows to Find Chart Leaders and Laggards .... Revisiting the ETF Scan .... //// ....
The S&P 500 closed down seven days in a row and this...
READ MORE
MEMBERS ONLY
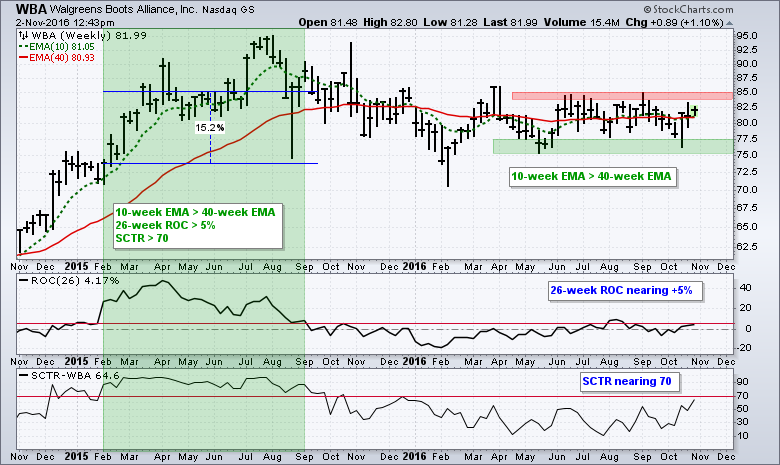
Walgreens Bucks the Selling Pressure and Shows Relative Strength $WBA
by Arthur Hill,
Chief Technical Strategist, TrendInvestorPro.com
It's been a rough five weeks for the broader market, but a few stocks and groups are still shining. The S&P 500 SPDR (SPY) is down around 2.5% and eight of nine sectors are down since the end of September. The Finance SPDR (XLF) is...
READ MORE
MEMBERS ONLY
SPY Holds the Line with a Spinning Top - IWM Does a Momentum Double Dip - Webinar Video
by Arthur Hill,
Chief Technical Strategist, TrendInvestorPro.com
Webinar Video -- Art's Charts ChartList
Performance for the First Ten Months .... Two Steps Forward and One Step Backward .... SPY Holds with a Spinning Top .... QQQ Continues to Lead .... RSI Does the Double Dip for IWM .... Webinar Preview .... //// ....
Performance for the First Ten Months
Even though we have...
READ MORE
MEMBERS ONLY
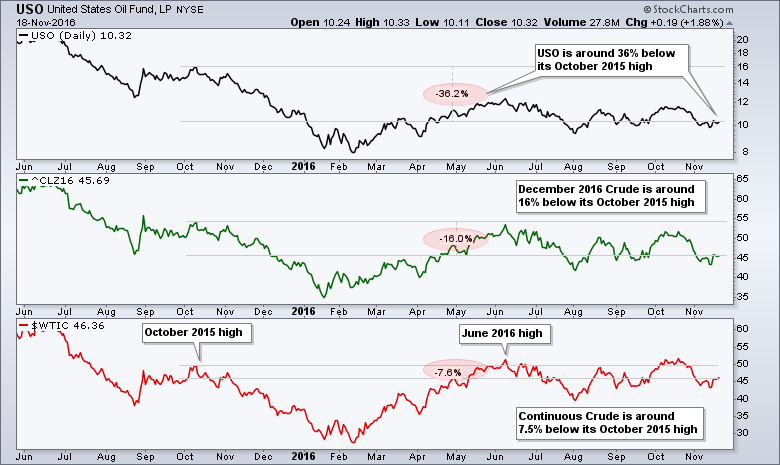
Crude Enters Second Weakest Month on a Down Note
by Arthur Hill,
Chief Technical Strategist, TrendInvestorPro.com
Light Crude fell sharply on the last trading day of October and ended the month down. Crude even poked its head above $52 twice during the month, but fell sharply the last two weeks of October and ended below $47. This reversal of fortune is especially interesting when we look...
READ MORE
MEMBERS ONLY
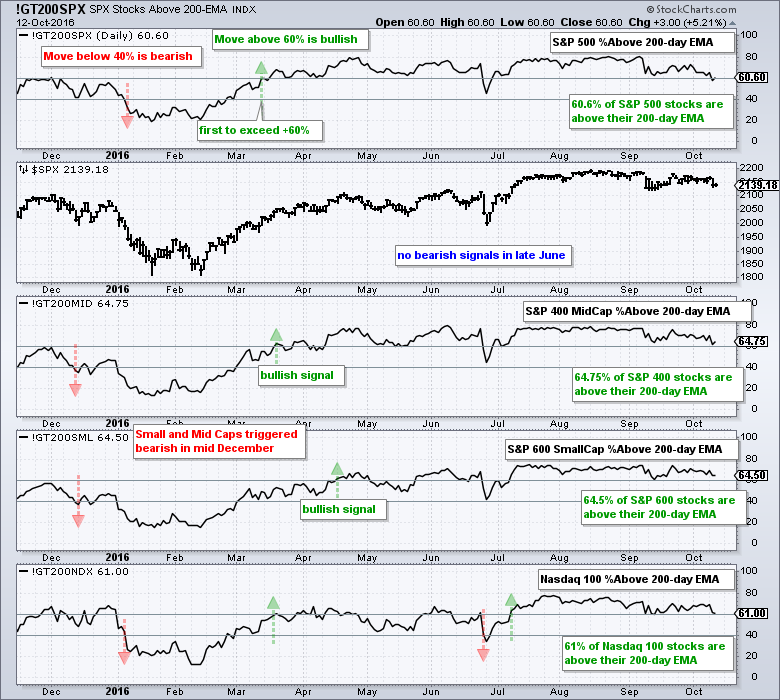
Just How Bad is this Pullback from New Highs? - Breadth Indicator Overview and Summary
by Arthur Hill,
Chief Technical Strategist, TrendInvestorPro.com
Major Index ETFs are Not that Far from Recent Highs .... Sticking with the Strategy .... Breadth Indicators Soften During Correction .... Small and Mid Caps Lead Breadth Pullback .... Breadth Summary and Conclusions .... //// ....
Stocks weakened over the last two months with small and mid caps leading the way lower the last six weeks....
READ MORE
MEMBERS ONLY
SystemTrader - Scanning for ETFs with Good Liquidity, Uptrends, Bullish Momentum and Relative Strength
by Arthur Hill,
Chief Technical Strategist, TrendInvestorPro.com
Lots of Low Liquidity .... Getting the ETF Master ChartPack .... Filtering for an Uptrend .... Ranking by StockCharts Technical Rank .... Ranking By Rate-of-Change .... Narrowing and Exporting Scan Results .... Analyzing with CandleGlance and RSI .... Conclusions .... //// ....
Introduction
Momentum and relative performance are related concepts that chartists can use to filter the ETF universe. Momentum...
READ MORE
MEMBERS ONLY
Performance Discrepancies in Key Industry Groups - Problems with Support Breaks in SPY and QQQ - Bonds Making a Move
by Arthur Hill,
Chief Technical Strategist, TrendInvestorPro.com
Performance Discrepancies Abound in Key Industry Groups .... The Problem with Support Breaks in an Uptrend (SPY, QQQ) .... Pattern Trading versus Mean-Reversion Systems (IWM) .... Day of Divergence (Breadth) .... Industrials Versus Consumer Discretionary .... Bonds, Yields, Utilities and Gold .... //// ....
Performance Discrepancies Abound in Key Industry Groups
The stock market remains in a real...
READ MORE
MEMBERS ONLY
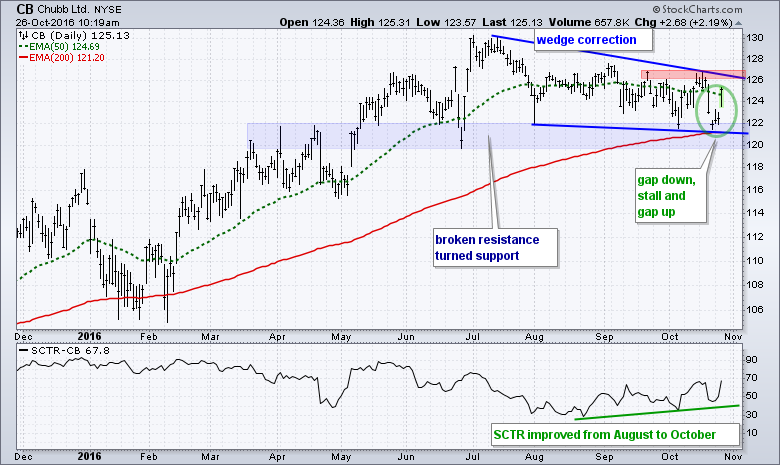
Chubb Reverses at Key Level with a Gap
by Arthur Hill,
Chief Technical Strategist, TrendInvestorPro.com
Chubb trended lower from July to October, but a gap-laden reversal off a big support zone suggests that this decline may be reversing. More importantly, this decline looks like a correction with a bigger uptrend. Let's look at the evidence for a long-term uptrend. First, Chubb (CB) hit...
READ MORE
MEMBERS ONLY
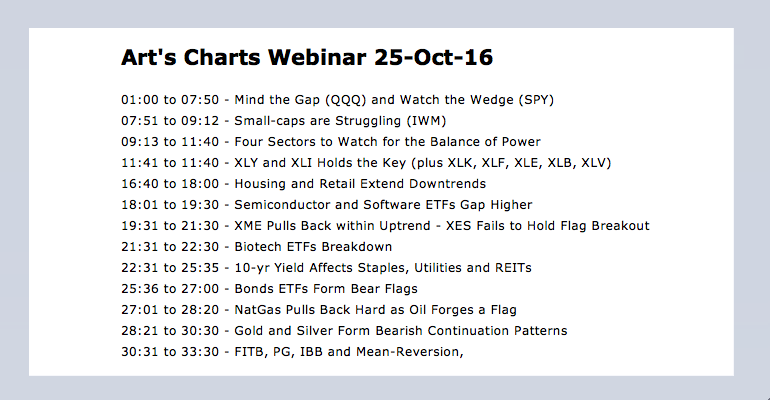
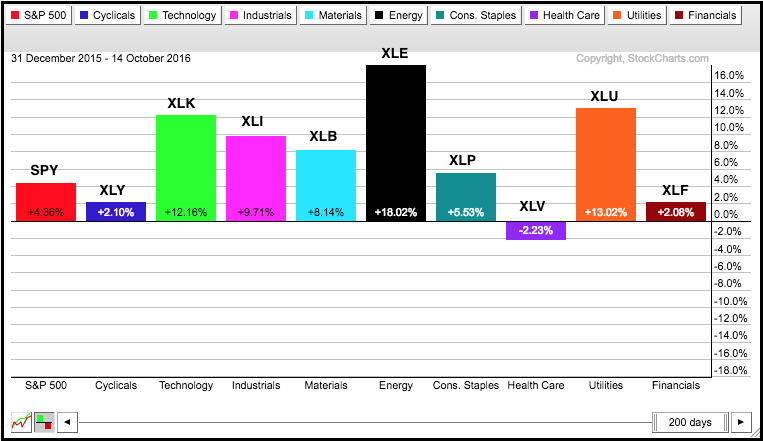
Balance of Power for the 9 Sectors - XLI and XLY Hold the Key - GLD Forms Bear Wedge - Rates Weight on Staples and REITs - Video
by Arthur Hill,
Chief Technical Strategist, TrendInvestorPro.com
Webinar Video Link .... Art's Charts ChartList Link .... Weighing the Balance of Power for the Market Sectors .... XLY Surges off 200-day EMA .... XLI Could Tilt the Balance of Power .... Falling Wedges for Retail and Housing ETFs .... Software iShares Nears New High .... Staples, Utilities and REITs Tests their 200-day EMAs...
READ MORE
MEMBERS ONLY
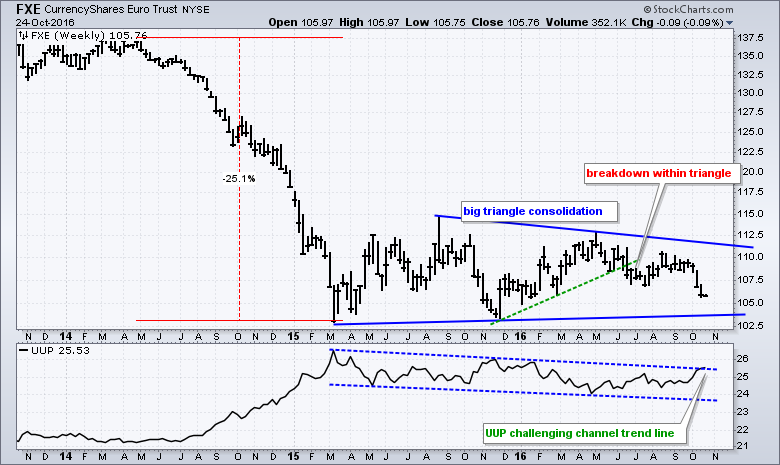
Euro ETF Forms Massive Consolidation within Downtrend
by Arthur Hill,
Chief Technical Strategist, TrendInvestorPro.com
The Euro ETF (FXE) formed a large triangle after a sharp decline and this pattern could be just a big rest within a bigger downtrend. After falling some 25% in one year, FXE found support in March 2015 and moved sideways the last 20 months. This sideways pattern looks like...
READ MORE
MEMBERS ONLY
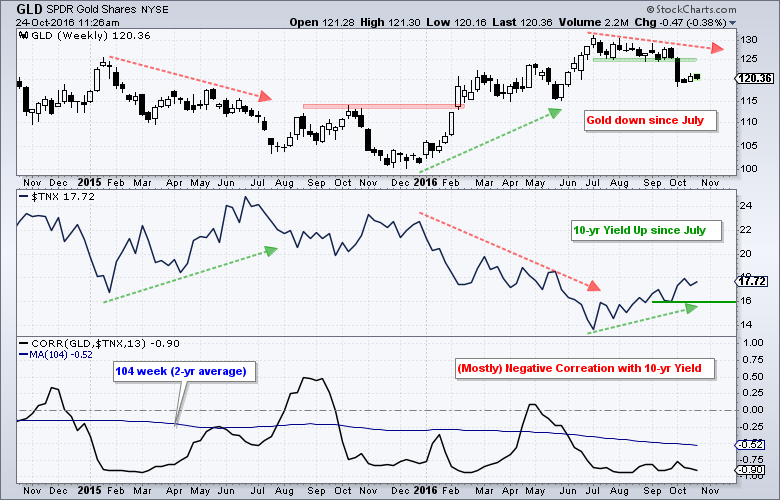
Treasury Yields Continue to Drive Gold Prices
by Arthur Hill,
Chief Technical Strategist, TrendInvestorPro.com
Investors looking to time gold should pay close attention to the 10-yr Treasury yield because these two show a strong negative correlation over the last two years. This means they move in opposite directions. The chart below shows the Gold SPDR (GLD), the 10-yr T-Yield ($TNX) and the 13-week Correlation...
READ MORE
MEMBERS ONLY
Nowhere is Not Necessarily Bearish - Five Key Risk Ratios - Mean-Reversion Breadth Indicator - SPY Holds Bounce
by Arthur Hill,
Chief Technical Strategist, TrendInvestorPro.com
Nowhere is not Necessarily Bearish .... Consumer Discretionary Shows Relative Strength .... Five Key Risk Ratios Remain Bullish .... Breadth Indicators Soften During Correction .... Mean-reverting with Breadth Indicators .... SPY Holds Mean-Reversion Bounce .... QQQ Continues to Lead .... IWM Tests Big Support Zone .... //// ....
Nowhere is not Necessarily Bearish
The S&P 500 has gone...
READ MORE
MEMBERS ONLY
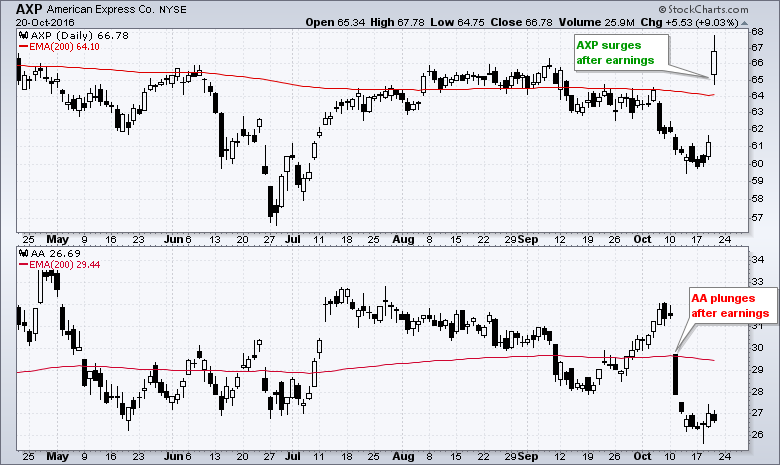
Putting a Number on Earnings Reactions - Scan Code for Big Movers - EEM Consolidates within Trend
by Arthur Hill,
Chief Technical Strategist, TrendInvestorPro.com
Quantifying the Reaction to Earnings .... Scan Code for Big Movers .... Low Volume and JETS .... Apple Dwarfs the Entire Airline Group .... Using PerfCharts to Compare Airlines Performance .... Using RRGs to Measure Relative Performance for Airlines .... Emerging Markets Continue to Outperform .... //// ....
Quantifying the Reaction to Earnings
I was trying to get an...
READ MORE
MEMBERS ONLY
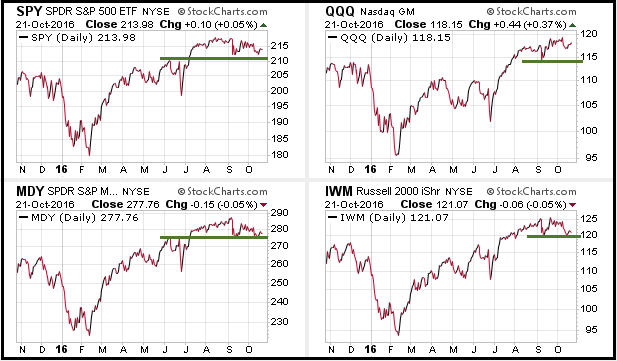
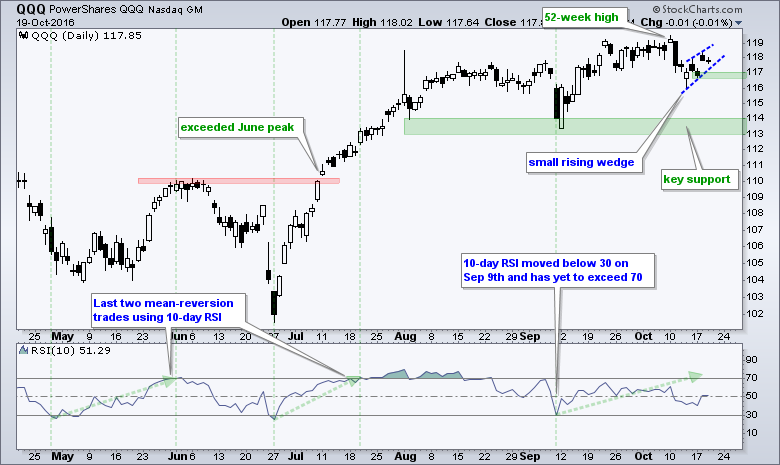
Watching the Wedges in SPY and QQQ - Finance and Tech Power IWM - Steel Powers XME - Airline ETFs Gets Two Breakouts
by Arthur Hill,
Chief Technical Strategist, TrendInvestorPro.com
QQQ Leads the Big 3 .... SPY Forms Small Wedge .... Finance and Tech Power IWM .... Changing to Vanguard Finance ETF .... Groups Going Off the Radar .... Still Watching Retail and Housing .... Steel Stocks Propel Metals & Mining SPDR .... Airline ETF Gets Two Breakouts .... //// ....
QQQ Leads the Big 3
QQQ continues to lead...
READ MORE
MEMBERS ONLY
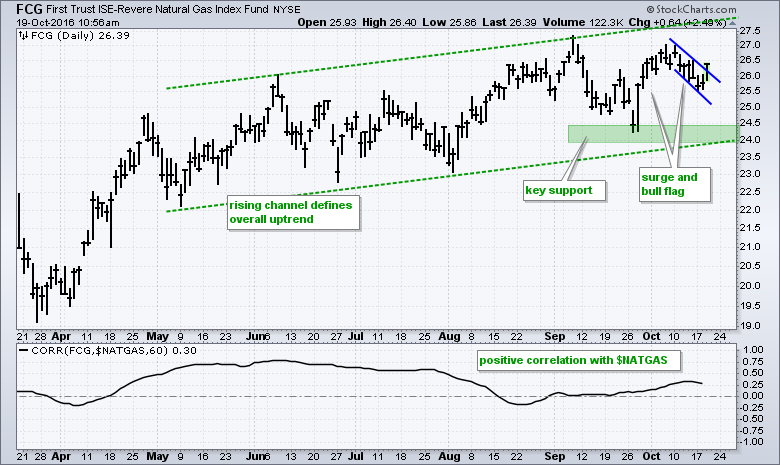
Natural Gas ETF Breaks out of Continuation Pattern
by Arthur Hill,
Chief Technical Strategist, TrendInvestorPro.com
The FirstTrust Natural Gas ETF (FCG) has been one of the top performing ETFs this year with a year-to-date gain of around 18%. As the chart below shows, the overall trend is clearly up and the ETF is forming a small bullish continuation pattern. First, a rising channel defines the...
READ MORE
MEMBERS ONLY
Nine Sectors Can be Broken Down into Three Performance Groups - NatGas Leads Oil - Webinar Video
by Arthur Hill,
Chief Technical Strategist, TrendInvestorPro.com
Three Sector Breaks Remain in Play .... The Three Big Laggards - XLV XLP XLU .... Tech, Finance and Energy Continue to Lead .... RRG Reflects Current Sector Rotations .... NatGas Continues to Lead Oil .... Webinar Video .... //// ....
Click here for the webinar video.
The nine sector SPDRs can be divided into three groups right...
READ MORE
MEMBERS ONLY
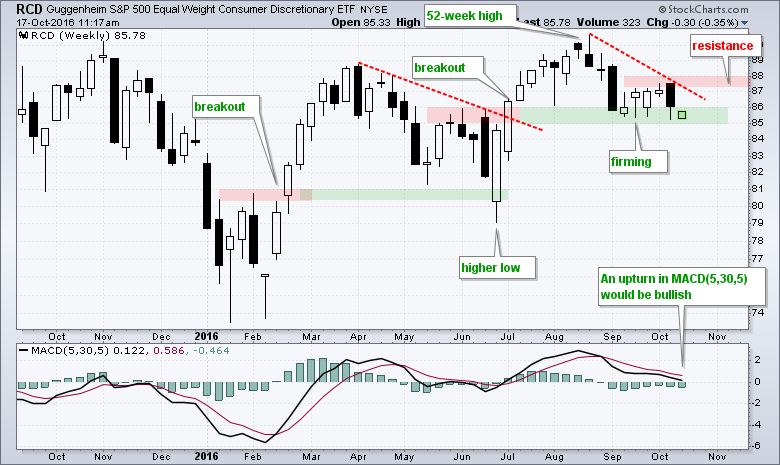
Can the Consumer Discretionary Sector Turn it Around in Q4?
by Arthur Hill,
Chief Technical Strategist, TrendInvestorPro.com
The consumer discretionary sector is one of the weakest performing sectors over the last six months, but the overall chart looks constructive and I am watching the October highs for a breakout. Note that I am analyzing the Equal-weight Consumer Discretionary ETF (RCD) because it tells us how the "...
READ MORE
MEMBERS ONLY
SPY Holds Triangle Break - Testing Mean-Reversion with IWM and QQQ - Sector Trend and Breadth Table Update
by Arthur Hill,
Chief Technical Strategist, TrendInvestorPro.com
SPY Holds Triangle Break .... Testing the Mean-Reversion Strategy with IWM and QQQ .... IWM Gaps towards Big Support Zone .... QQQ Remains with Active RSI Signal .... Do Stops Matter? .... Consumer Discretionary Sector Teeters .... Sector Trend and Breadth Table .... //// ....
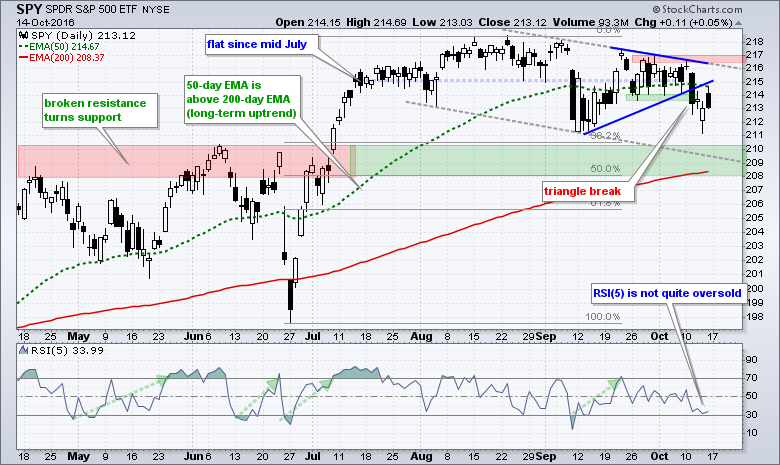
SPY Holds Triangle Break
I covered the major stock indexes and broad market breadth...
READ MORE
MEMBERS ONLY
When Does a Correction Become Something More? - Using Small and Mid Cap Breadth to Foreshadow Broad Market Shifts
by Arthur Hill,
Chief Technical Strategist, TrendInvestorPro.com
A Negative Week, but a Positive Year .... Broader Market is Seriously Mixed .... S&P 500 Stalls above its Breakout Zone .... Small-caps and Mid-caps Sport Corrective Patterns .... Breadth Indicators Can Foreshadow Significant Changes .... Large-cap Breadth Remains Bullish .... Weight of the Evidence Table.... //// ....
A Negative Week, but a Positive Year
It...
READ MORE
MEMBERS ONLY
Broad Market is Seriously Mixed, but Breakouts are Holding
by Arthur Hill,
Chief Technical Strategist, TrendInvestorPro.com
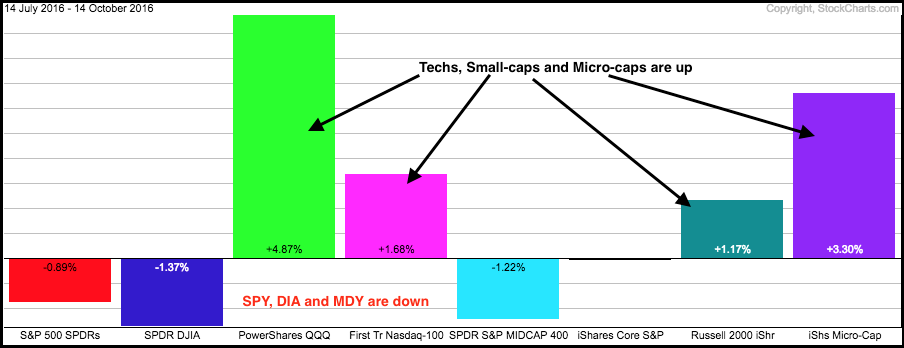
The broader market is incredibly mixed over the last three months. Even though performance divergences reflect a divided market, the major index ETFs are holding above their June highs and I view this as a correction within an uptrend. The PerfChart below shows eight major index ETFs with four up...
READ MORE
MEMBERS ONLY
Using Breadth For Trading Bias and Overbought/Oversold Setups - A Mean-Reversion System for SPY
by Arthur Hill,
Chief Technical Strategist, TrendInvestorPro.com
Using Breadth to Determine a Long-term Bias .... Short-term Breadth Indicators Become Oversold .... The 800-pound Gorilla in the Room .... Six of Nine Sectors Remain with Long-term Bullish Signals .... Revisiting the RSI Mean-Reversion System for SPY .... SPY Breaks Triangle Trend Line .... Further Study .... //// ....
Using Breadth to Determine a Long-term Bias
My long-term...
READ MORE
MEMBERS ONLY
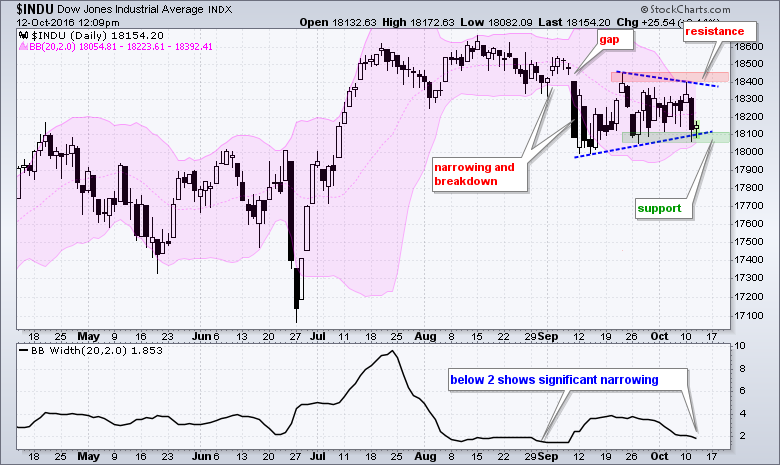
Bollinger Bands Narrow as Dow Gears Up for a Move
by Arthur Hill,
Chief Technical Strategist, TrendInvestorPro.com
The Dow Industrials remains locked in a trading range since the 11-Sept breakdown and chartists should watch this range for the next directional clue. The chart shows the Bollinger Bands in pink and the indicator window shows BandWidth. A move below 2 shows a significant narrowing of the bands and...
READ MORE
MEMBERS ONLY
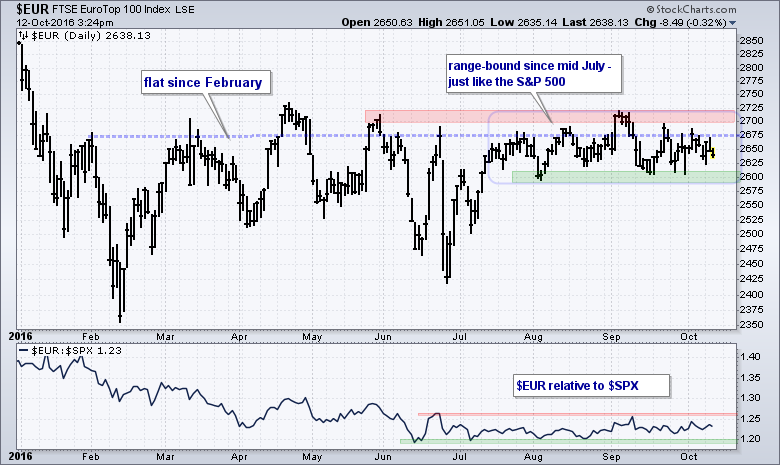
EuroTop 100 Index Remains Stuck as Peripheral Countries Weigh
by Arthur Hill,
Chief Technical Strategist, TrendInvestorPro.com
As with the S&P 500, the Eurotop 100 ($EUR) has gone nowhere since mid July and I am focused on the recent range for the first directional clues. Trading is quite choppy within the range and it remains anyone's guess what will happen within this range....
READ MORE