MEMBERS ONLY
Bitcoin Sets Up with Classic Continuation Signal
by Arthur Hill,
Chief Technical Strategist, TrendInvestorPro.com
KEY TAKEAWAYS
* Corrections within bigger uptrends are opportunities.
* Chartists can identify corrections using retracements and patterns.
* The pattern provides a clear resistance level to watch for a breakout.
There is a certain ebb and flow in uptrends. Often we see some sort of stair step higher with big advances and...
READ MORE
MEMBERS ONLY
Six Leaders, but One Is Getting Real Frothy
by Arthur Hill,
Chief Technical Strategist, TrendInvestorPro.com
KEY TAKEAWAYS
* Chartists can measure performance by comparing highs and lows
* Defense groups are leading SPY because they hit new highs already.
* XLU is looking frothy because it is over 13% above its 200-day SMA.
After sharp declines into mid April, stocks rebounded over the last three weeks and the...
READ MORE
MEMBERS ONLY
Is this a Dead-Cat Bounce or a Bounce with Legs?
by Arthur Hill,
Chief Technical Strategist, TrendInvestorPro.com
KEY TAKEAWAYS
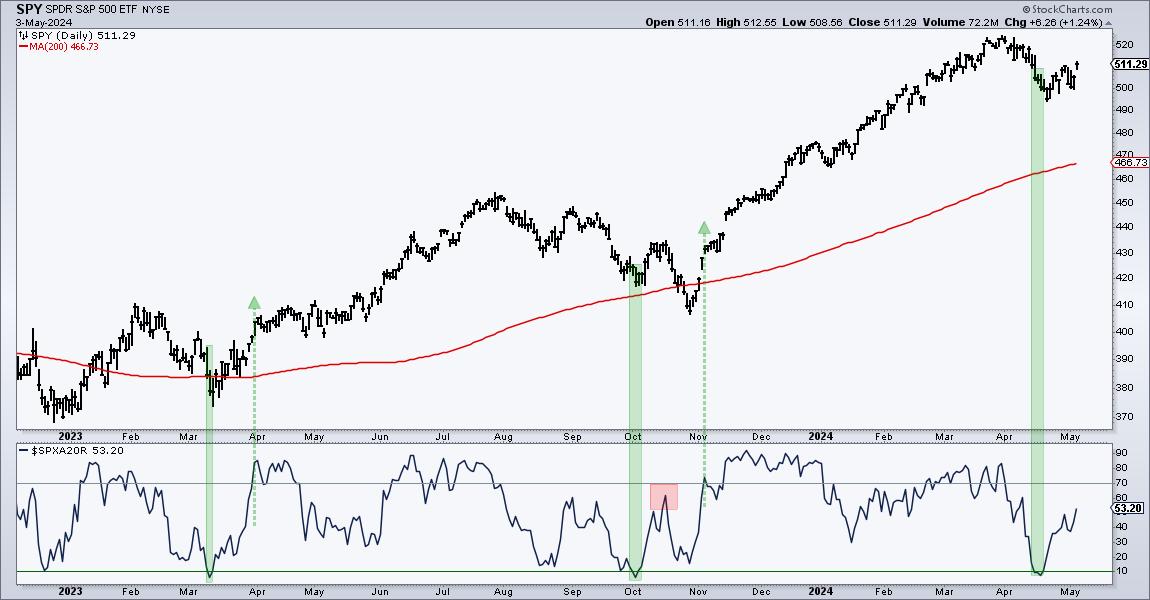
* A key short-term breadth indicator became oversold in mid April.
* Stocks are bouncing after this oversold reading.
* Breadth, however, has yet to show a serious expansion in participation.
Stocks fell sharply into late April and then rebounded over the last two weeks. SPY fell 5.34% from March...
READ MORE
MEMBERS ONLY
Getting Perspective and Dealing with Volatility
by Arthur Hill,
Chief Technical Strategist, TrendInvestorPro.com
KEY TAKEAWAYS
* Primary moves define the long-term trend
* Secondary moves are corrections within bigger uptrends
* Corrections provide opportunities to partake in the bigger uptrend
The S&P 500 is down 5.5% this month and volatility is rearing its ugly head. This is a good time to get some...
READ MORE
MEMBERS ONLY
Using Outsized Moves to Identify Trend Reversals - Checking in on Housing and Semis
by Arthur Hill,
Chief Technical Strategist, TrendInvestorPro.com
KEY TAKEAWAYS
* Outsized Moves Can Jump Start Trends
* Chartists can use ATR-SAR to Identify Outsized Moves
* Housing and Retail are Leading Lower with Outsized Declines
Trends often start with outsized moves. But how do we measure and identify such moves? Chartists can measure moves in Average True Range (ATR) terms...
READ MORE
MEMBERS ONLY
Overbought Conditions Reflect Strength and Said Strength Drives Momentum Rotation Strategies
by Arthur Hill,
Chief Technical Strategist, TrendInvestorPro.com
KEY TAKEAWAYS
* Overbought is just another term for strong. RSI above 70 shows strong upside momentum, which his bullish. Stocks can become overbought (strong) and remain strong.
Momentum and trend strategies are off to a roaring start here in 2024. More often than not, these strategies buy leading stocks that...
READ MORE
MEMBERS ONLY
An Indicator to Define the Trend and Quantify Momentum
by Arthur Hill,
Chief Technical Strategist, TrendInvestorPro.com
The 200-day SMA is perhaps the most widely used long-term moving average. As its name implies, it is a simple indicator that chartists can use for trend-following and momentum strategies. For trend-following, we just need to know where prices stand relative to the 200-day SMA. For momentum, we need to...
READ MORE
MEMBERS ONLY
Rates Look Set to Rise as TLT Resumes its Downtrend
by Arthur Hill,
Chief Technical Strategist, TrendInvestorPro.com
The 20+ Yr Treasury Bond ETF (TLT) failed again at the falling 40-week SMA and looks poised to resume its bigger downtrend. Keep in mind that bonds and yields move in the opposite direction. A resumption of the downtrend in TLT translates into a resumption of the uptrend in the...
READ MORE
MEMBERS ONLY
Oil & Gas Equipment & Services ETF Resumes its Uptrend
by Arthur Hill,
Chief Technical Strategist, TrendInvestorPro.com
The Oil & Gas Equipment & Services ETF (XES) is showing strength here in March as it breaks back above its 40-week SMA. More importantly, the long-term trend is up and this week's breakout argues for a continuation of this uptrend.
The chart below shows XES with a...
READ MORE
MEMBERS ONLY
Using the ATR Trailing Stop to Manage the Trade and Define the Trend
by Arthur Hill,
Chief Technical Strategist, TrendInvestorPro.com
As its name suggests, the ATR Trailing Stop is normally used to trail a stop-loss for a long position. It can also be used to identify an outsized decline that could reverse an uptrend. Today's example will show how to apply the ATR Trailing Stop on a breakout...
READ MORE
MEMBERS ONLY
Spotting Tradable Pullbacks after Trend Reversing Surges
by Arthur Hill,
Chief Technical Strategist, TrendInvestorPro.com
Most stocks surged with the broader market in the fourth quarter of 2023. SPY and QQQ extended their advances in 2024, but some stocks did not partake and fell back. Even so, some of these stocks show signs of long-term trend reversals and their declines in 2024 look corrective. This...
READ MORE
MEMBERS ONLY
Finding Leaders and Bullish Signals on the Price Chart
by Arthur Hill,
Chief Technical Strategist, TrendInvestorPro.com
Chartists can improve their odds by focusing on stocks that are in long-term uptrends and showing upside leadership. This is similar to a dual-momentum approach, which was covered last week. Today's example will use the 40-week SMA to define the trend, a 52-week high to confirm upside leadership...
READ MORE
MEMBERS ONLY
Capturing the Momentum Phenomenon - Nvidia vs Tesla
by Arthur Hill,
Chief Technical Strategist, TrendInvestorPro.com
The momentum phenomenon has been a fixture in the US equity markets for decades. There are two types of momentum to consider: absolute momentum and relative momentum. Absolute momentum refers to the underlying trend, up or down. Relative momentum quantifies the strength of the uptrend and compares it to other...
READ MORE
MEMBERS ONLY
Generals March On, but Fewer Troops are Following - Get the Essential Breadth Indicator ChartList
by Arthur Hill,
Chief Technical Strategist, TrendInvestorPro.com
Divergences reflect a disconnect between price and the indicator. A bearish divergence forms when price forges a higher high and the indicator fails to confirm this high. In the case presented below, we have the S&P 500 moving higher and fewer stocks making it back above their 50...
READ MORE
MEMBERS ONLY
Gold is Making Waves within a Long-Term Uptrend
by Arthur Hill,
Chief Technical Strategist, TrendInvestorPro.com
Gold is not the most exciting asset at the moment, but it is in a long-term uptrend and perhaps the strongest commodity out there. There are also signs that the January decline is ending as RSI hits a momentum support zone and a bullish continuation pattern forms. Note that GLD...
READ MORE
MEMBERS ONLY
A Biotech Stock with a Breakout on the Weekly and a Classic Retracement on the Daily
by Arthur Hill,
Chief Technical Strategist, TrendInvestorPro.com
This week's analysis will stick with the multiple timeframe approach. Today we are featuring a biotech stock with a channel breakout on the weekly chart and a classic retracement on the daily chart. Moreover, a larger bullish reversal pattern could be forming on the daily chart.
The weekly...
READ MORE
MEMBERS ONLY
Using Two Timeframes to Increase the Odds - Starting with the Strategic View
by Arthur Hill,
Chief Technical Strategist, TrendInvestorPro.com
Chartists looking to increase their odds should consider two timeframes for their analysis. The longer timeframe sets the strategic tone, while the shorter timeframe defines the trading tactics. Strategically, I am interested in stocks with long-term uptrends. Tactically, I am looking for bullish continuation patterns to trade after a correction....
READ MORE
MEMBERS ONLY
Putting a Mean-Reversion Strategy Into Practice
by Arthur Hill,
Chief Technical Strategist, TrendInvestorPro.com
Mean-reversion strategies typically buy stocks when they are oversold, which means catching the falling knife. These declines are often rather sharp, but the odds favor some sort of bounce after reaching an oversold extreme. While there are no guarantees, chartists can mitigate risk by insuring that the stock is still...
READ MORE
MEMBERS ONLY
Apple hits Support-Reversal Zone - What is it and Why Does it Matter?
by Arthur Hill,
Chief Technical Strategist, TrendInvestorPro.com
Tech stocks were hit with selling pressure to start the year, but many are still in long-term trends and some are nearing support-reversal zones. In particular, Apple (AAPL) fell to a support-reversal zone and I am on alert for a bounce. Let's investigate.
First, the long-term trend is...
READ MORE
MEMBERS ONLY
Momentum Madness and Nasdaq 100 Stocks
by Arthur Hill,
Chief Technical Strategist, TrendInvestorPro.com
Stocks went on a tear the last seven weeks with Nasdaq 100 stocks leading the charge. The S&P MidCap 400 SPDR (MDY) and Russell 2000 ETF (IWM) gained more than QQQ over the last seven weeks, but QQQ is still the only major index ETF to exceed its...
READ MORE
MEMBERS ONLY
Is Overbought Really Bearish?
by Arthur Hill,
Chief Technical Strategist, TrendInvestorPro.com
The S&P 500 SPDR (SPY) surged over 10% since late October and exceeded the upper Bollinger Band (125,1). This means price is more than 1 standard deviation above the 125-day SMA. Surely, this means SPY is overbought. But is this actually bearish? Historical evidence suggests that this...
READ MORE
MEMBERS ONLY
Long-term Breadth Indicators Hit Moment of Truth
by Arthur Hill,
Chief Technical Strategist, TrendInvestorPro.com
The percentage of stocks in long-term uptrends rebounded sharply in November and returned to the highs from late August and early September. This rebound is impressive, but the absolute levels are still not that inspiring. We need to see participation breakouts and higher participation levels to get the broad bull...
READ MORE
MEMBERS ONLY
Charting the S&P 1500 Zweig Breadth Thrust - And More...
by Arthur Hill,
Chief Technical Strategist, TrendInvestorPro.com
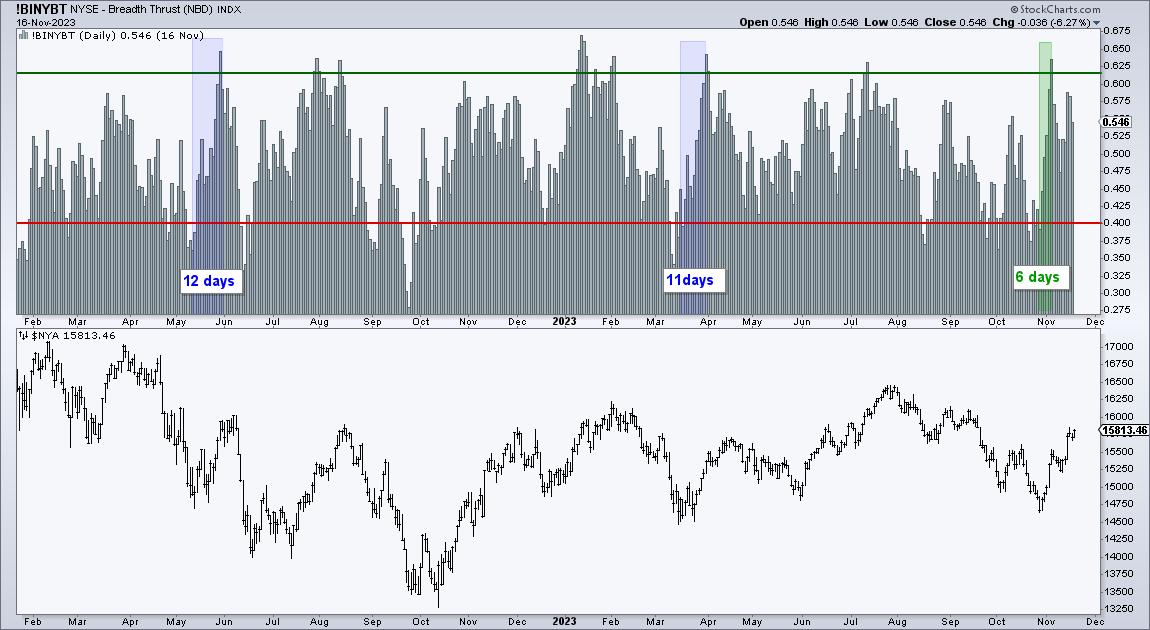
StockCharts users can chart the Zweig Breadth Thrust for the S&P 1500 or any other index that has Advance-Decline Percent data. All we have to do its convert the Zweig Breadth Thrust levels to their equivalents using Advance-Decline Percent.
The Zweig Breadth Thrust is based on percent advances...
READ MORE
MEMBERS ONLY
The Zweig Breadth Thrust Triggers, but the Indicator is Missing Something
by Arthur Hill,
Chief Technical Strategist, TrendInvestorPro.com
Today's report features the Zweig Breadth Thrust, which was developed by the late, and great, Marty Zweig. Zweig appeared regularly on Wall Street Week, contributed to Barrons, published The Zweig Forecast and wrote Winning on Wall Street in 1986. Among other things, his timeless book shows us how...
READ MORE
MEMBERS ONLY
Skip the Noise and Focus on the Signal by Effectively Using the 200-day SMA
by Arthur Hill,
Chief Technical Strategist, TrendInvestorPro.com
The S&P 500 is battling the 200-day SMA with four crosses over the last eleven days. We are also seeing a rise in volatility as this market benchmark plunged 5.86% in nine days (18-27 October) and then surged 5.85% the last five days. With such conditions,...
READ MORE
MEMBERS ONLY
Looking Outside the Stock Market for Opportunities
by Arthur Hill,
Chief Technical Strategist, TrendInvestorPro.com
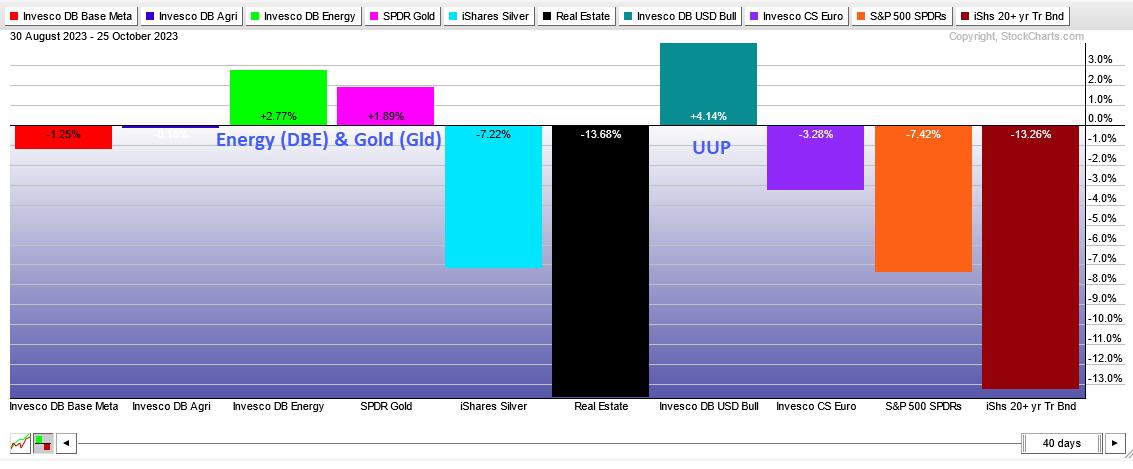
Correlations rise during bear markets. This means more stocks participate in broad market declines than broad market advances. In other words, the odds are stacked against us when picking stocks in bear markets. Traders are better off looking outside of the stock market for opportunities.
The Perfchart below shows the...
READ MORE
MEMBERS ONLY
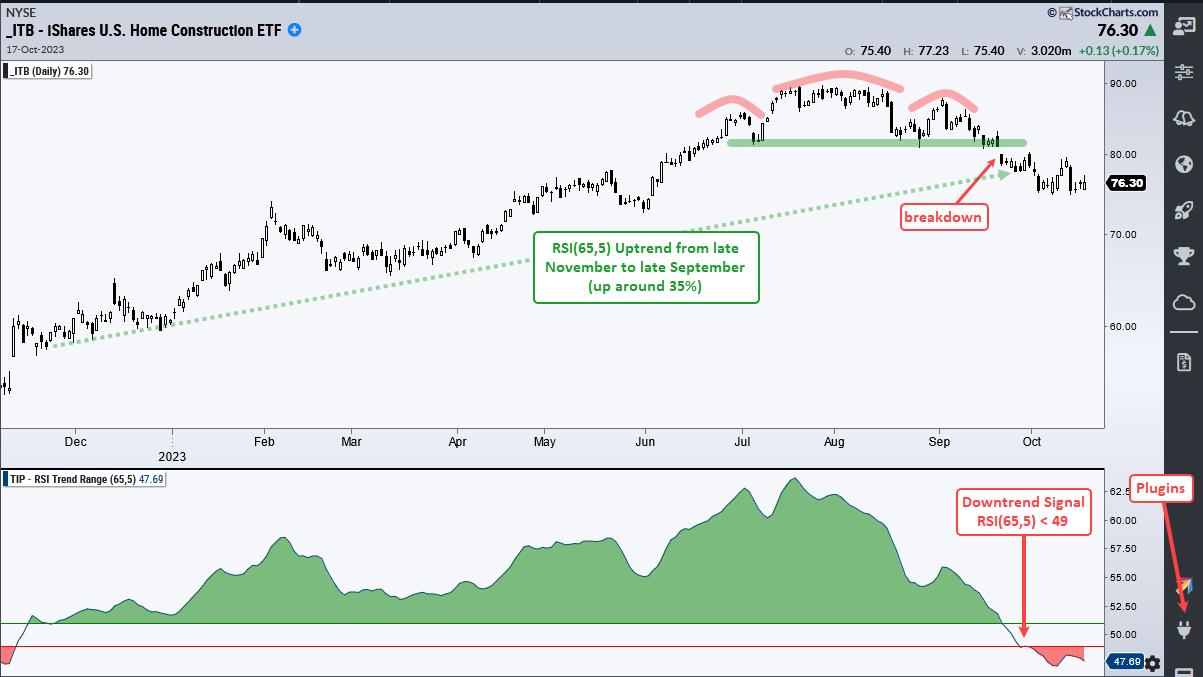
Home Construction ETF Breaks and a Home Builder Sets up for Further Downside
by Arthur Hill,
Chief Technical Strategist, TrendInvestorPro.com
The Home Construction ETF (ITB) led the market the first seven months of the year, but fell on hard times the last two months and reversed its long-term uptrend. Today's report/video will look at the trend reversal in ITB using the RSI Trend Range indicator. We will...
READ MORE
MEMBERS ONLY
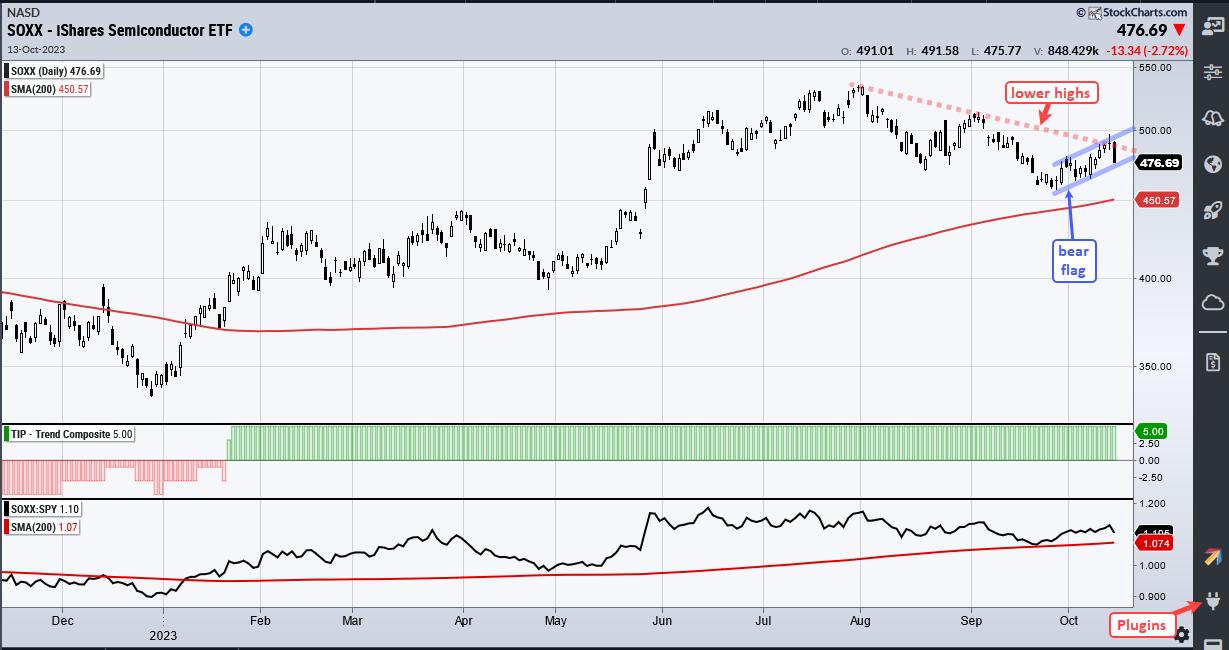
Equal-weight Semis Break Down - Is SOXX Next? - with video (Free)
by Arthur Hill,
Chief Technical Strategist, TrendInvestorPro.com
Today's report will compare charts and performance for the Semiconductor ETF (SOXX) and the Semiconductor SPDR (XSD). SOXX represents large-caps and is holding up. XSD represents the average semiconductor stock and it is not holding up. Broad weakness within the semiconductor group is likely to spread to large-cap...
READ MORE
MEMBERS ONLY
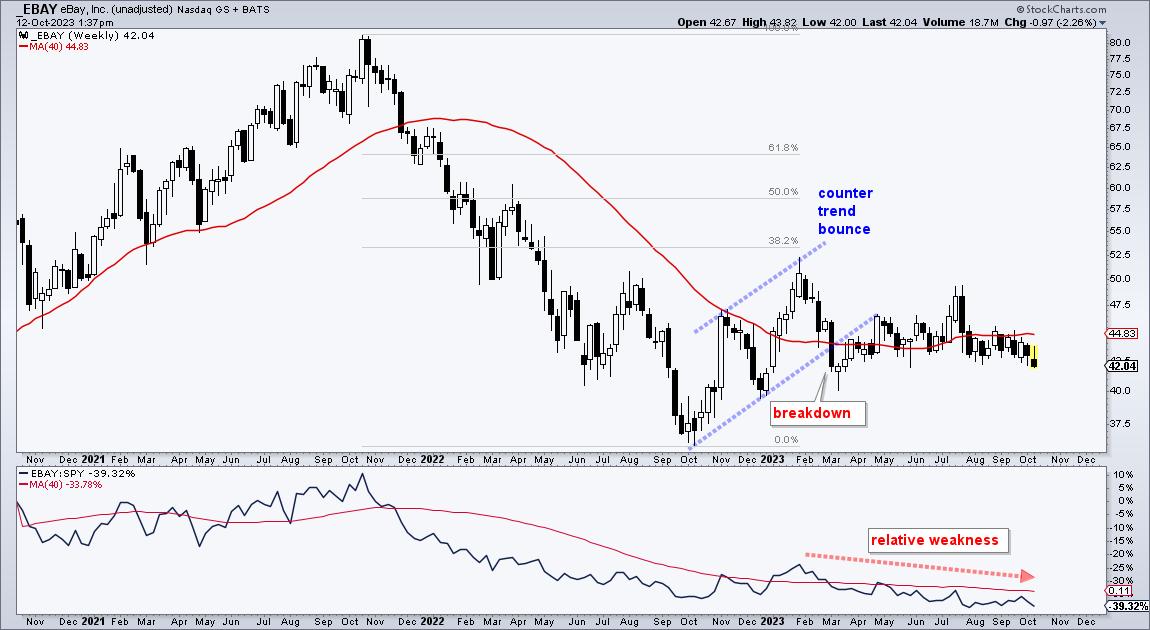
EBAY Cannot Hold a Bid
by Arthur Hill,
Chief Technical Strategist, TrendInvestorPro.com
Despite a rough ride in September, the S&P 500 is still up 14% year-to-date and the Nasdaq 100 is up a whopping 40%. The gains here, however, do not tell the entire story because many stocks are struggling in 2023. In fact, around half of the stocks in...
READ MORE
MEMBERS ONLY
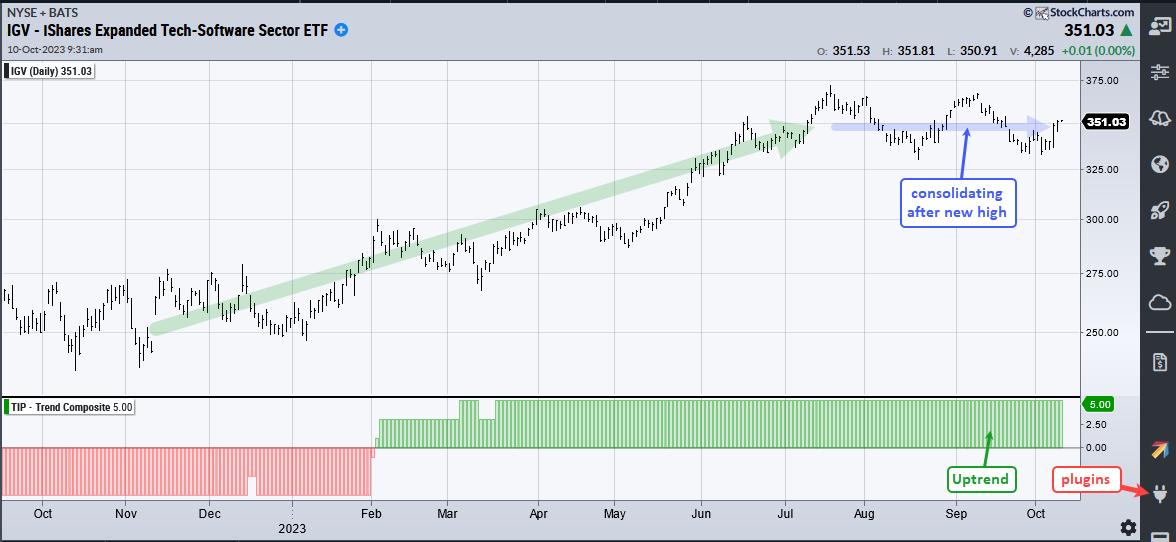
Trading the Swing within the Pattern: IGV Example
by Arthur Hill,
Chief Technical Strategist, TrendInvestorPro.com
Chartists looking to get the jump on a bigger breakout can turn to the swings within a developing pattern. For example, a Symmetrical Triangle after an advance is a bullish continuation pattern. We can get the jump on a breakout by trading a downswing reversal within the pattern. Let'...
READ MORE
MEMBERS ONLY
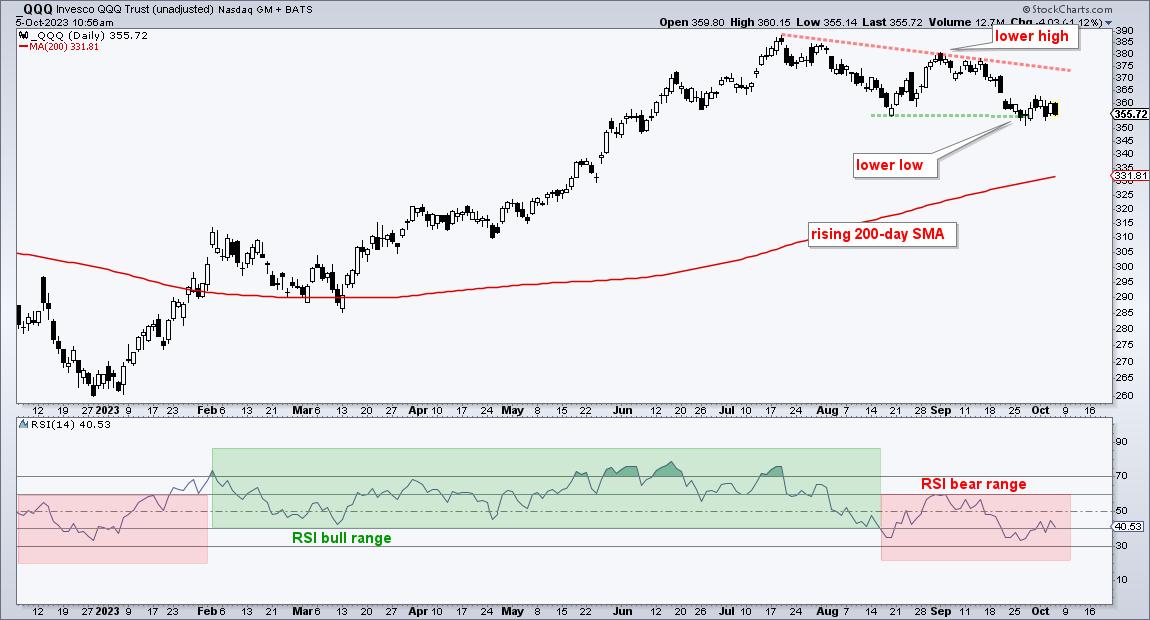
A Key Momentum Indicator Shifts from Bullish to Bearish for QQQ
by Arthur Hill,
Chief Technical Strategist, TrendInvestorPro.com
QQQ remains well above the rising 200-day SMA, but clearly shifted from bullish to bearish over the last two months. Today's report/video will show this momentum shift and analyze the short-term continuation pattern taking shape.
The chart below shows QQQ trading well above the rising 200-day SMA....
READ MORE
MEMBERS ONLY
Two Holding Up and Two Breaking Down
by Arthur Hill,
Chief Technical Strategist, TrendInvestorPro.com
The pockets of strength are shrinking as more stocks succumb to selling pressure. The Nasdaq 100 is the strongest of the major indexes, while the Finance sector is one of the weakest sectors. Today's report will highlight two leaders within the Nasdaq 100 and two laggards within the...
READ MORE
MEMBERS ONLY
Which Cyber Security ETF is the Strongest?
by Arthur Hill,
Chief Technical Strategist, TrendInvestorPro.com
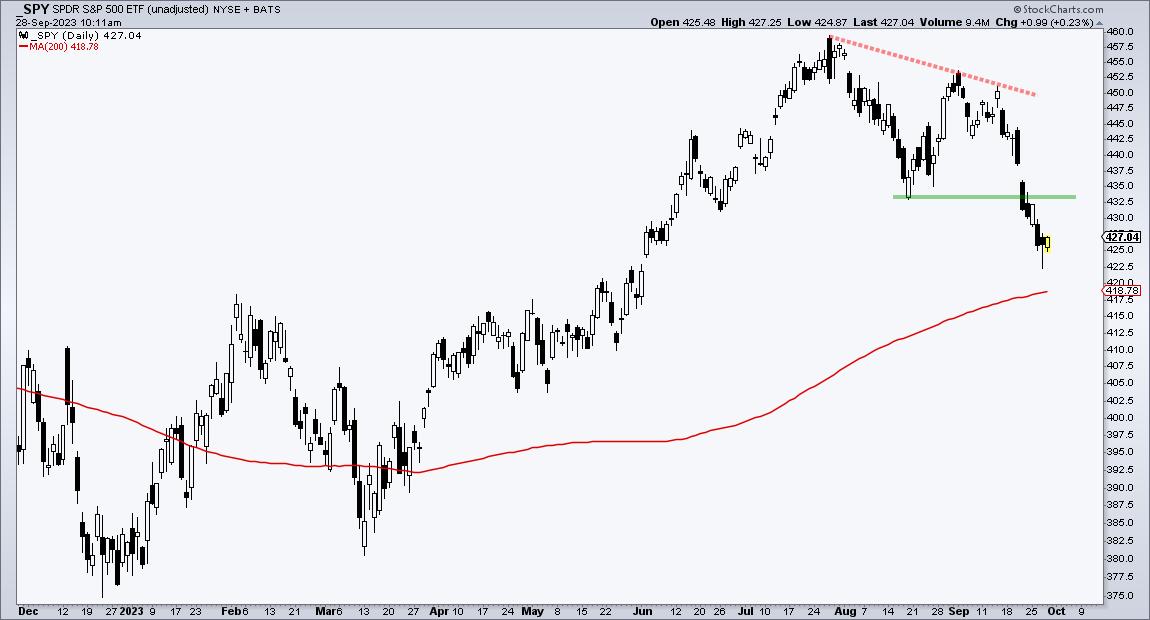
Stocks were hit hard the last two weeks with the S&P 500 SPDR (SPY) breaking below its August low. SPY also forged a lower high from July to August. Stocks and ETFs that held above their August lows are showing relative strength. With that in mind, the three...
READ MORE
MEMBERS ONLY
Finding the Leaders after a Sharp Decline - with Video
by Arthur Hill,
Chief Technical Strategist, TrendInvestorPro.com
Stocks fell sharply in September with the S&P 500 SPDR (SPY) breaking below its August low. Chartists can now use this low as a benchmark low to gauge relative performance. Stocks that held above the August low are showing relative strength. This is valuable information because stocks that...
READ MORE
MEMBERS ONLY
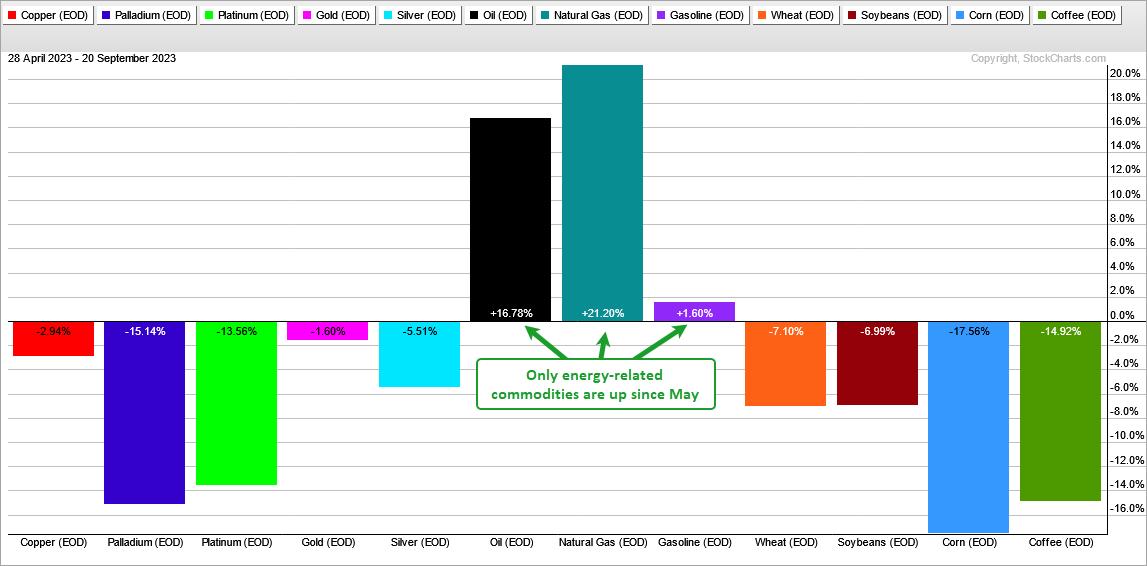
Energy-related Commodities Lead, but Oil Looks Vulnerable
by Arthur Hill,
Chief Technical Strategist, TrendInvestorPro.com
It has been a rough ride for most commodities this year and especially over the last 100 trading days (since May). Of the twelve spot prices I track, nine are up and three are down. Precious metals, base metals, lumber and grains are all down. The energy complex is the...
READ MORE
MEMBERS ONLY
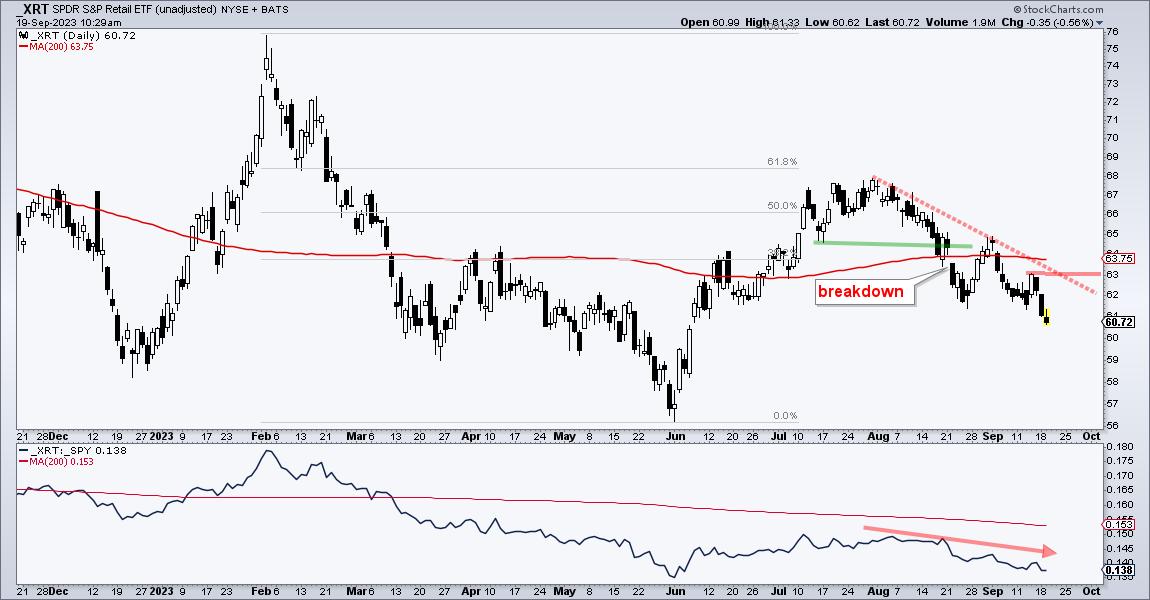
Two Key Groups Take a Turn for the Worse
by Arthur Hill,
Chief Technical Strategist, TrendInvestorPro.com
A few large-caps and large-cap techs are holding up, but other areas of the market are showing weakness. Namely, the Retail SPDR (XRT) and Regional Bank ETF (KRE) are two of the weakest groups right now. These two groups are under selling pressure and this could bode ill for the...
READ MORE
MEMBERS ONLY
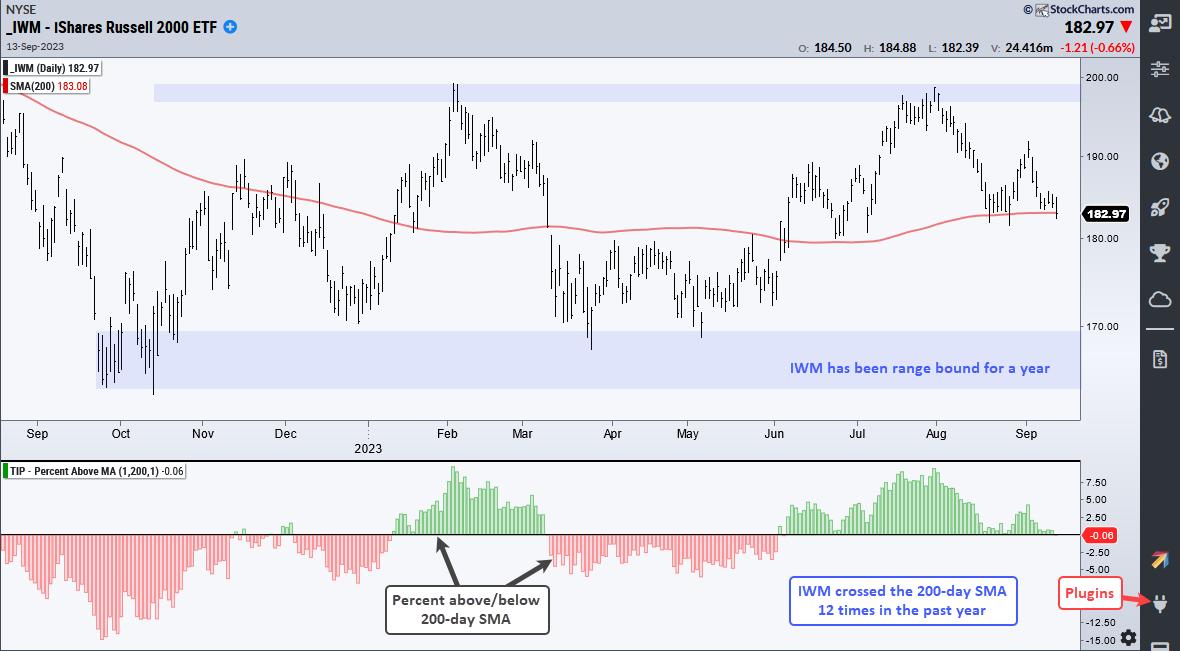
IWM Closes below Long-term Moving Average. Does it Matter?
by Arthur Hill,
Chief Technical Strategist, TrendInvestorPro.com
The Russell 2000 ETF (IWM) closed below the 200-day SMA for the first time since, well, June 1st. The last cross was not that long ago and recent crosses simply resulted in whipsaws. Truth be told, 200-day SMA crosses are not that relevant for IWM.
The chart below shows IWM...
READ MORE
MEMBERS ONLY
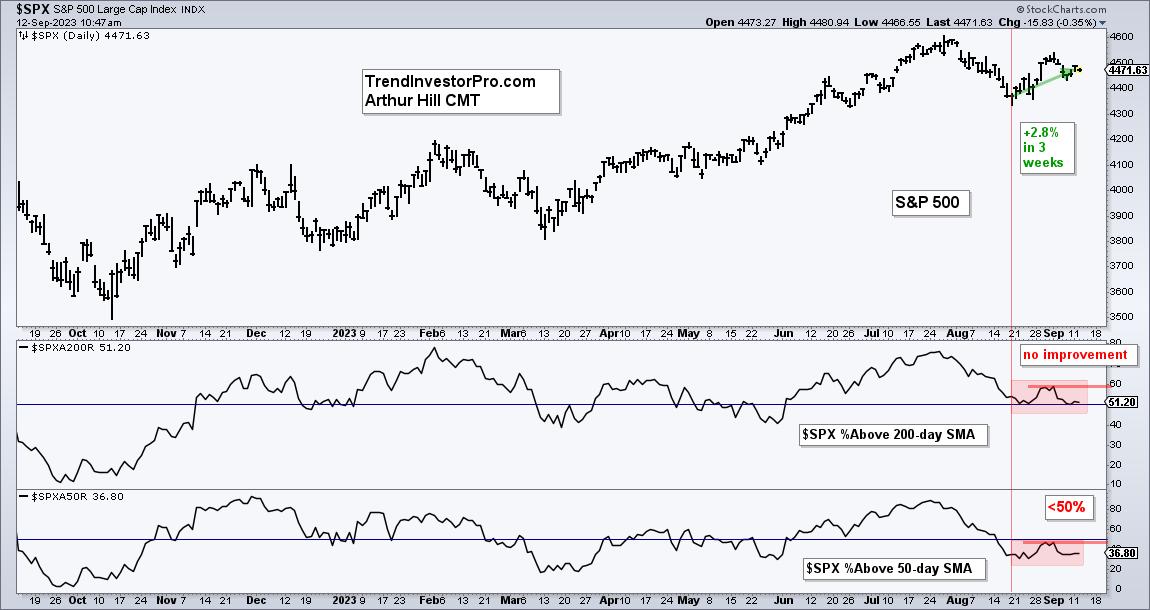
Breadth is Not Keeping Pace with the Bounce
by Arthur Hill,
Chief Technical Strategist, TrendInvestorPro.com
The S&P 500 SPDR bounced the last three weeks, but we did not see an improvement in breadth. Weak breadth is also reflected in performance for mid-caps and small-caps, which are lagging. Even so, SPY and QQQ are in short-term uptrends and I am watching the tech sector...
READ MORE
MEMBERS ONLY
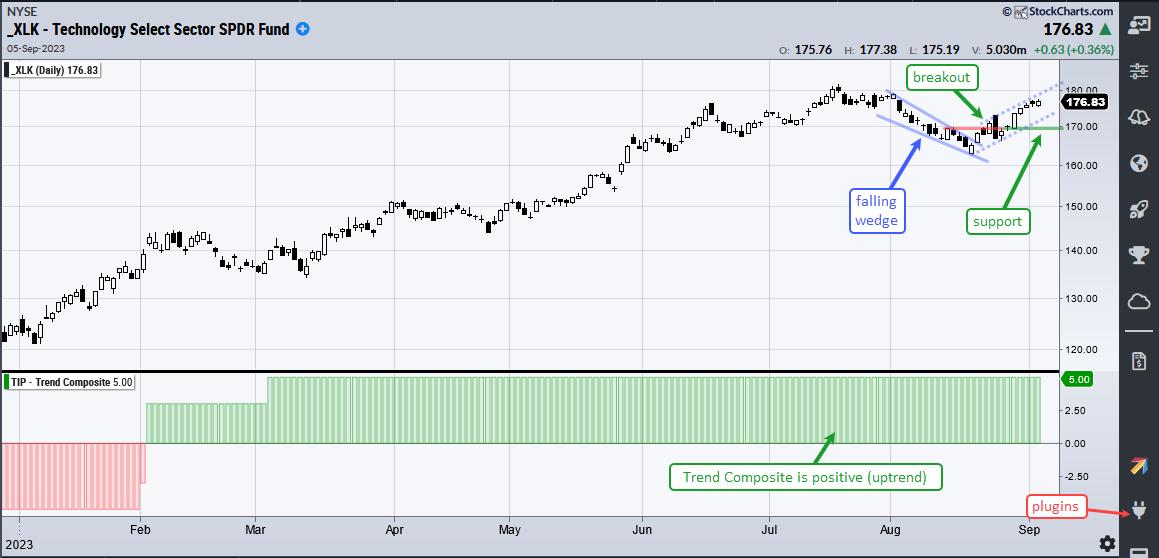
The Key to the August Breakouts
by Arthur Hill,
Chief Technical Strategist, TrendInvestorPro.com
Stocks surged in the second half of August with several ETFs breaking out of corrective patterns, such as falling flags or falling wedges. Even though September is a seasonally weak month, these breakouts are bullish until proven otherwise. Today's commentary will analyze the breakout in the Technology SPDR...
READ MORE
MEMBERS ONLY
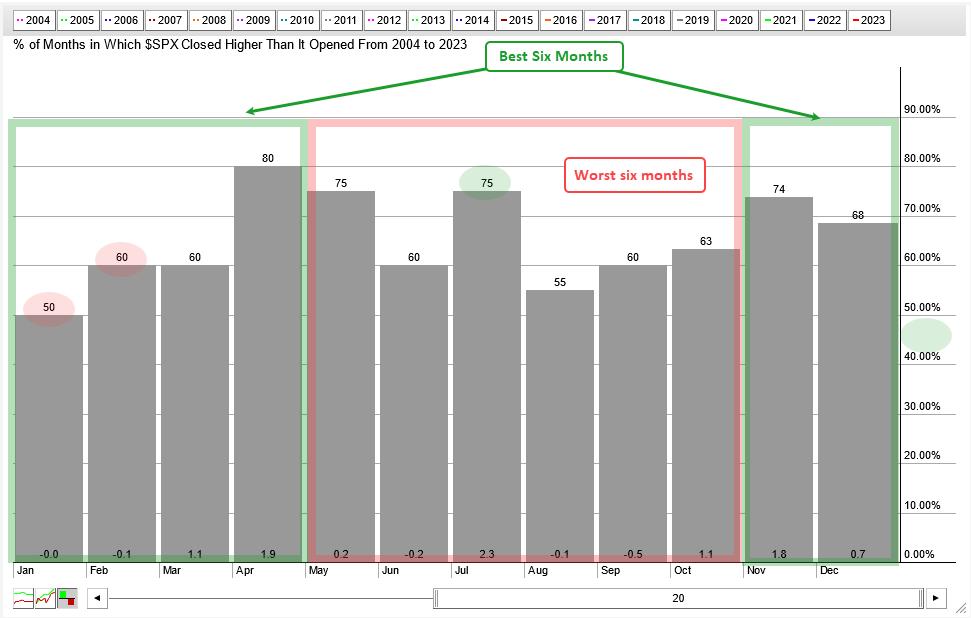
Seasonality versus Simply Market Timing
by Arthur Hill,
Chief Technical Strategist, TrendInvestorPro.com
There is some validity to the best six months strategy, but investors would probably be better off with a simple timing tool. According to the Stock Trader's Almanac, the best six-month period runs from November to April. The worst six-month period runs from May to October. This is...
READ MORE