MEMBERS ONLY
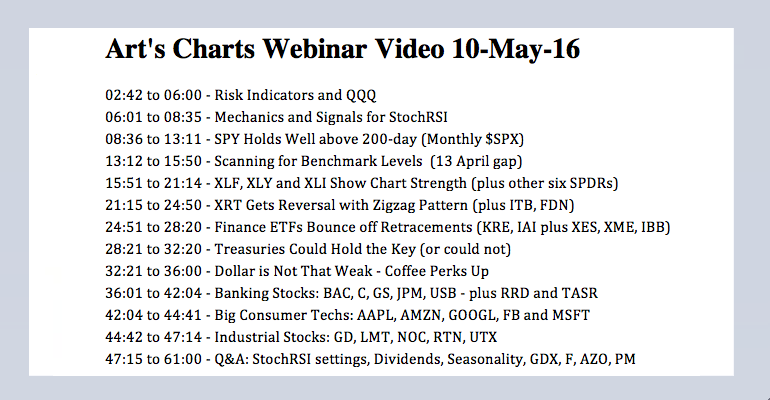
SPY Firms within Flag - Watching the 10-yr Yield for Clues - XLF Shows Chart Strength - Mind the 13-April Gaps - Webinar Video
by Arthur Hill,
Chief Technical Strategist, TrendInvestorPro.com
SPY Firms within Bull Flag // Treasuries Could hold the Key for Stocks // Mind the 13-April Gaps // Banks are Holding Up Well // XRT Reverses within Zigzag Pattern // Internet ETF Grinds Higher // Webinar Preview //// .......
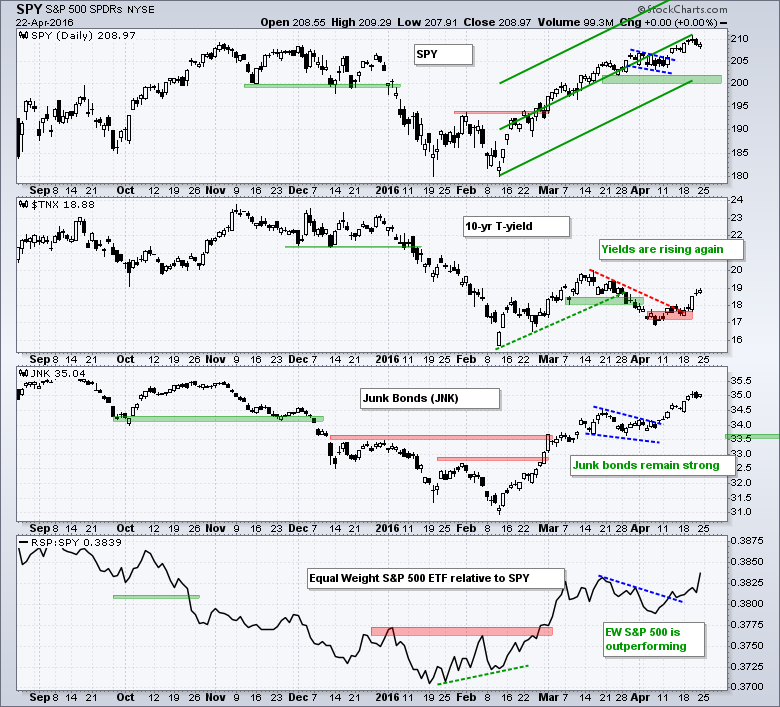
The green Raff Regression Channel defines the overall uptrend in SPY and the red Raff Regression Channel marks...
READ MORE
MEMBERS ONLY
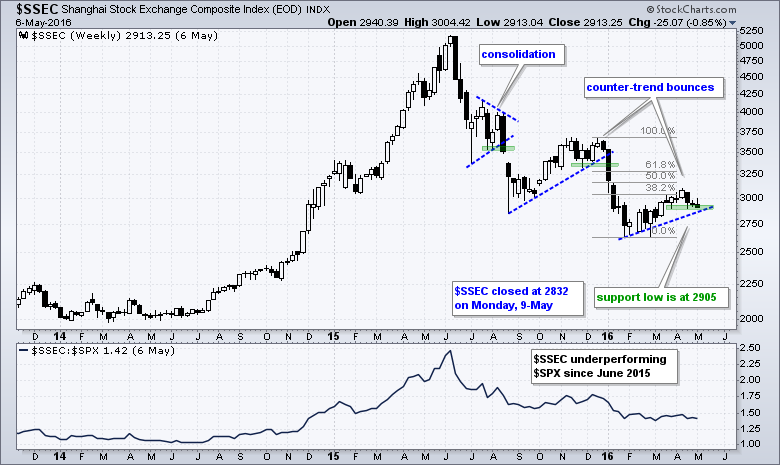
Shanghai Composite Breaks Support after Weak Retracement
by Arthur Hill,
Chief Technical Strategist, TrendInvestorPro.com
The Shanghai Composite ($SSEC) took a hit on Monday and closed below support from the April low. This move is reversing the counter-trend bounce and signaling a continuation of the bigger downtrend. $SSEC is in a big downtrend with lower lows and lower highs since the initial breakdown in June...
READ MORE
MEMBERS ONLY
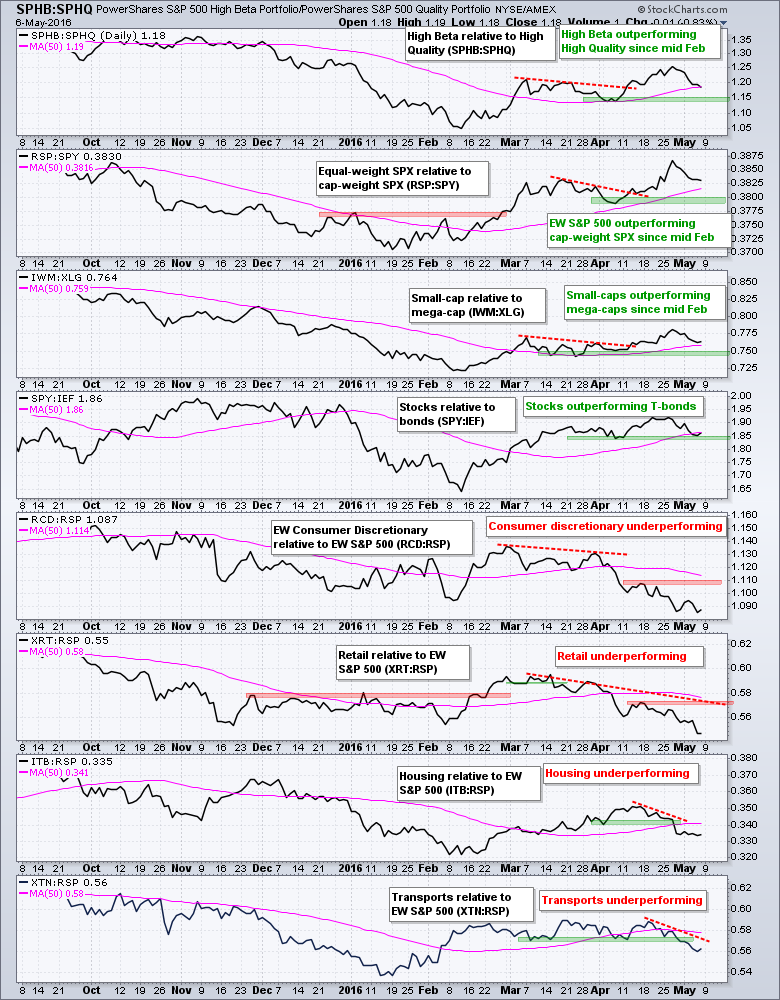
SPX Nears First Support - XLK Hits Key Retracement - 5 Banks Tests April Breakouts
by Arthur Hill,
Chief Technical Strategist, TrendInvestorPro.com
Consumer Discretionary Groups Underperforming // $SPX Pullback Nears first Support Zone // XLK Nears Broken Resistance and Key Retracement // Apple, Alphabet and Microsoft Firm at Support // Five Big Banks Tests their April Breakouts //// .......
I will be showing some group charts to provide analysis for the risk indicators, the broad market indexes, the...
READ MORE
MEMBERS ONLY
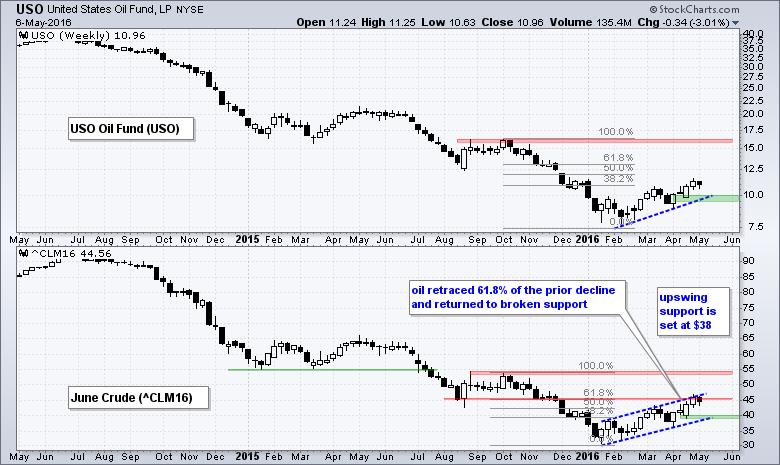
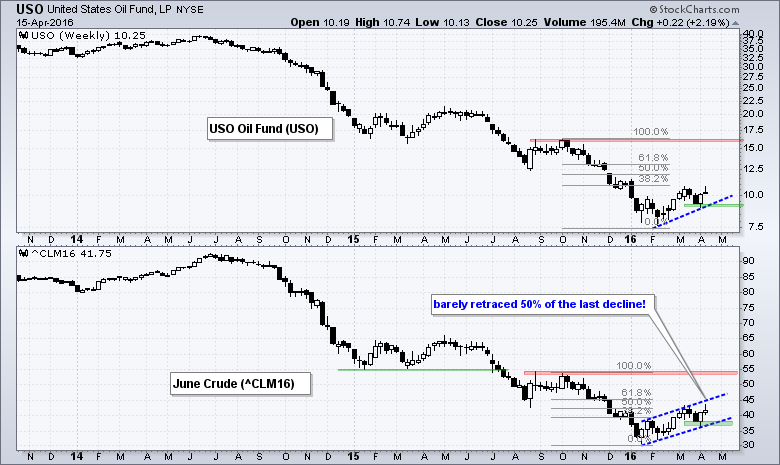
Oil Reaches Moment-of-truth
by Arthur Hill,
Chief Technical Strategist, TrendInvestorPro.com
Oil remains in an uptrend this year, but the bigger trend remains down and this could be just a counter-trend bounce. The price chart shows the USO Oil Fund (USO) in the top window and June Crude (^CLM16) in the bottom window. I am using June Crude for analysis because...
READ MORE
MEMBERS ONLY
Isolating the Key Stock Market Trend - Weighing the Evidence - Ranking the Sectors - Video
by Arthur Hill,
Chief Technical Strategist, TrendInvestorPro.com
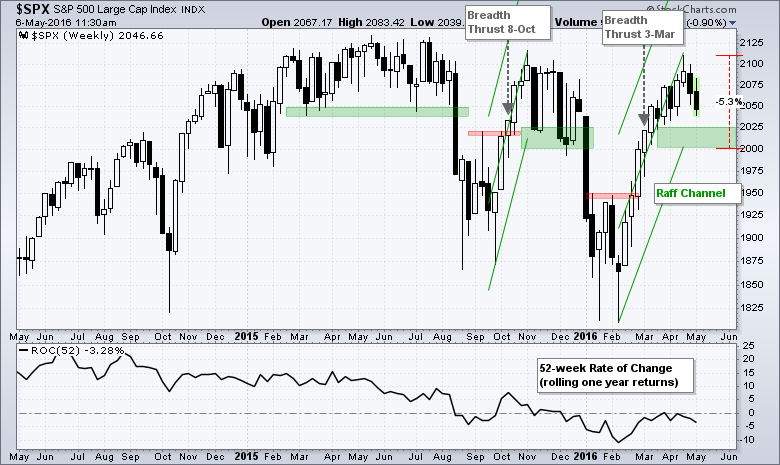
Isolating the Key Trend in the S&P 500 // Breadth Indicators Near Moment-of-truth // New Highs Still Outpacing New Lows // The Weight of the Evidence Is.... // Using Breadth and Price Action for Sectors // Sector Summary and Ranking Table // Friday Food for Thought //// .......
Isolating the Key Trend in the S&...
READ MORE
MEMBERS ONLY
A Mild Correction for SPY - Breaking Down the Drivers in QQQ - MSFT and GOOGL Hit Key Junctures
by Arthur Hill,
Chief Technical Strategist, TrendInvestorPro.com
A Market Entitled to a Correction // Using StochRSI to Time Pops in QQQ // A Mild Correction for SPY // Big Techs and Biotechs Drive QQQ Lower // Breaking Down the Big Five - FAAAM // Apple is the Weakest of the Big Five, but.... // Microsoft and Alphabet Hit Interesting Junctures //// .......
A Market Entitled...
READ MORE
MEMBERS ONLY
VeriSign Whiffs with a Big Bearish Engulfing
by Arthur Hill,
Chief Technical Strategist, TrendInvestorPro.com
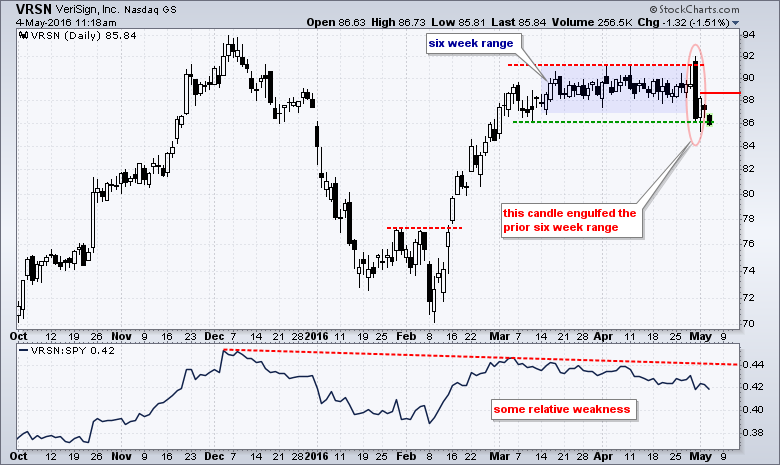
There are bearish engulfing patterns and then there are BEARISH ENGULFING patterns. VeriSign formed the latter with one of the biggest I have seen in some time. The chart shows the bearish engulfing pattern opening above the April high and finishing near the early March low. The stock got a...
READ MORE
MEMBERS ONLY
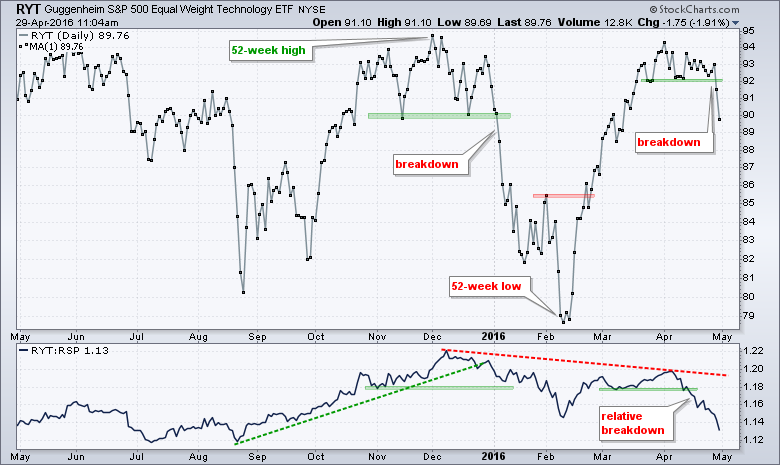
Techs Continue to Weigh - Utilities are Actually Leading - Materials are Most Extended - Webinar Video
by Arthur Hill,
Chief Technical Strategist, TrendInvestorPro.com
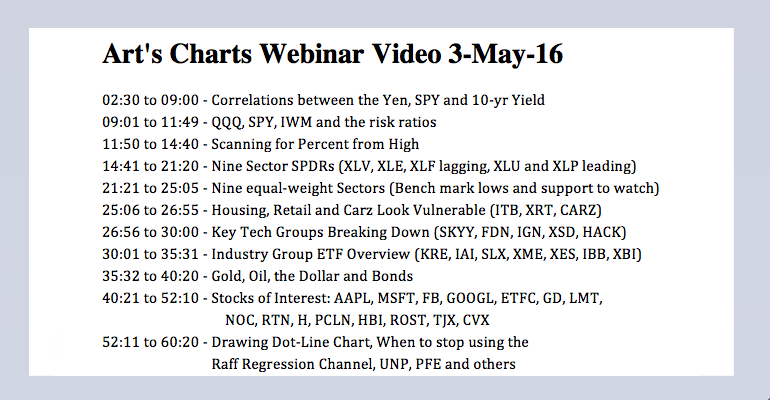
SPDRs versus Equal-weight Sectors // Three Long-term Sector Laggards // Two Long-term Sector Leaders // Technology and Consumer Discretionary Weigh // Marking Key Support for Finance, Industrials and Healthcare // Staples and Utilities Still Leading on Price Charts // Materials is Most Extended // Webinar Preview //// .......
SPDRs versus Equal-weight Sectors
The sector SPDRs represent large-caps stocks with...
READ MORE
MEMBERS ONLY
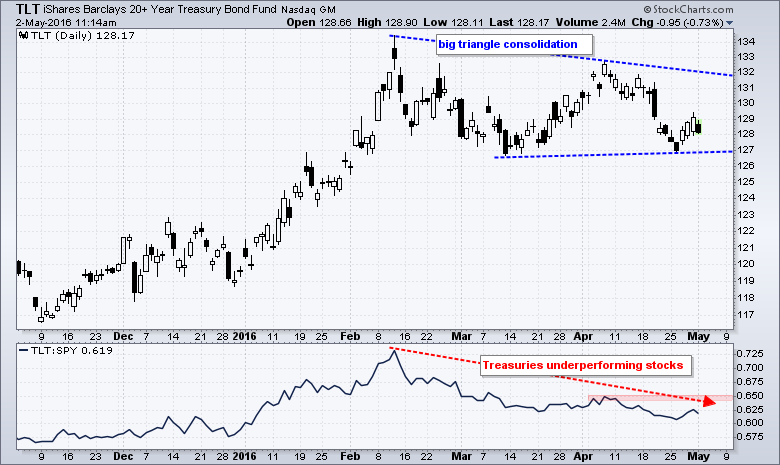
Three White Soldiers or a Bear Flag for TLT?
by Arthur Hill,
Chief Technical Strategist, TrendInvestorPro.com
The first week of the month is always a big week for Treasury bonds and the 20+ YR T-Bond ETF (TLT). There are always a slew of key economic reports and the employment report is usually the first Friday of the month. I am not going to get into the...
READ MORE
MEMBERS ONLY
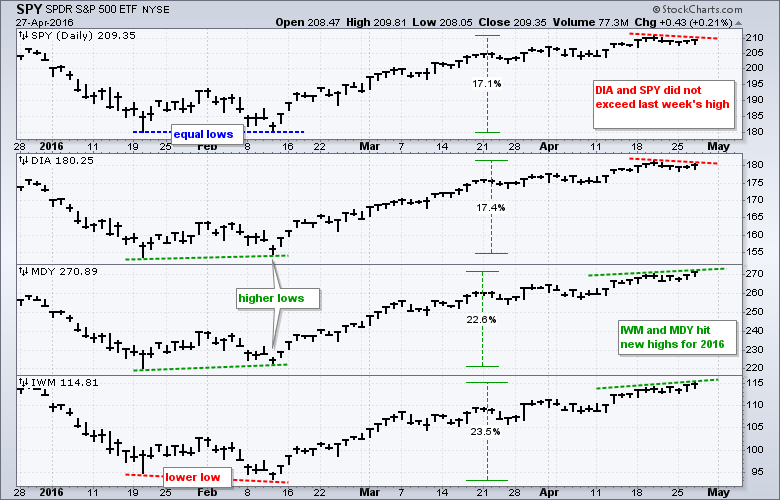
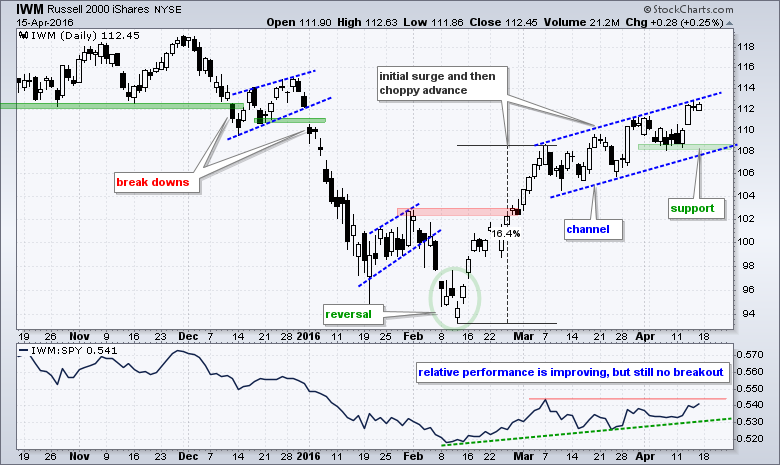
Is this a Correction or More? - Breadth Softens - A Battle Zone Brews for IWM - A Clear Level for SPY
by Arthur Hill,
Chief Technical Strategist, TrendInvestorPro.com
Putting the Pullback into Perspective // Breadth Softens, but Bullish Signals Remain // New Highs Dwindle, but Stay Net Positive // The Key Level for SPY is Obvious // A Battle Zone Brews for IWM // A Bull Flag for QQQ? //// .......
Putting the Pullback into Perspective
The Nasdaq 100 ETF led the market lower with...
READ MORE
MEMBERS ONLY
Semis Lead Tech Breakdown - Retail Weighs on Discretionary - Adding MACD and Bonds to Best Seven Months Strategy
by Arthur Hill,
Chief Technical Strategist, TrendInvestorPro.com
Semis Lead Tech Breakdown // Retail Leads EW Consumer Discretionary Lower // Adding MACD to the Best Seven Months Strategy // Adding Bonds for a Rotational Seven Month Strategy // Friday Food for Thought //// .......
Semis Lead Tech Breakdown
Semiconductors and the average tech stock were holding up better than large-cap techs, but that changed...
READ MORE
MEMBERS ONLY
Generals Diverge from Troops - XLI Leads - XSD Breaks Out - Dollar, Yen, Gold & Oil
by Arthur Hill,
Chief Technical Strategist, TrendInvestorPro.com
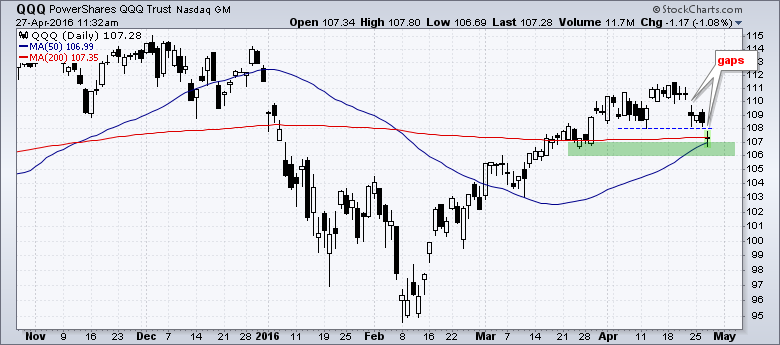
Generals Not Following the Troops // Unfilled Gaps Haunt QQQ // SPY Set to Test Gap Zone // IWM is the Current Leader // XLI Leads with New High // Three Strong Groups within Technology // Yen Broke out Before BoJ Surprise // Gold Battles Flag Breakout // Oil Reaches Fibonacci Retracement // Stocks to Watch ADI, INTC, QCOM,...
READ MORE
MEMBERS ONLY
The Other QQQ is Still Holding Up
by Arthur Hill,
Chief Technical Strategist, TrendInvestorPro.com
The Nasdaq 100 ETF (QQQ) is one of the weakest of the major index ETFs right now because of several large-caps within the ETF. Note that Apple (-10%), Facebook (-6%), Google (-6.5%) and Microsoft (-8%) are all down sharply this month. Amazon (+2%) is the only one of the...
READ MORE
MEMBERS ONLY
SystemTrader - Testing the Best Six Months Strategy and a Classic Moving Average Crossover System
by Arthur Hill,
Chief Technical Strategist, TrendInvestorPro.com
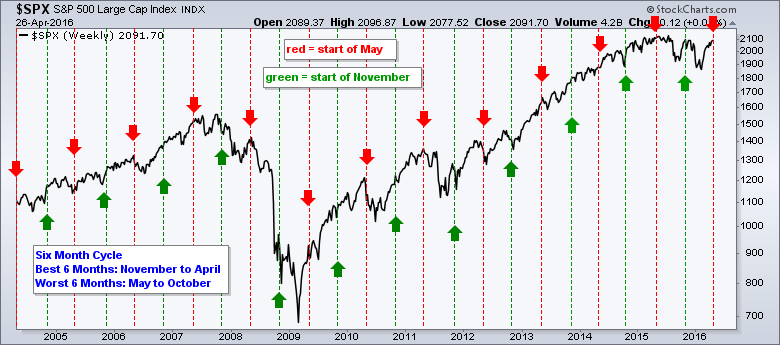
SystemTrader // Dissecting the Best Six Months Pattern // Historical Numbers Confirm // Shorting the Market is a Challenge // What is the deal with October? // Reducing the Dreaded Drawdown // Testing the 50-200 Cross Since 1950 // Final Thoughts // .........
May is approaching and this means the stock market is entering its weakest six-month period. With...
READ MORE
MEMBERS ONLY
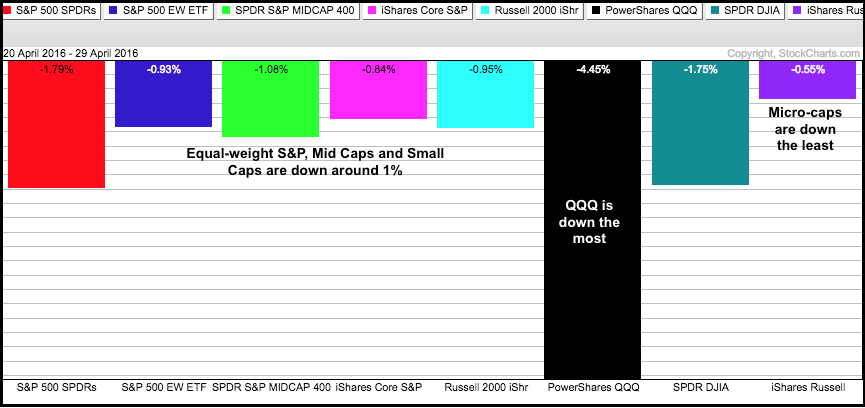
Micro-caps Take the Lead
by Arthur Hill,
Chief Technical Strategist, TrendInvestorPro.com
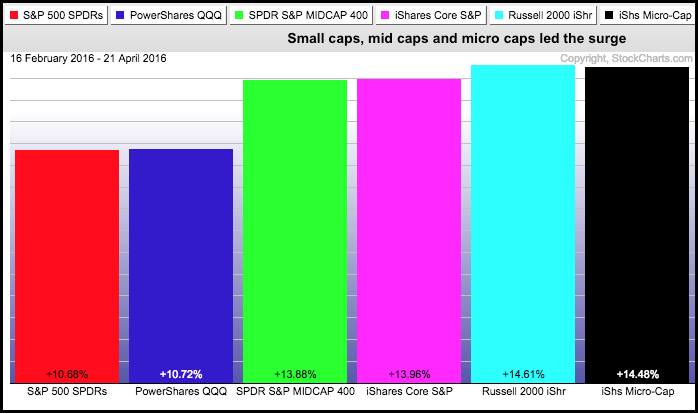
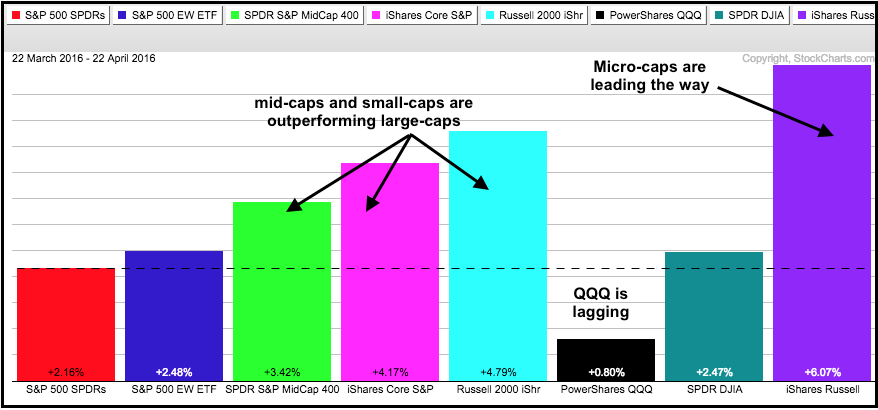
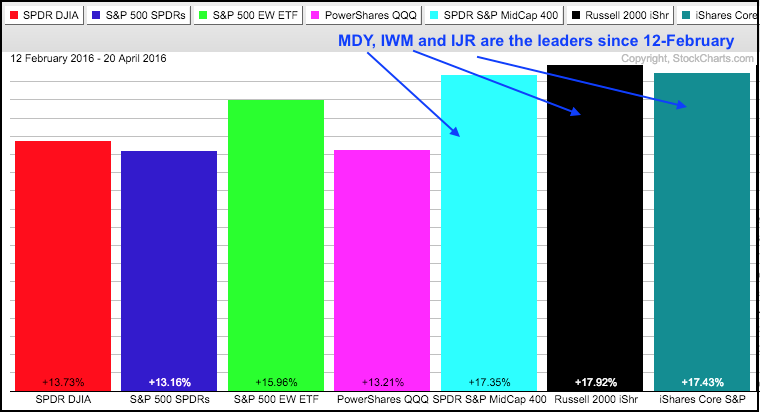
The appetite for risk has increased over the past month with small-caps, mid-caps and micro-caps leading the market higher. The PerfChart below shows one-month performance for the S&P 500 SPDR (red) and seven other broad market index ETFs. The S&P MidCap SPDR (green), S&P...
READ MORE
MEMBERS ONLY
Small-caps, Junk and Risk Appetite - HACK Firms - 7 Cyber Security Stocks to Watch
by Arthur Hill,
Chief Technical Strategist, TrendInvestorPro.com
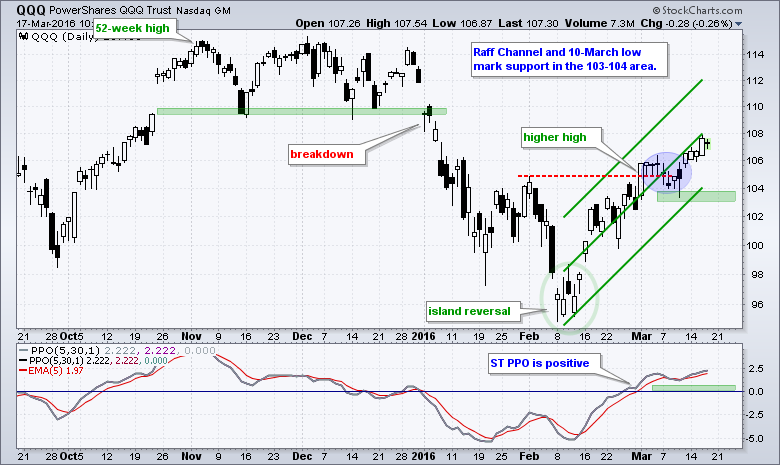
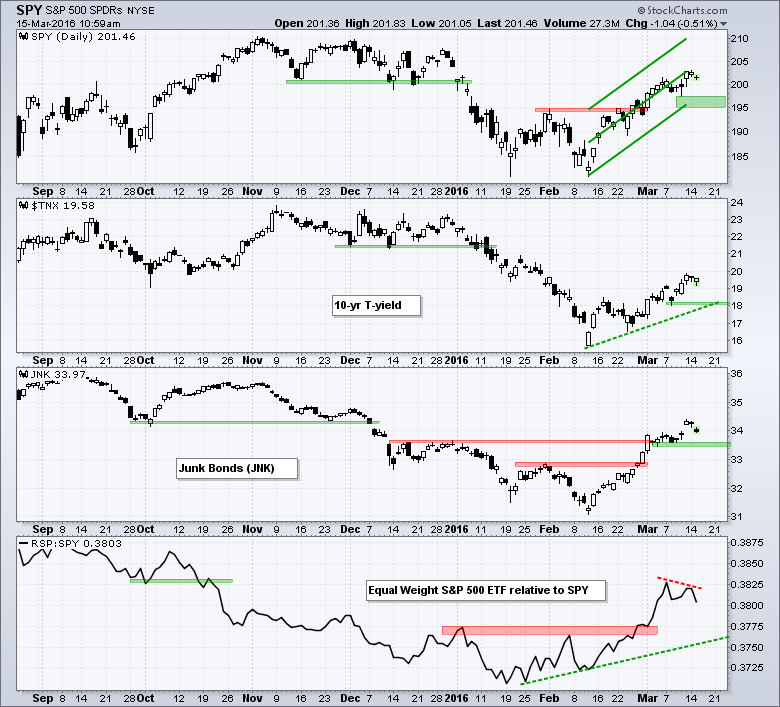
Small-caps, Junk Bonds and Risk Appetite // QQQ Forms Island Reversal // IWM Continues to Outperform // SPY Holds Breakout // HACK Consolidates after Big Surge // Seven Cyber Security Stocks to Watch ////
Small-caps, Junk Bonds and Risk Appetite
Even though the stock market may be ripe for a correction of some sort in the...
READ MORE
MEMBERS ONLY
Breadth Remains Strong Enough - The Effect of Rising Rates on Key Assets and ETFs - Video
by Arthur Hill,
Chief Technical Strategist, TrendInvestorPro.com
SPY Challenges the Top of the Range // QQQ Continues to Lag SPY // Breadth Remains Strong Enough // High-Low Percent Wanes in April // Treasury Yields Could be Bottoming // Assets Affected by Rising Rates // Breakouts for the Finance, Bank and Broker ETFs // Oil Hits Prior Support Breaks // Gold Battles Flag Breakout // Dollar Turns...
READ MORE
MEMBERS ONLY
Gaps are Holding - Sector Rotation is Bullish - Yield Surge is Positive for Stocks
by Arthur Hill,
Chief Technical Strategist, TrendInvestorPro.com
Large-caps Still Leading, but Small-caps Perk Up // Mind the Gaps in SPY and IWM // Sector Rotation is Bullish for Broader Market // XLI, XLK and XLY Near 52-week Highs // XLY, XLI and XLK Hold Consolidation Breakouts // Utilities and Staples Suffer as Bond Surrogates // Short-term Leaders Remain Strong // Yield Surge is Bullish...
READ MORE
MEMBERS ONLY
A Dramatic Shift in Sector Rotation this Month
by Arthur Hill,
Chief Technical Strategist, TrendInvestorPro.com
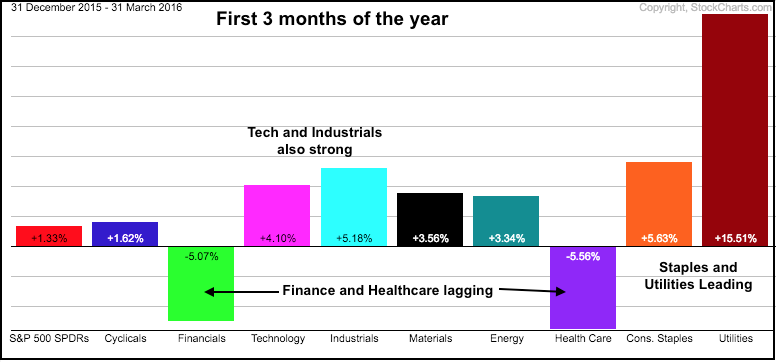
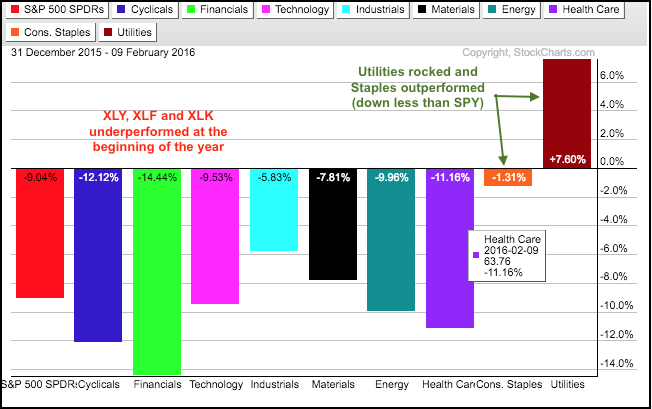
There has been a clear changing of the guard in April and chartists can see this change with a PerfChart on two different timeframes. The first PerfChart shows performance for the nine sectors SPDRs and SPY for the first three months of the year. Notice that the Consumer Staples SPDR...
READ MORE
MEMBERS ONLY
New Highs for SPY, DIA and several AD Lines - Risk Indicators Turn Up - Webinar Video
by Arthur Hill,
Chief Technical Strategist, TrendInvestorPro.com
New Highs for SPY and DIA // Uptrends Extend for SPY, QQQ and IWM // New Highs in Several AD Lines // Risk Indicators Turn Up Again // Five Clear Sector Leaders // Three of Five FAAAM Stocks Strong // Webinar Highlights ////
New Highs for SPY and DIA
The weight of the evidence remains bullish for...
READ MORE
MEMBERS ONLY
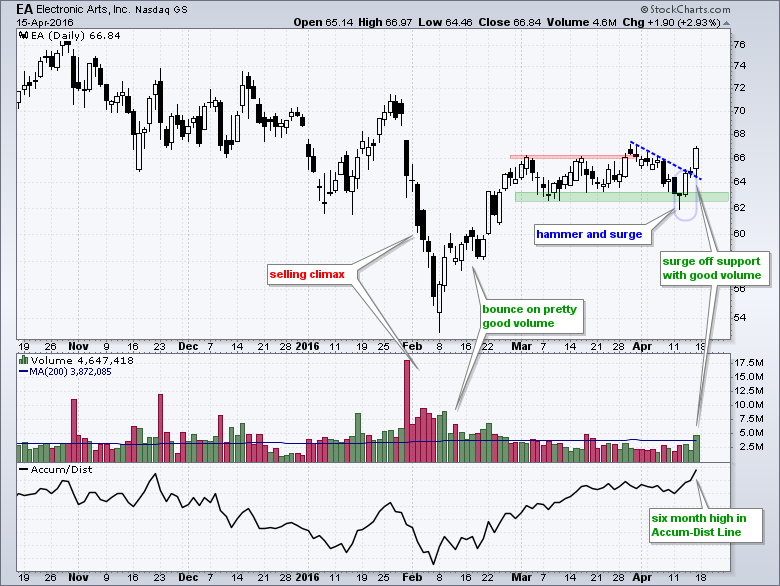
Accumulation Distribution Line Leads Big Move in EA
by Arthur Hill,
Chief Technical Strategist, TrendInvestorPro.com
Electronic Arts (EA) got a big bounce off support with expanding volume and a strong Accumulation Distribution Line. On the price chart, EA plunged in late January and early February on high volume and this looks like a selling climax. The stock quickly recovered with pretty good volume and then...
READ MORE
MEMBERS ONLY
Oil Enters Potential Reversal Zone - XLE Forms Another Wedge - XES Lags
by Arthur Hill,
Chief Technical Strategist, TrendInvestorPro.com
Oil Hits Resistance in Retracement Zone // Energy and Finance Lagging Overall // XLE Forms Yet Another Wedge // Short-term Breakout Holding for XLE // Oil & Gas Equip & Services SPDR Lags XLE ////
Oil Enters Potential Reversal Zone
In Friday's commentary, I noted that oil was in a long-term downtrend and...
READ MORE
MEMBERS ONLY
Small-caps and Financials Perk Up, but Still Lag Overall
by Arthur Hill,
Chief Technical Strategist, TrendInvestorPro.com
It was a pretty good week for the stock market with the Russell 2000 iShares (IWM) and the Finance SPDR (XLF) showing upside leadership for a change. IWM gained 3.21% for the week and led the major index ETFs higher. XLF gained 4.60% and was the second strongest...
READ MORE
MEMBERS ONLY
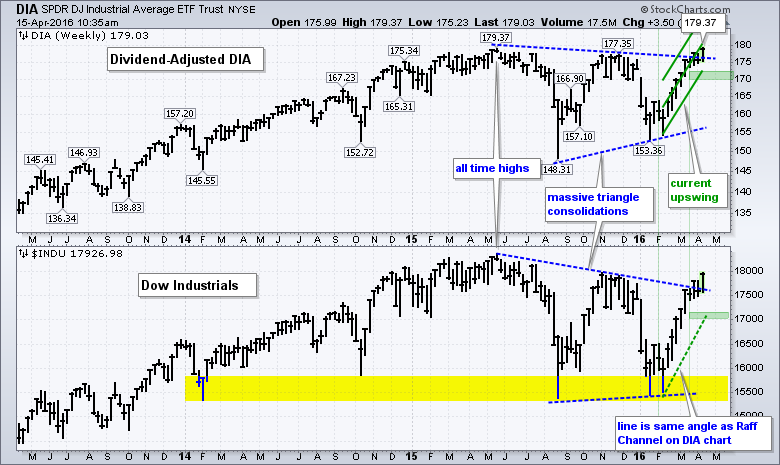
Dow Breakout - Sectors Near 52-week Highs - A Normal Retracement for Crude
by Arthur Hill,
Chief Technical Strategist, TrendInvestorPro.com
Dow Breaks out of Massive Triangle // Sectors Close to 52-week Highs // Sector High-Low Leaders // XLK is the Clear Leader // Finance Perks Up with Flag Breakout // Healthcare Challenges Channel // Silver Hits Resistance // Dollar Firms at Support // Oil: A Bounce within a Downtrend ////
Dow Breaks out of Massive Triangle
The chart below...
READ MORE
MEMBERS ONLY
All Time High Nears - Playing Pullbacks and Oversold Conditions - Offensive Sectors Take the Lead
by Arthur Hill,
Chief Technical Strategist, TrendInvestorPro.com
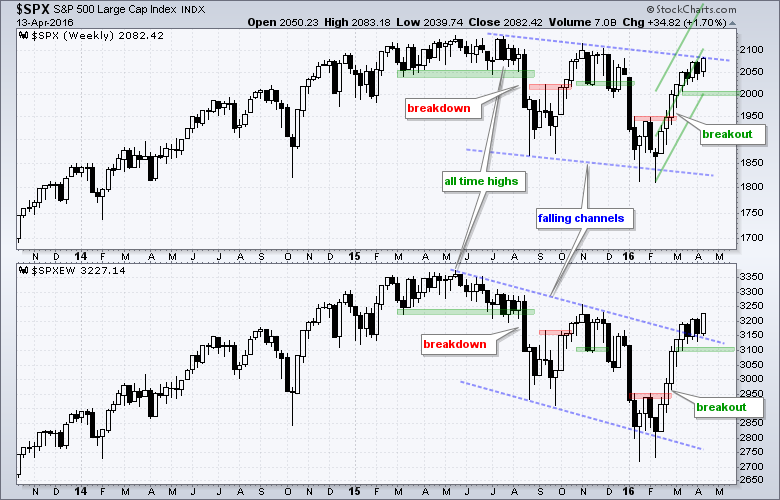
An All Time High within Reach // When Support is Greater than Resistance // Corrections within the Uptrend // Offensive Sectors Lead // Bullish Resolutions Define Market Environment ////
An All Time High within Reach
I am operating under the thesis that there is more bullish evidence out there than bearish evidence. In other words,...
READ MORE
MEMBERS ONLY
FTSE Leads Europe and Turns Positive Year-to-date
by Arthur Hill,
Chief Technical Strategist, TrendInvestorPro.com
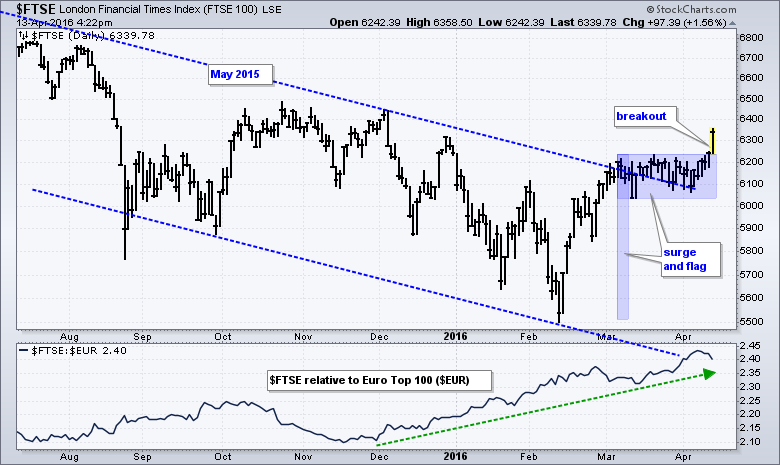
Today's stock market rally started in Asia, extended into Europe and carried through to the US this morning. The major European indices were sharply higher with the London FTSE ($FTSE) leading the charge. On the price chart, the FSTE surged to a trend line extending down from May...
READ MORE
MEMBERS ONLY
Bull, Bear or Neutral? - Small-Mids Underperforming - Three Big Sector Drags - Webinar Video
by Arthur Hill,
Chief Technical Strategist, TrendInvestorPro.com
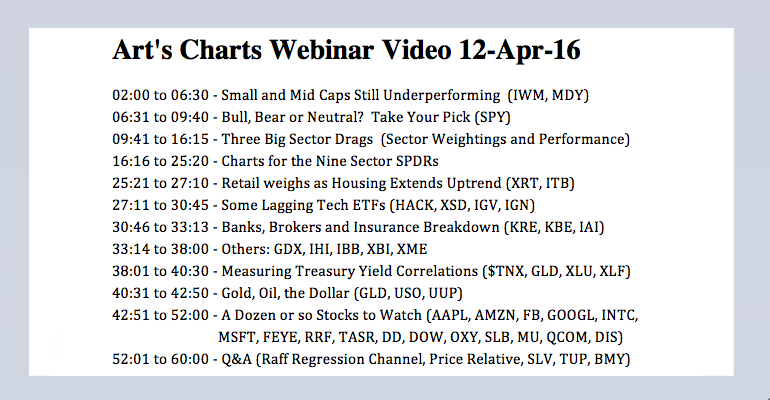
Bull, Bear or Neutral? // Small and Mid Caps Still Underperforming // Three Big Sector Drags // Breaking Down Sector Weightings // Ranking the Nine Sector SPDRs // Webinar Video ////
Bull, Bear or Neutral?
There is an argument to be made that the S&P 500 SPDR (SPY) is in a big trading range....
READ MORE
MEMBERS ONLY
Alcoa Stalls at Resistance as Earnings Kickoff Looms
by Arthur Hill,
Chief Technical Strategist, TrendInvestorPro.com
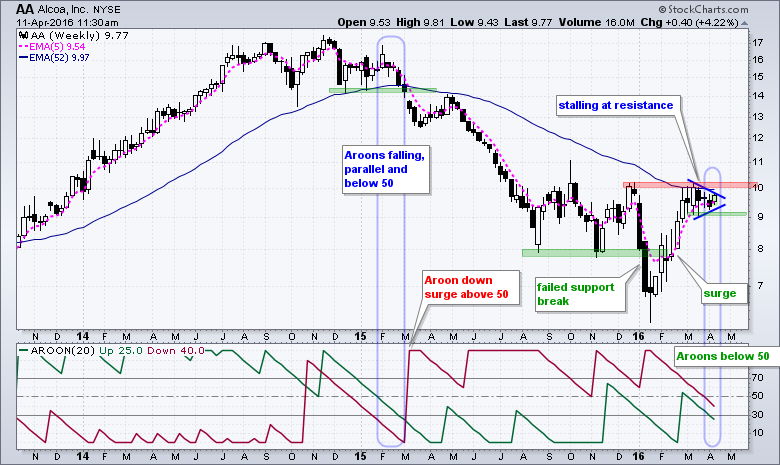
Alcoa (AA) kicks off first quarter earnings with its report today after the market close. I have no idea about earnings or how the stock will react, but price is at a most interesting juncture as a consolidation takes place just below resistance. This weekly candlestick chart shows AA breaking...
READ MORE
MEMBERS ONLY
High-Low Percent Triggers - Risk Indicators Weaken - Gold Forms Bull Flag
by Arthur Hill,
Chief Technical Strategist, TrendInvestorPro.com
High-Low Percent Confirms Bullish Environment // Pullbacks Remain Shallow // IWM Forms Bullish Continuation Pattern // Risk Indicators Soften // Treasury Bond ETFs Break Out // Oil Corrects and Breaks Out // Gold Challenges Flag Resistance // Catching Up ////
High-Low Percent Confirms Bullish Environment
I am back in the saddle and not much has changed in the...
READ MORE
MEMBERS ONLY
Large-cap Trend Indicators Turn up - Small-cap New Lows Tick up - Watching T-Yields and Oil
by Arthur Hill,
Chief Technical Strategist, TrendInvestorPro.com
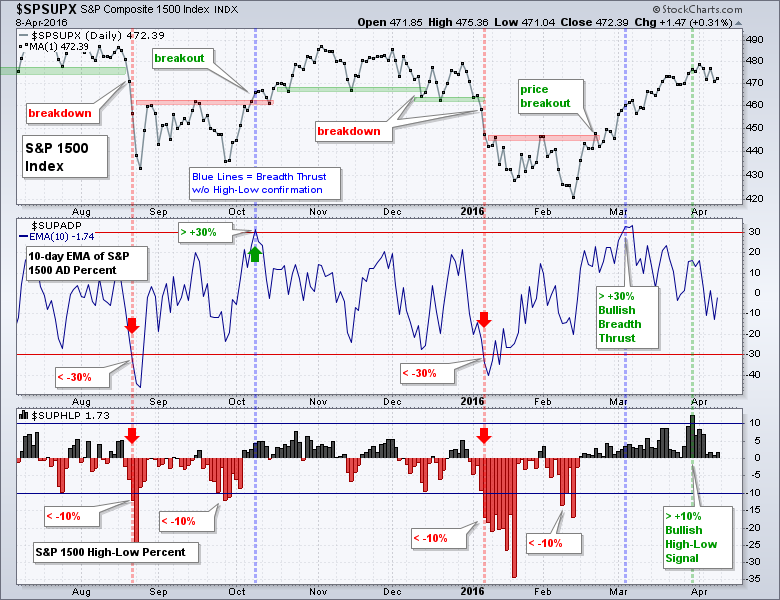
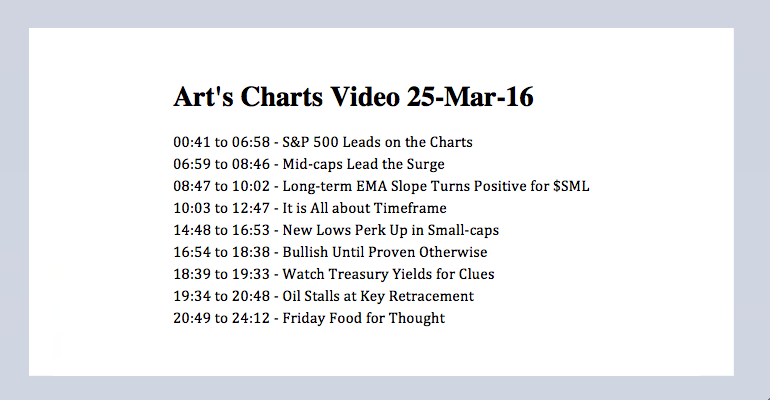
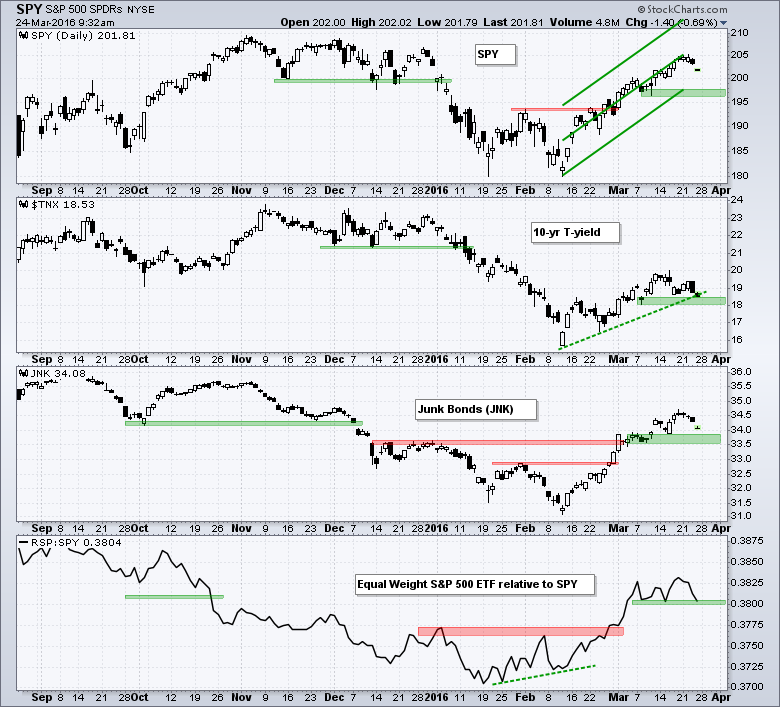
$SPX Leads on the Charts // Vacation // $MID Leads the Surge // Long-term EMA Slope Turns Positive for $SML // It is All about Timeframe // New Lows Perk Up in Small-caps // Bullish Until Proven Otherwise // Watch Treasury Yields for Clues // Oil Stalls at Key Retracement // Friday Food for Thought ////
S&P 500...
READ MORE
MEMBERS ONLY
8 Risk Ratios to Watch - QQQ and IWM Hit Key Fib Retracement - Fed Talks and Bonds Balk
by Arthur Hill,
Chief Technical Strategist, TrendInvestorPro.com
Eight Risk Ratios to Watch // Replay of October Surge // SPY and the PPO Strategy // QQQ and IWM Trends Remain Mixed // Feds Talk and Bonds Balk // Oil Set to Test Breakout // Finance Stalls Near Key Retracement // Precious Metals Take a Hit // Vacation Notice ////
I am seeing a bit of deterioration in...
READ MORE
MEMBERS ONLY
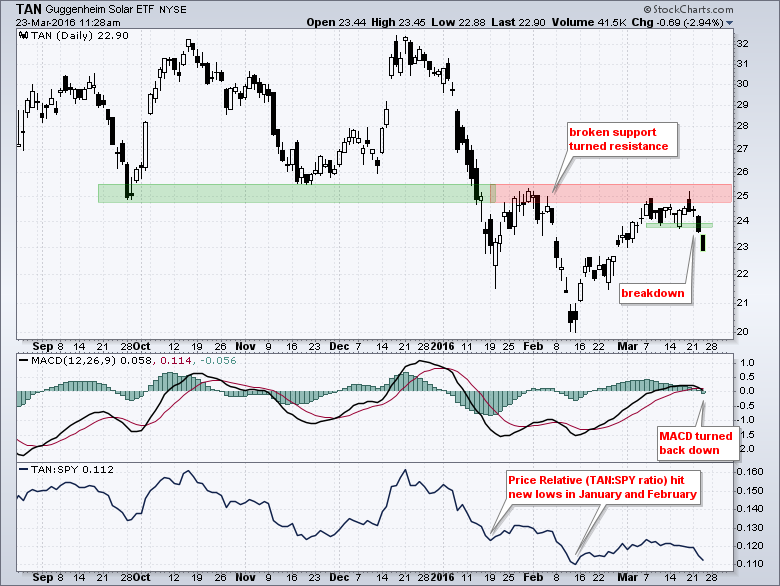
Solar ETF Reverses near Key Level as Momentum Turns
by Arthur Hill,
Chief Technical Strategist, TrendInvestorPro.com
The Solar Energy ETF (TAN) has been one of the weakest industry group ETFs over the past year and that looks set to continue with the recent breakdown. The chart shows TAN bouncing with the market from mid February to mid March and hitting resistance near broken support. This is...
READ MORE
MEMBERS ONLY
October Surge vs Current Surge - Volume Flows in SPY - Utilities and Staples Slack - Webinar Video
by Arthur Hill,
Chief Technical Strategist, TrendInvestorPro.com
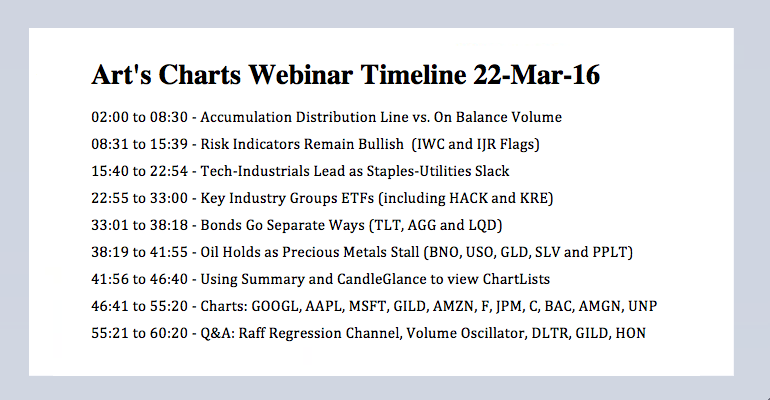
Risk Indicators Remain Bullish // Comparing the Current Advance with October // Volume Flows Strong in SPY // Industrials and Technology Maintain Top Position // Utilities and Staples Start Slacking // Webinar Video ////
Risk Indicators Remain Bullish
There is not much change in the overall picture for the stock market - and the other markets...
READ MORE
MEMBERS ONLY
Under Armour Traces out Bullish Continuation Pattern
by Arthur Hill,
Chief Technical Strategist, TrendInvestorPro.com
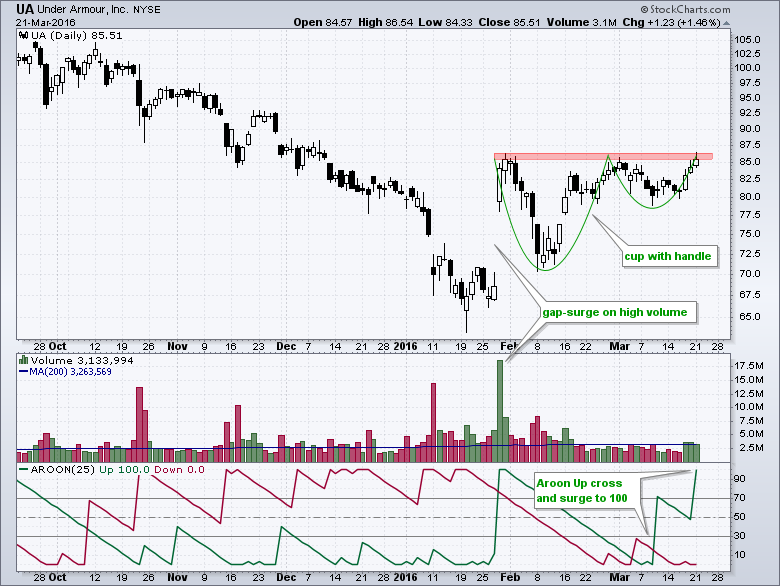
UA is attracting buying interest as March madness moves to the sweet sixteen. Note that UA sponsored 10 teams at the start of the tournament, including Utah and Notre Dame. On the price chart, the stock has a bullish cup-with-handle pattern taking shape. This is a continuation pattern and a...
READ MORE
MEMBERS ONLY
The Great Rotation of 2016 - Finance Correlations to Watch - REITS Lead RYF - Uptrends for 6 Big Banks
by Arthur Hill,
Chief Technical Strategist, TrendInvestorPro.com
The Great Rotation of 2016 // Finance Sector Correlations to Watch // Wedge Continues to Rise for 10-yr Yield // Big Banks Make-or-break XLF // REITs and Insurance Power RYF // Breakouts and Uptrends for 6 Big Banks ////
The Great Rotation of 2016
It has been a tale of two markets in 2016. The first...
READ MORE
MEMBERS ONLY
New Highs Surge on NYSE, but Lag on Nasdaq
by Arthur Hill,
Chief Technical Strategist, TrendInvestorPro.com
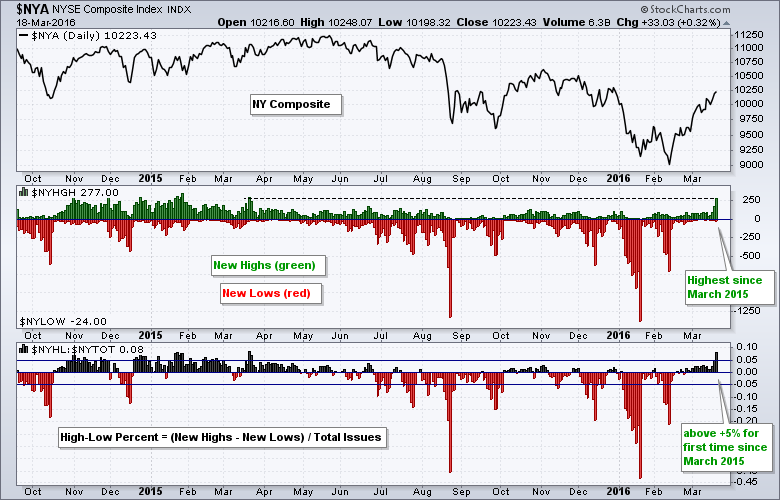
Two weeks ago I featured the NYSE McClellan Oscillator ($NYMO) and the Nasdaq McClellan Oscillator ($NAMO) as they surged to their highest levels in years. These breadth indicators are very broad and represent virtually all stocks traded in the US. Big moves in both breadth indicators signaled a bullish breadth...
READ MORE
MEMBERS ONLY
Breakouts Hold, Not Fold - Risk Indicators Go Big - New Highs Expand - XLI and XLK Lead - Food for Thought
by Arthur Hill,
Chief Technical Strategist, TrendInvestorPro.com
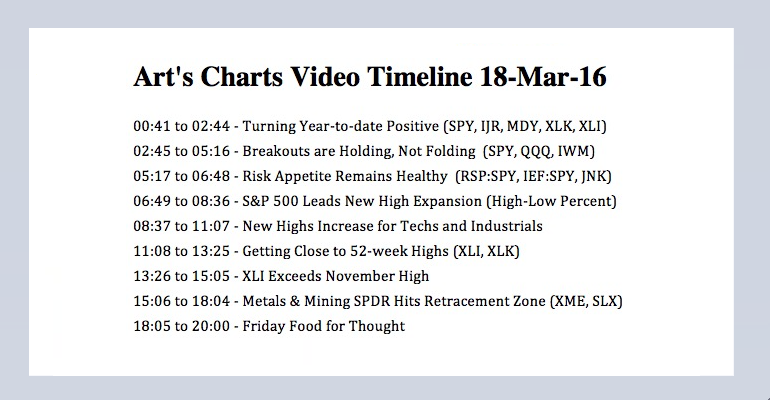
Turning Year-to-date Positive // Breakouts are Holding, Not Folding // Risk Appetite Remains Healthy // S&P 500 Leads New High Expansion // New Highs Increase for Techs and Industrials // Getting Close to More 52-week Highs // XLI Exceeds November High // Metals & Mining SPDR Hits Retracement Zone // Friday Food for Thought ////
Turning Year-to-date...
READ MORE
MEMBERS ONLY
SPY Leads - The 1-2 Breadth Punch - Healthcare Breaks - Gold and Silver Affirm Support
by Arthur Hill,
Chief Technical Strategist, TrendInvestorPro.com
SPY Leads Market Higher // The One-Two Breadth Punch // Surging within a Big Range // Marking a Reversal Zone for a Pullback // Healthcare Breaks Down as Finance Stalls // Gold and Silver Affirm Support Levels // Crude Holds Double Bottom Breakout ////
QQQ led the big three with the biggest gain on Wednesday and the...
READ MORE
MEMBERS ONLY
S&P 500 Seasonal Patterns Remain Bullish
by Arthur Hill,
Chief Technical Strategist, TrendInvestorPro.com
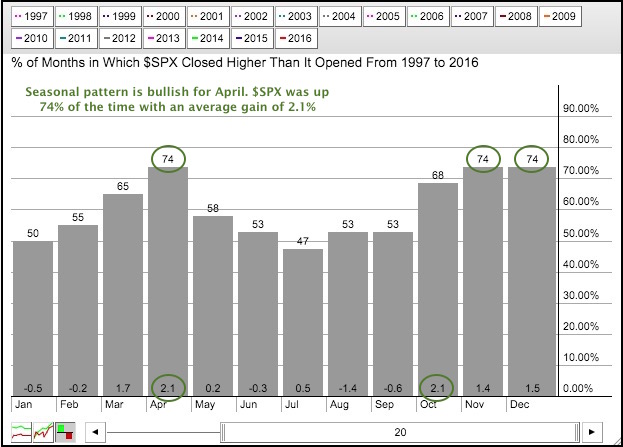
The chart below shows the seasonal patterns for the S&P 500 over the last twenty years. The bars show the percent of months that the S&P 500 closed positive and the numbers at the bottom show the average change. Three months stand out from the rest:...
READ MORE
MEMBERS ONLY
Risk Indicators Still Bullish - Tech and Industrials Counter Finance and Healthcare - Webinar Video
by Arthur Hill,
Chief Technical Strategist, TrendInvestorPro.com
Risk Indicators Still Bullish // SPY Leads with Strongest Short-term Uptrend // Energy, Finance and Healthcare are the Laggards // Consumer Discretionary SPDR Holds Breakout // Industrials SPDR Nears Prior High // Webinar Preview ////
Risk Indicators Still Bullish
The financial markets still have a good appetite for risk and this is bullish for stocks. The...
READ MORE