MEMBERS ONLY
Trend vs Noise - Small and Mid Caps Hold the Key - Biotechs Look Vulnerable
by Arthur Hill,
Chief Technical Strategist, TrendInvestorPro.com
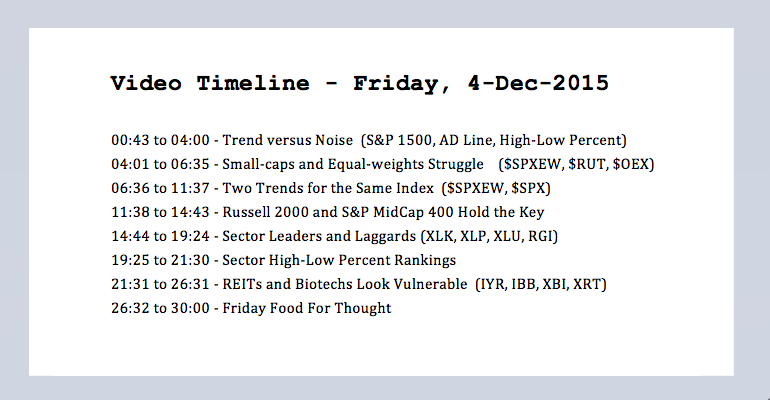
Click here for today's video // Trend versus Noise // Small-caps and Equal-weights Struggle // Two Different Trends for the Same Index // Russell 2000 and S&P MidCap 400 Hold the Key // Sector Leaders and Laggards // Sector High-Low Percent Rankings // REITs and Biotechs Look Vulnerable // Friday Food For Thought ////
Trend...
READ MORE
MEMBERS ONLY
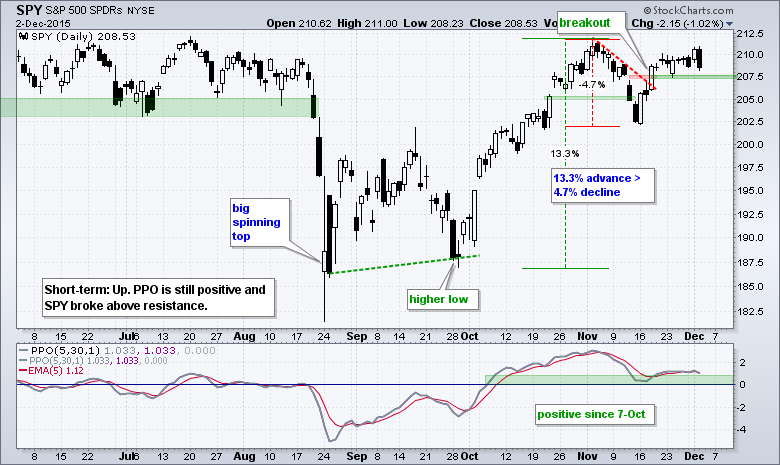
SPY Holds Breakout - 2 Commodities in Uptrends - 15 Stock Charts to Watch
by Arthur Hill,
Chief Technical Strategist, TrendInvestorPro.com
SPY Holds Short-term Breakout // IWM Shows Relative Chart Strength // 2-yr Yield versus the 10-yr Yield // Watching the Channel in IEF // Two Commodities in Uptrends // Legacy Airlines Sport Constructive Chart Patterns // Big Banks Consolidate after Surge // Short-term Bearish Patterns in XOM and CVX // Other Charts: ADI, APD, CAT, CAMP, NOK, SIGI,...
READ MORE
MEMBERS ONLY
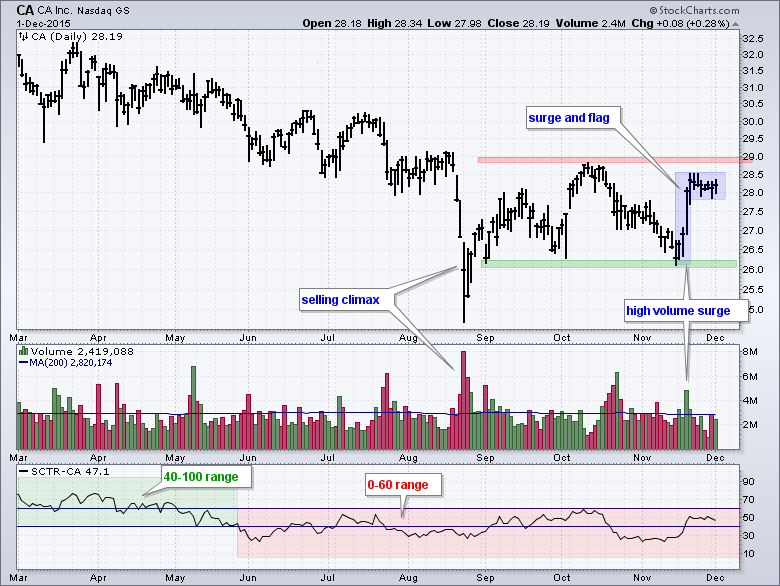
CA Forms a High and Tight Flag
by Arthur Hill,
Chief Technical Strategist, TrendInvestorPro.com
CA Inc (CA) remains in a downtrend, but a reversal could be brewing as the stock forms a high and tight flag just below key resistance. CA was trending down most of the year and then formed a selling climax with a sharp decline on high volume in August. The...
READ MORE
MEMBERS ONLY
Small Caps Come Alive - Bullish Pattern for SPY - Current Market Themes
by Arthur Hill,
Chief Technical Strategist, TrendInvestorPro.com
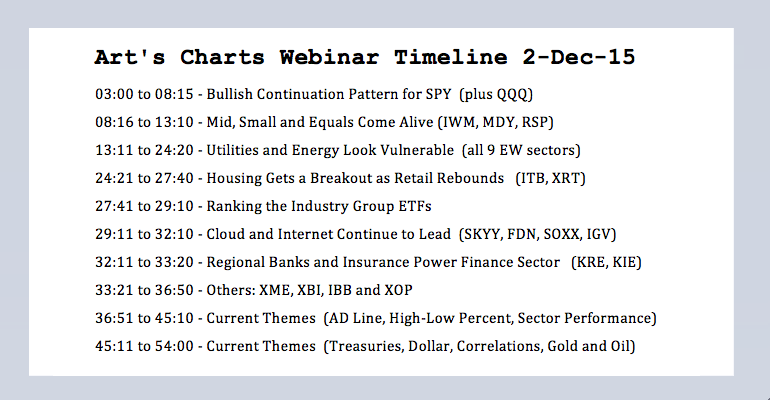
Small and Mid Caps Come Alive // Bullish Continuation Pattern for SPY // Utilities and Energy Look Vulnerable // Housing Gets a Breakout as Retail Rebounds // Cloud and Internet Continue to Lead // Regional Banks and Insurance Power Finance Sector // Current Market Themes ////
Market Overview
While we still have some day-to-day noise and the...
READ MORE
MEMBERS ONLY
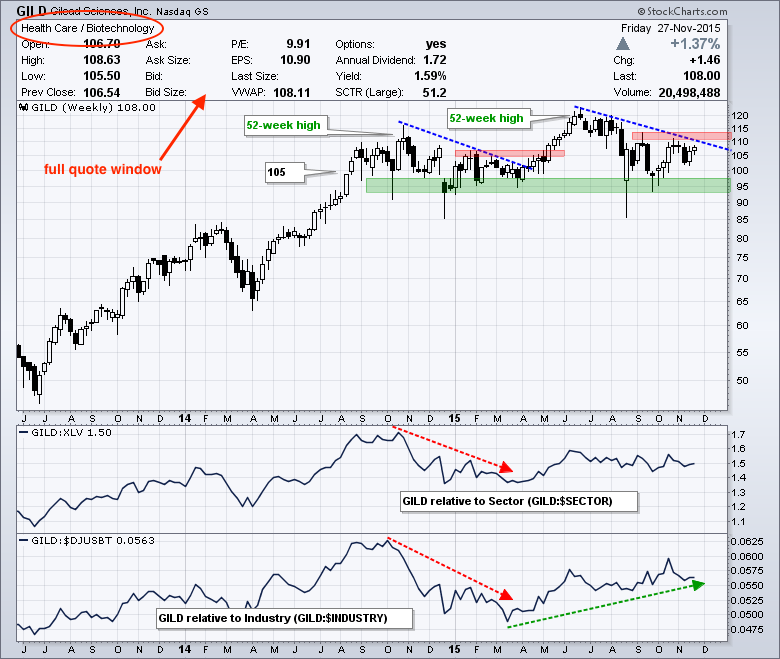
A Boring Biotech that Deserves a Second Look
by Arthur Hill,
Chief Technical Strategist, TrendInvestorPro.com
Gilead is up for the most boring biotech award because the stock has traded relatively flat since September 2014. Despite numerous crosses of the 105 area, the overall trend is still up and chartists should watch for a breakout to signal a continuation of this uptrend. On the price chart,...
READ MORE
MEMBERS ONLY
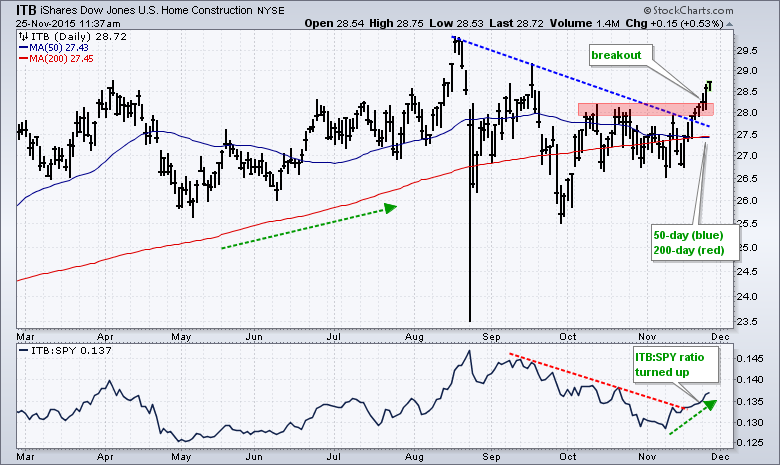
Home Construction iShares Goes for a Breakout
by Arthur Hill,
Chief Technical Strategist, TrendInvestorPro.com
After lagging the market in October, the Home Construction iShares (ITB) is perking up with a breakout on the price chart and upturn in the price relative. ITB peaked in August and fell into September. Even though the market rallied in October and early November, ITB did not partake and...
READ MORE
MEMBERS ONLY
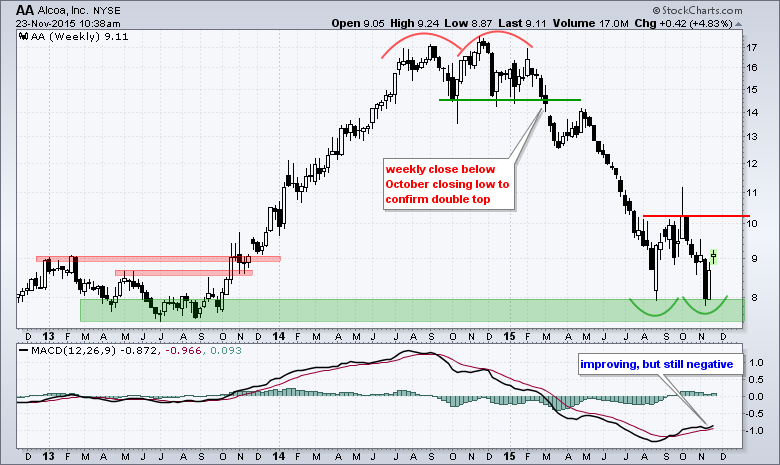
Big Candlesticks Form Potential Reversal Pattern in Alcoa
by Arthur Hill,
Chief Technical Strategist, TrendInvestorPro.com
The overall trend for Alcoa is currently down, but the ETF is showing signs of life with a bullish reversal pattern taking shape. The chart shows AA making a round trip from 8 to 8 with a double top at 17 in between. Chartists can apply the inverse logic of...
READ MORE
MEMBERS ONLY
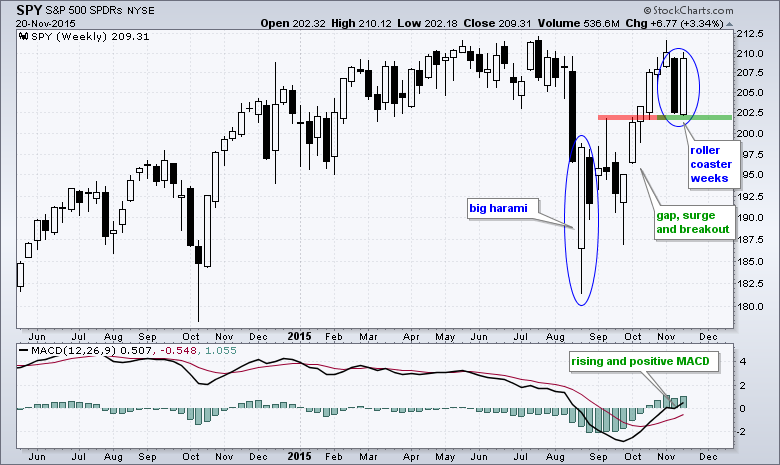
The Two Weeks that Weren't
by Arthur Hill,
Chief Technical Strategist, TrendInvestorPro.com
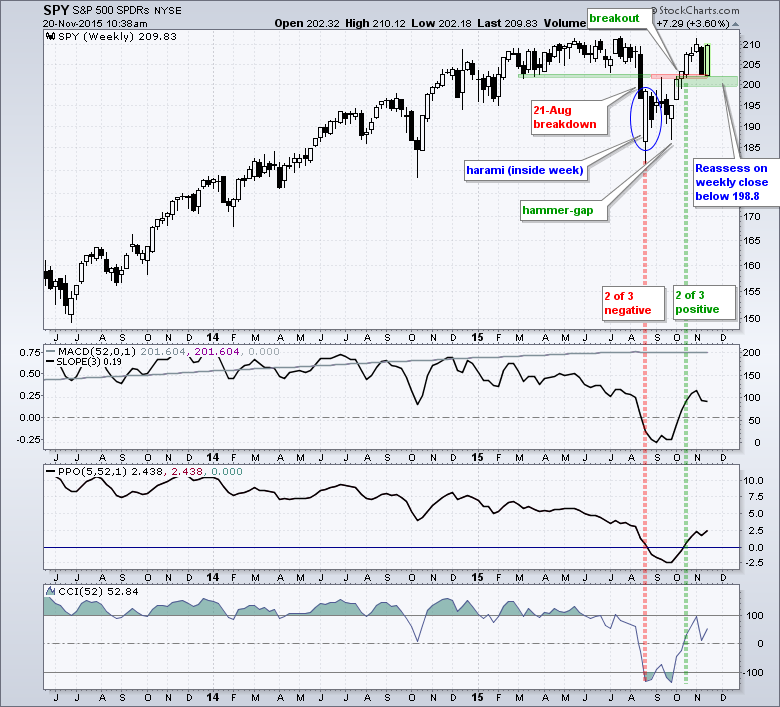
The S&P 500 SPDR (SPY) acted just like a roller coaster the last two weeks. It took traders for a wild ride and then dropped them off right where they started - a little frazzled no doubt. SPY opened near 209 on Monday, November 9th, and then plunged...
READ MORE
MEMBERS ONLY
Lines in the Sand -- A Broad Surge is Upon Us -- Friday Food for Thought
by Arthur Hill,
Chief Technical Strategist, TrendInvestorPro.com
Lines in the Sand for Three Key ETFs // SPY and IJR are Bullish // MDY is Lagging // Using Weekly Breadth Indicators // High-Low Percent Stalls for NYSE and Nasdaq // Will a Broad Surge follow the Broad Decline? // Scan Code for Rate-of-Change and Ranking // AD Percent Indicators Surge // Friday Food for Thought ////
Lines...
READ MORE
MEMBERS ONLY
Bifrucation Remains - QQQ and IWM Hold Support -- Nektar Gets a Breakout
by Arthur Hill,
Chief Technical Strategist, TrendInvestorPro.com
QQQ Continues to Lead // SPY Gets a Breakout // IWM Follows Through on Engulfing Pattern // Long-term Trend Change in Nektar // Uptrends Edge out Downtrends in S&P 1500 // New Lows Edge out New Highs // Market Themes // 5 PPO Setups ////
QQQ Continues to Lead
QQQ firmed at support on Monday with...
READ MORE
MEMBERS ONLY
Gold Hit by Dollar and Rising Yields
by Arthur Hill,
Chief Technical Strategist, TrendInvestorPro.com
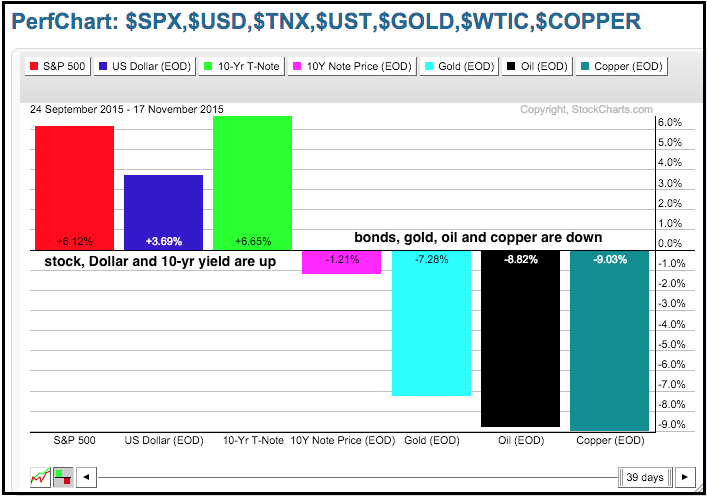
The PerfChart below tells the story for the Dollar, Treasury bonds and commodities since late September. Note that stocks, the Dollar Index ($USD) and the 10-YR Treasury Yield ($TNX) are down, while the 10-yr Note ($UST), Spot Gold ($GOLD), Spot Crude ($WTIC) and Spot Copper ($COPPER) are down. It is...
READ MORE
MEMBERS ONLY
QQQ and IWM Hold -- High-Low Indicators Fold -- 4 PPO Setups
by Arthur Hill,
Chief Technical Strategist, TrendInvestorPro.com
Mister Market is Mixed Up // QQQ Holds the Gap // Short-term PPO Holds for SPY // IWM Holds Support with Engulfing Pattern // %Above Indicators Trigger Bullish Signal // High-Low Indicators Turn Bearish // EW Finance, Technology and Staples are the Leaders // 4 PPO Strategy Charts /////
Mister Market is Mixed Up
The overall market is...
READ MORE
MEMBERS ONLY
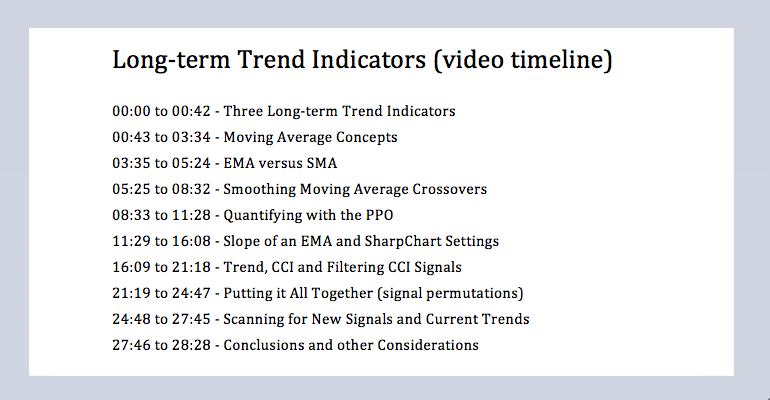
Long-term Trend Indicators and Signals - with Video and Scan Code
by Arthur Hill,
Chief Technical Strategist, TrendInvestorPro.com
Introduction // Moving Averages and Trend // Creating a Smooth Operator // Slope of an EMA // Commodity Channel Index // Putting it All Together // Conclusions // Scan Code ////
Introduction
Trend is a very important aspect of technical analysis and investing. It is often pretty easy to identify the current trend, but it is much harder...
READ MORE
MEMBERS ONLY
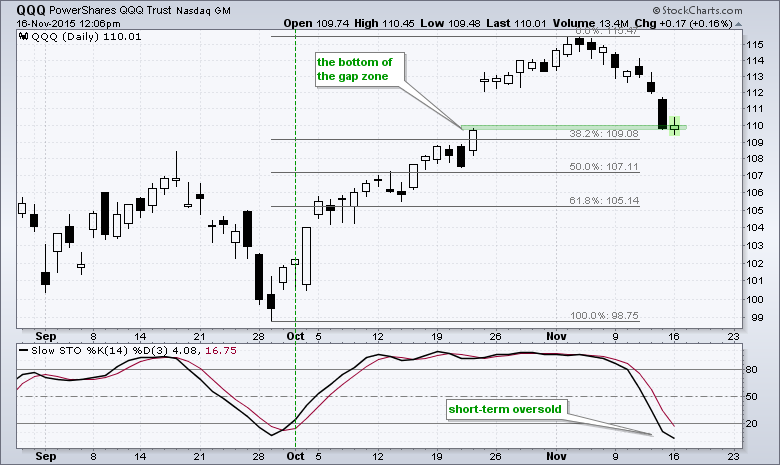
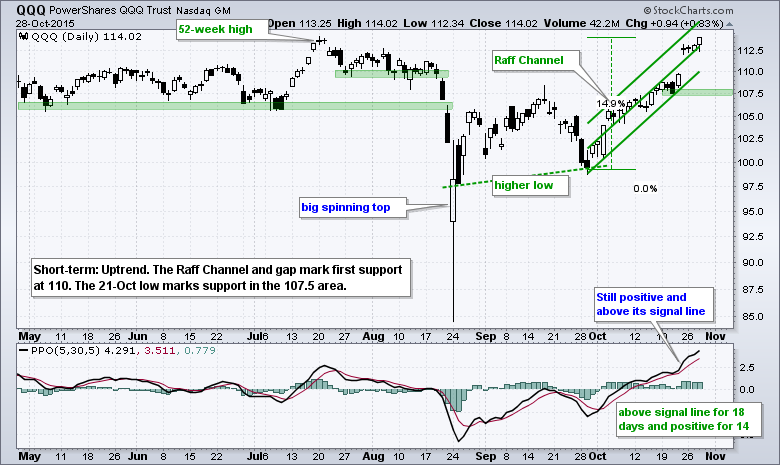
QQQ Attempts to Firm: Here's What to Watch
by Arthur Hill,
Chief Technical Strategist, TrendInvestorPro.com
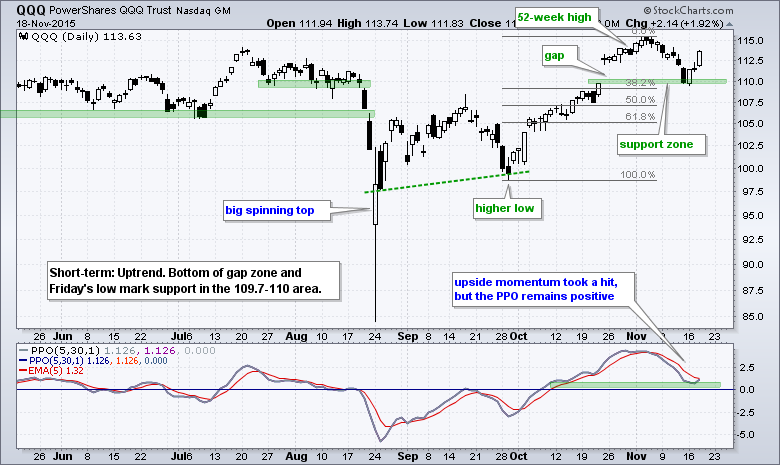
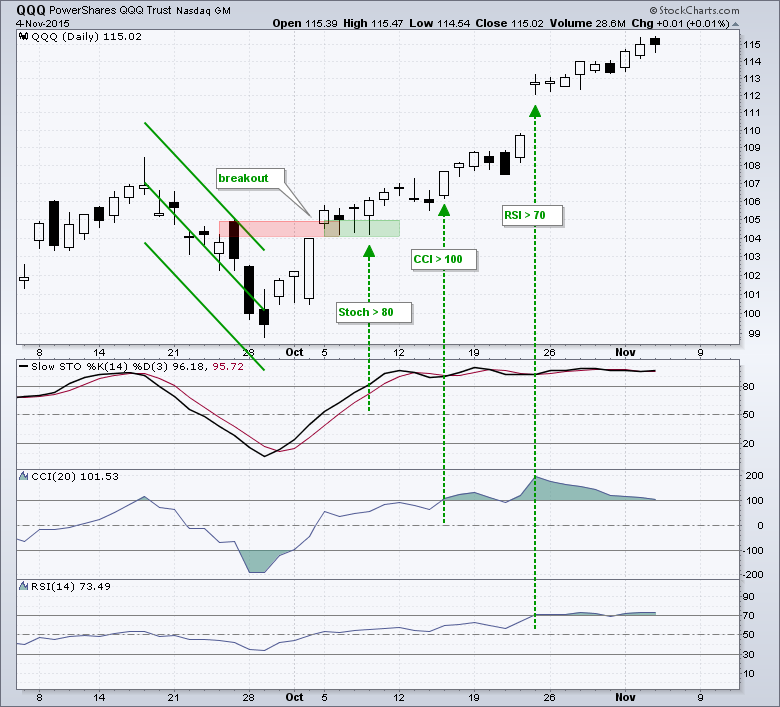
The Nasdaq 100 ETF (QQQ) was hit quite hard last week, but the ETF is making an attempt to firm on Monday and chartists should watch three things. First, the ETF gapped up and surged above 115. This gap was part of a 16% advance off the September low and...
READ MORE
MEMBERS ONLY
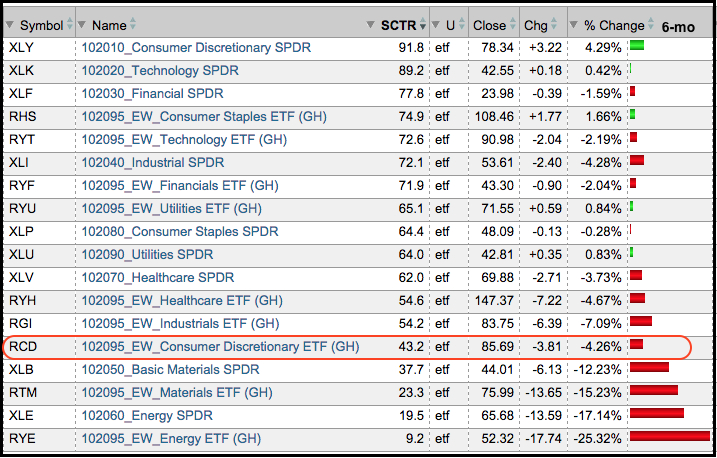
Equal Weight S&P 500 Tells a Different Story as Retailers Drop the Ball
by Arthur Hill,
Chief Technical Strategist, TrendInvestorPro.com
SCTR Drops for EW Consumer Discretionary // EW S&P 500 Fails to Keep Pace // S&P 500 Pulls back after Big Surge // Russell 2000 Remains a Problem Child // 2011 Redux // Watching High-Low Percent Before Flinching // Stocks Outperforming Other Assets // Retailers Cast a Dark Cloud // Friday Food for Thought...
READ MORE
MEMBERS ONLY
New Lows Remain Subbornly High -- Apple Fires a Warning Shot
by Arthur Hill,
Chief Technical Strategist, TrendInvestorPro.com
A Market for All Seasons // New Market Theme Added // 52-week Lows Remain High // High-Low Lines Still Rising // QQQ, SPY and IWM Charts Updated // Electronic Payments and Big Tech Rock // AAPL Fires a Warning Shot // PPO Strategy: 5 Signals and 2 Setups /////
A Market for All Seasons
This stock market has...
READ MORE
MEMBERS ONLY
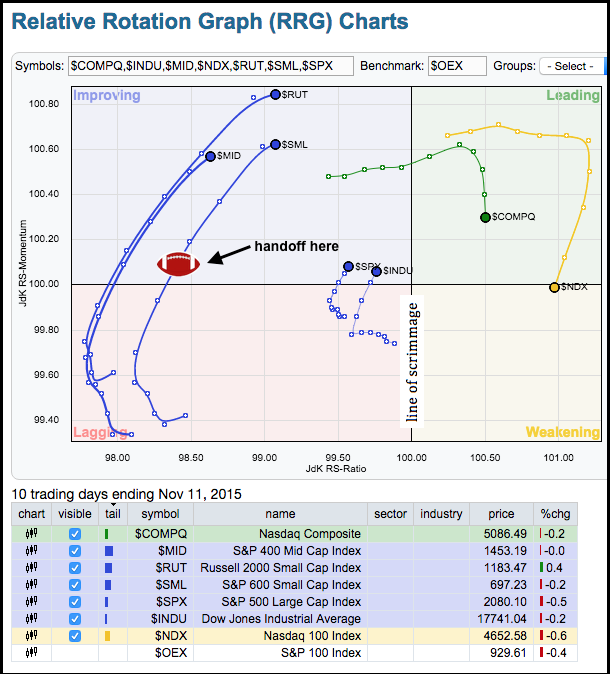
Small-caps Attempting an End-Around on the RRG
by Arthur Hill,
Chief Technical Strategist, TrendInvestorPro.com
Small-caps are still underperforming large-caps, but the small and mid-cap indices moved into the improving quadrant on the Relative Rotation Graph (RRG) with a classic end-around play. Just go to YouTube if you need to review this play. The RRG shows performance for the S&P Small-Cap 600, Russell...
READ MORE
MEMBERS ONLY
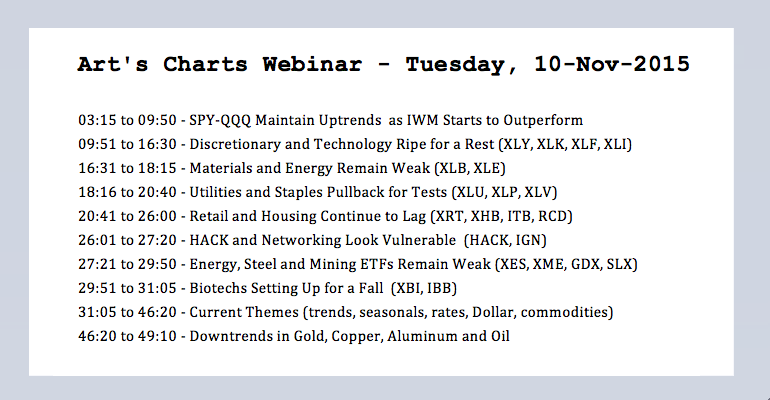
12 Themes Influencing the Markets -- Biotechs, Energy and Retail Look Vulnerable
by Arthur Hill,
Chief Technical Strategist, TrendInvestorPro.com
Pockets of Weakness Persist // SPY and QQQ Maintain Short-term Uptrends // IWM Starts to Outperform // XLY and XLK Ripe for a Rest // Materials and Energy Remain Weak // Retail and Housing Continue to Lag // HACK Looks Vulnerable // Oil & Gas Equip & Services SPDR Fall Short // Biotechs Setting Up for a Fall...
READ MORE
MEMBERS ONLY
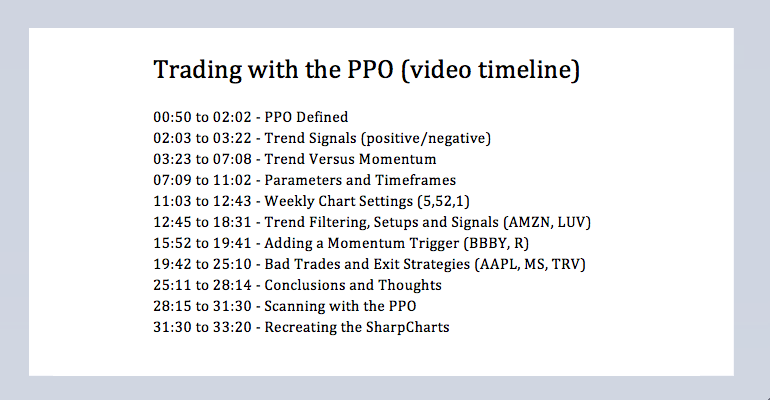
Trading with the PPO: Understanding the Mechanics, Using Trend Filters and Catching Momentum Swings
by Arthur Hill,
Chief Technical Strategist, TrendInvestorPro.com
PPO Defined // Trend Signals // Trend and Momentum // Parameters and Timeframes // Weekly Chart Settings // Trend Filtering, Setups and Signals // Adding a Momentum Trigger // Bad Trades and Exit Strategies // Conclusions and Thoughts // Scanning with the PPO // Recreating the SharpCharts ////
****************************************************************************
Trading with the PPO
Table of Contents
* What Exactly is...
READ MORE
MEMBERS ONLY
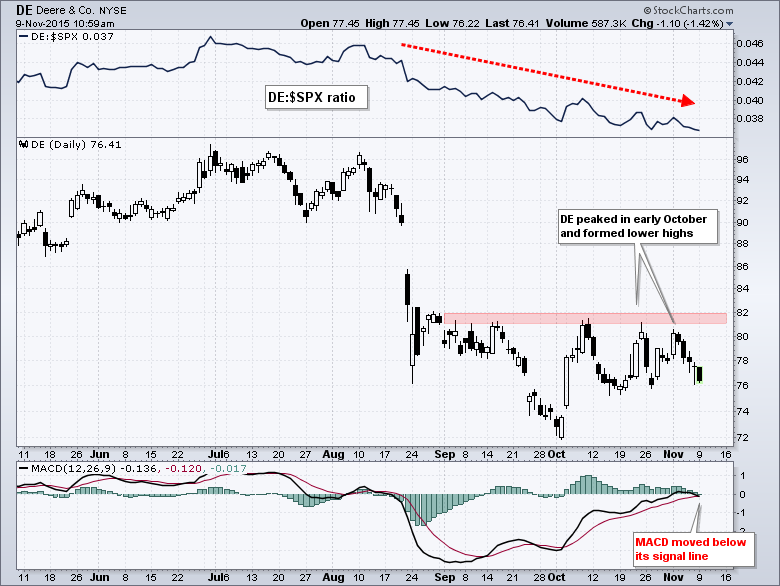
Momentum Turns Down on Deere
by Arthur Hill,
Chief Technical Strategist, TrendInvestorPro.com
Deere (DE) is not keeping pace with broader market and a bearish momentum signal just triggered. Deere was hit with the rest of the stock market in August and fell sharply. This was normal because the broad market was under intense selling pressure. The S&P 500 ultimately held...
READ MORE
MEMBERS ONLY
Using Correlations to Quantify the Effect of Rising Rates
by Arthur Hill,
Chief Technical Strategist, TrendInvestorPro.com
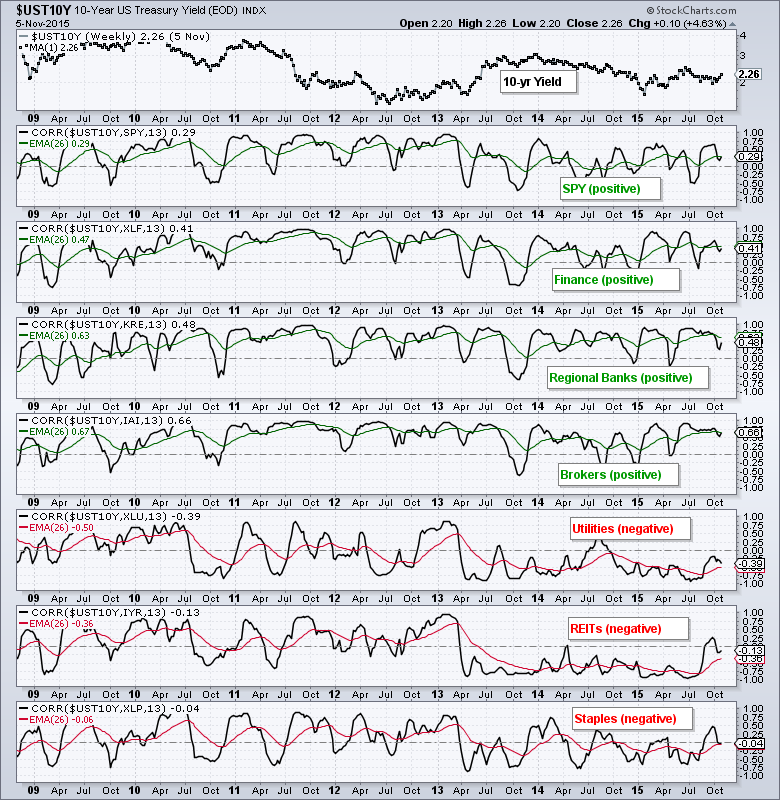
Chartists can use the Correlation Coefficient to understand the relationship between Treasury yields and certain groups, such as banks, utilities and REITs. The chart below shows the 10-year Treasury Yield ($UST10Y) in the main window and seven correlations in the indicator windows. I am using weekly data, a 13-week Correlation...
READ MORE
MEMBERS ONLY
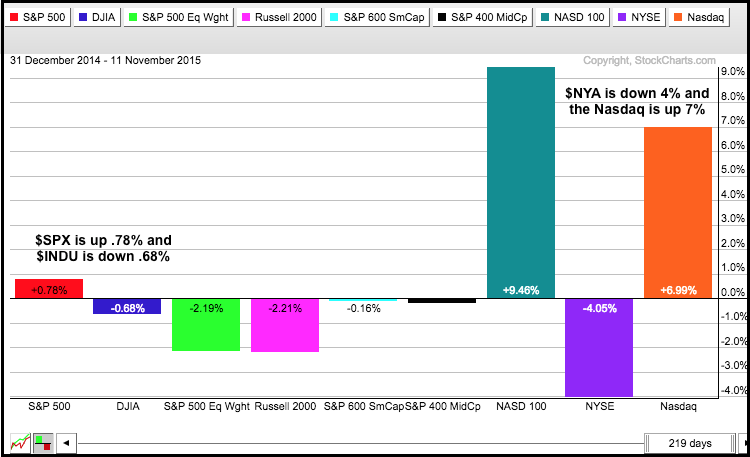
The State of the Market of Stocks -- A Market of Thirds
by Arthur Hill,
Chief Technical Strategist, TrendInvestorPro.com
The State of Stocks 2015 // Performance Metrics // $NDX has the Most Leaders // Choppy Upward Bias for SPX // Mid-caps Break Down into Thirds // Internal Divisions Weigh on Small-caps // A Sector, Industry Group and Stock Pickers Market // Friday Food for Thought ////
The State of Stocks in 2015
Today I am breaking down...
READ MORE
MEMBERS ONLY
How Might Rising Yields Affect Banks, Brokers, Utilities, Staples and Others?
by Arthur Hill,
Chief Technical Strategist, TrendInvestorPro.com
Holding Patterns for QQQ and SPY // XLY and XLK Remain the Leaders // Utilities Hit Make-or-break Level // 10-yr Yield is on the Verge // How Will Rising Yields Affect Other Groups? // Media Stocks Get Pummeled // Housing Stocks Still Trending Lower ////
Holding Patterns for QQQ and SPY
There is no change in the...
READ MORE
MEMBERS ONLY
Treasury Yields Surge Across the Board
by Arthur Hill,
Chief Technical Strategist, TrendInvestorPro.com
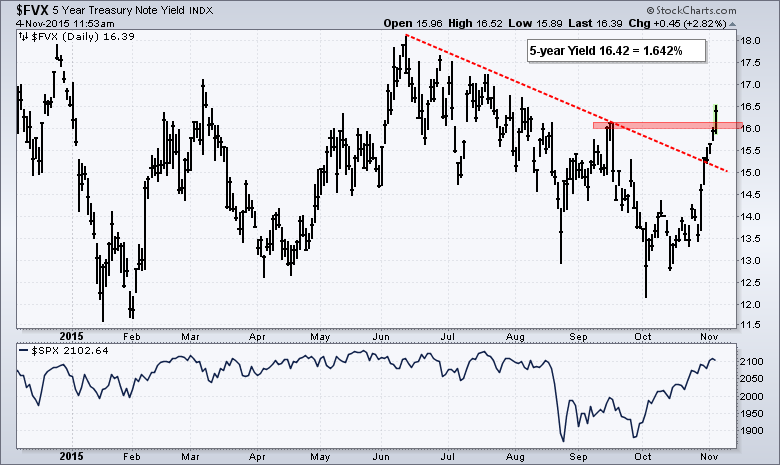
Short-term Treasury yields surged over the last six days and recent breakouts suggest that the Fed will raise short-term rates in December. Yes, it sounds blasphemous, but the bond market tends to lead the Fed in these matters. In fact, I would suggest that the bond market is the closest...
READ MORE
MEMBERS ONLY
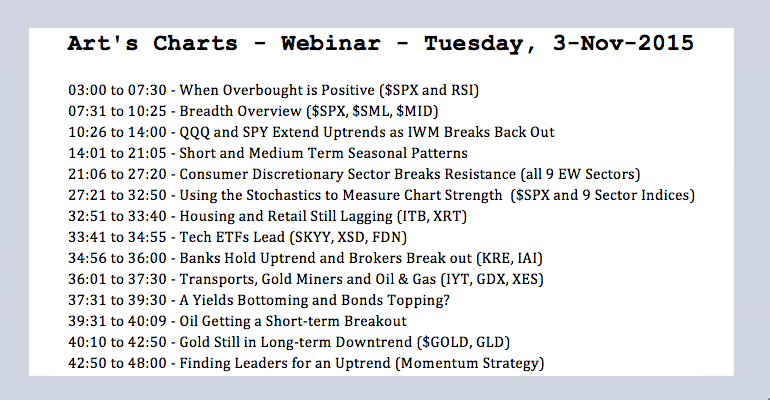
AD Line Hits New High -- When Overbought is Positive
by Arthur Hill,
Chief Technical Strategist, TrendInvestorPro.com
Highlights: AD Line Reflects Broad Market Strength // When Overbought is Positive // QQQ and SPY Extend Uptrends // IWM Breaks Back Out // Short and Medium Term Seasonal Patterns // Consumer Discretionary Sector Breaks Resistance // Housing and Retail Still Lagging // Oil Still Bearish // Webinar Highlights ////
AD Line Reflects Broad Market Strength
The broad market...
READ MORE
MEMBERS ONLY
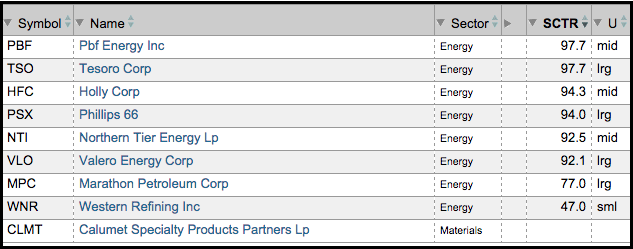
Phillips and Tesoro Lead CRAK with New Highs
by Arthur Hill,
Chief Technical Strategist, TrendInvestorPro.com
Refiner stocks are showing relative strength and absolute strength. The table below shows nine refiner stocks from the Oil Refiners ETF (CRAK). Eight of the nine are part of our StockCharts Technical Rank (SCTR) universe and six of the nine have SCTRs above 90. Calumet (CLMT) is a small-cap stock...
READ MORE
MEMBERS ONLY
Weighing the Evidence, Finding Leaders and Video
by Arthur Hill,
Chief Technical Strategist, TrendInvestorPro.com
Commentary Highlights: Bulk of the Evidence Is... // New Highs Outpace New Lows // Monthly S&P 500 Turns Bullish // Engulfings and Pullbacks in 2010 and 2011 // Consumer Discretionary Lags %Above 50-day // Finance and Tech Lead %Above 200-day // Russell 2000 Still Stalling // A Better Small-cap Index // Utilities Index Hits a Wall...
READ MORE
MEMBERS ONLY
50% is Enough for SPX -- Dollar Correlations in Play
by Arthur Hill,
Chief Technical Strategist, TrendInvestorPro.com
Commentary Highlights: QQQ and SPY Near Highs // End of Month Seasonality // Regional Banks Power Finance Sector // 50% Participation is Enough to Power SPX // Software and Internet Lead Techs // GDX Fails to Break Out // Palladium Corrects after Impulse Surge // Oil Gets Oversold Bounce // Dollar Gets a Breakout // Dollar-Commodity Correlations Come Into...
READ MORE
MEMBERS ONLY
The Squeeze is on for the 30-yr Yield and TLT
by Arthur Hill,
Chief Technical Strategist, TrendInvestorPro.com
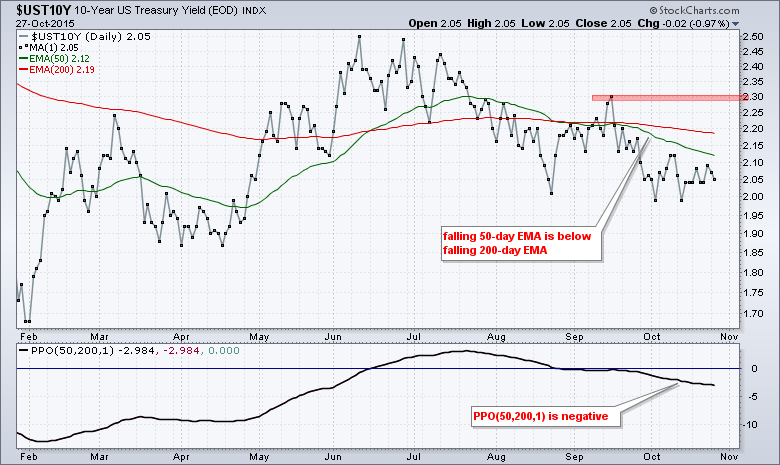
Treasury yields are in a clear downtrend since June, but a small anomaly is taking shape because the 30-year Treasury Yield ($UST30Y) did not confirm the lower low in the 10-year Treasury Yield ($UST10Y). The first chart shows the 10-yr yield peaking around 2.5% and falling towards the 2%...
READ MORE
MEMBERS ONLY
Housing-Retail Drag -- Regionals-Insurance Lead Finance -- Oil Weighs on XES and XLE -- GDX Struggles at Breakout
by Arthur Hill,
Chief Technical Strategist, TrendInvestorPro.com
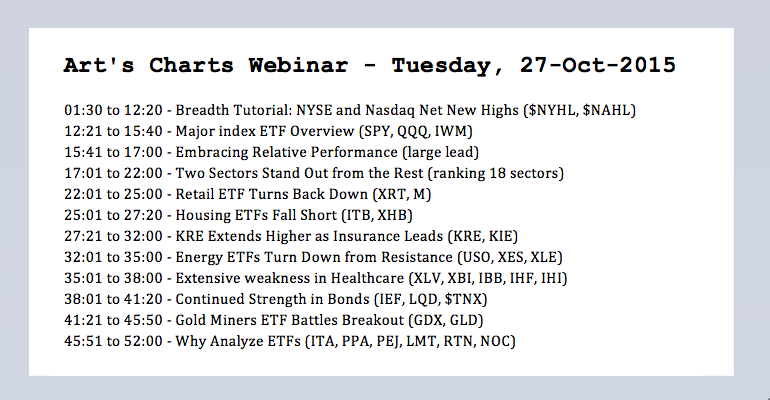
Embracing Relative Performance
There is really only one thing to do with relative performance metrics: embrace them. If large-caps are outperforming small-caps, then favor large-caps over small-caps. If the consumer staples sector is outperforming the consumer discretionary sector, then favor consumer staple stocks over consumer discretionary stocks. Following relative strength...
READ MORE
MEMBERS ONLY
NYSE Net New Highs Expand, but is it Enough?
by Arthur Hill,
Chief Technical Strategist, TrendInvestorPro.com
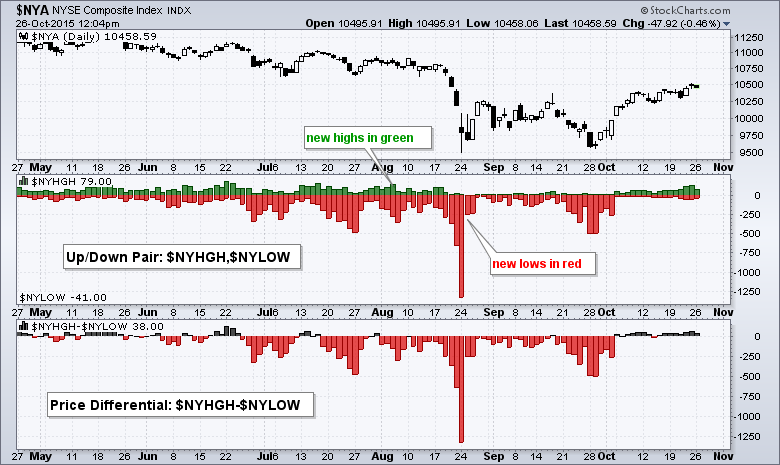
The percentage of NYSE net new highs remains at relatively low levels and chartists should watch this indicator for clues on follow through to the October surge. StockCharts users can plot new highs and new lows using SharpCharts. The first chart shows NYSE New 52-week Highs ($NYHGH) and NYSE New...
READ MORE
MEMBERS ONLY
The Power of Trend -- PPO Saves the Shorts -- Bullish Pattern in IWM -- Gold Corrects
by Arthur Hill,
Chief Technical Strategist, TrendInvestorPro.com
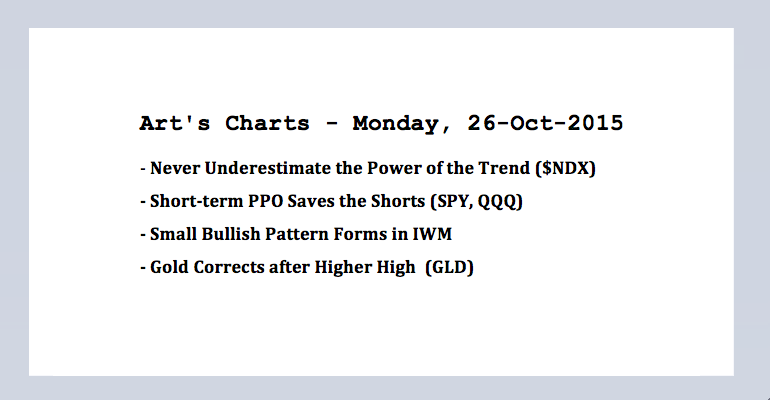
Never Underestimate the Power of the Trend
An important change occurred over the last two weeks as the overall market environment moved from bearish to bullish. The weekly trend for the Nasdaq 100 turned back up on October 9th and the weekly trend for the S&P 500 turned...
READ MORE
MEMBERS ONLY
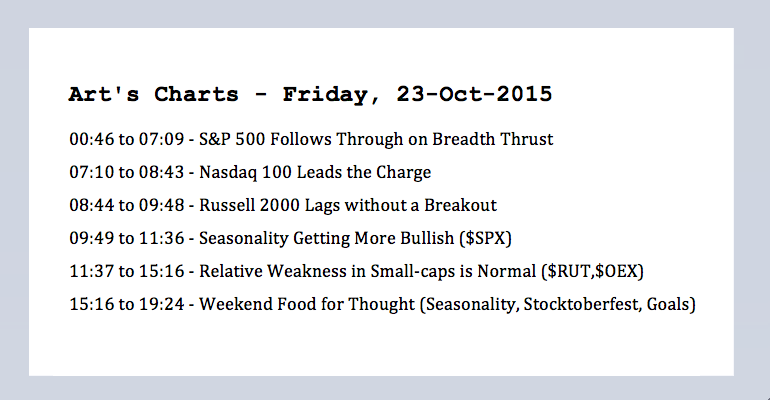
SPX Follow Thru -- NDX Leadership -- Seasonal Pattens in Play -- Small-Caps Lag, but this is Normal -- Weekend Reading
by Arthur Hill,
Chief Technical Strategist, TrendInvestorPro.com
Even though indicators help us quantify price action and add an objective aspect to our analysis, we must still study the price chart and analyze the price action. For example, it looks like the long-term uptrend is resuming for the S&P 500, but some of the price indicators...
READ MORE
MEMBERS ONLY
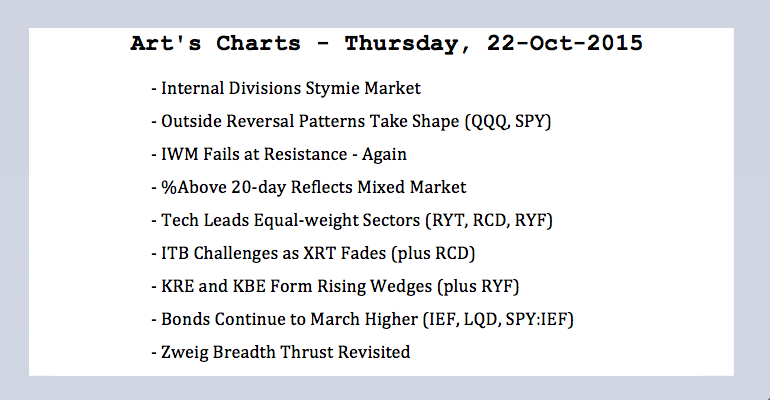
Internal Divisions -- QQQ and SPY vs IWM and MDY -- Retail Retreats -- Wedges for Regionals -- Stocks Outperform Bonds
by Arthur Hill,
Chief Technical Strategist, TrendInvestorPro.com
Internal Divisions Stymie Market
It is still a tale of two markets. Within the broader stock market, large-caps and large-techs are holding up well, but small-caps and mid-caps are dragging their feet. At the sector level, the Consumer Discretionary SPDR shows relative strength because its top holdings are performing well,...
READ MORE
MEMBERS ONLY
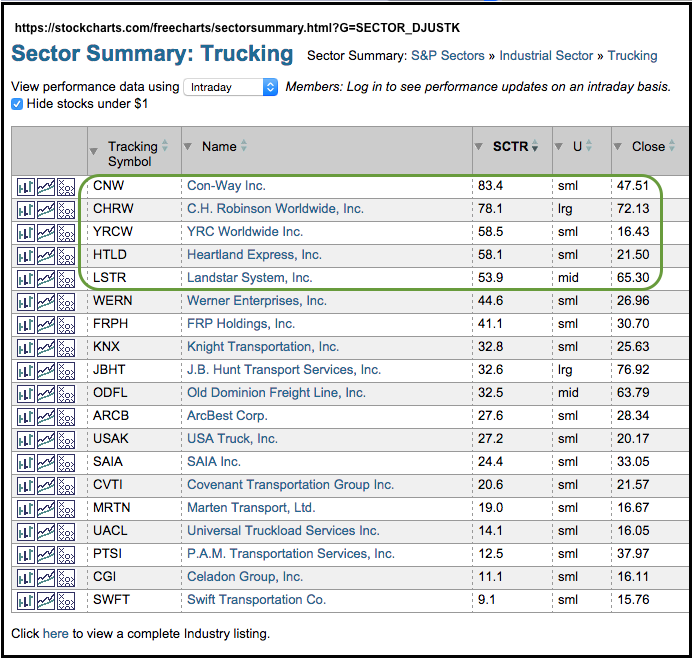
CH Robinson Leads Trucking as Heartland Bases
by Arthur Hill,
Chief Technical Strategist, TrendInvestorPro.com
It has been a rough year for trucking stocks and most of these stocks are lagging the broader market. A look at the trucking stocks from the Sector Summary shows a handful with SCTRs above 50. The vast majority of SCTRs are 50. The SCTR is the StockCharts Technical Rank...
READ MORE
MEMBERS ONLY
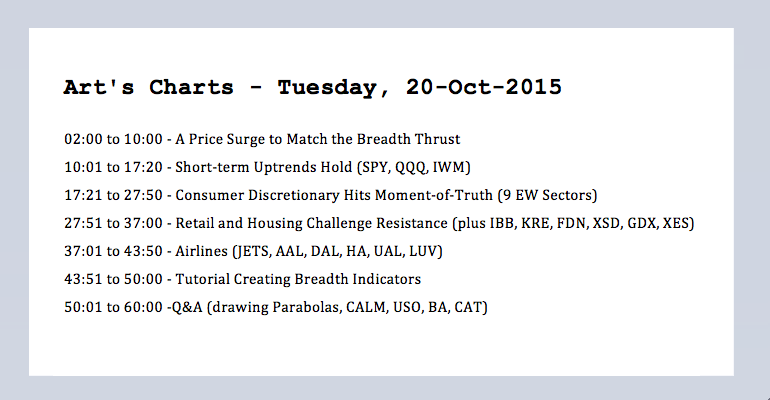
Prior Price Surges in $SPX -- ST Uptrends Hold -- Retail and Housing Challenge Resistance
by Arthur Hill,
Chief Technical Strategist, TrendInvestorPro.com
A Price Surge to Match the Breadth Thrust
It has been one heck of a three week period. SPY is up around 8%, QQQ is up around 9% and the Russell 2000 iShares (IWM) is up around 7.5%. There are, of course, two ways to interpret these price surges....
READ MORE
MEMBERS ONLY
Small-caps and Retailers Lag, but Semis Take the Lead
by Arthur Hill,
Chief Technical Strategist, TrendInvestorPro.com
It has been a rough two and a half months for the stock market with a major segment underperforming and one key industry group lagging. Semiconductors, however, are emerging as leaders within the technology sector. The major index ETFs are all down since the end of July with the S&...
READ MORE
MEMBERS ONLY
QQQ and SPY Maintain Uptrends -- Can we Ignore Breadth and Volume Thrusts?
by Arthur Hill,
Chief Technical Strategist, TrendInvestorPro.com
I am starting to entertain the idea that the surge from late September to mid October was strong enough to negate the August breakdowns in SPY and QQQ. The bounce over the last few weeks contained strong breadth and strong upside volume. Also notice that SPY broke above the mid...
READ MORE
MEMBERS ONLY
A Tale of Two Consumer Discretionary Sectors
by Arthur Hill,
Chief Technical Strategist, TrendInvestorPro.com
Large caps continue to outperform "other" caps and this has created a performance discrepancy within the consumer discretionary sector. I am highlighting this sector because it is the most economically sensitive sector and includes many domestically focused industry groups, including retail, restaurant, media and home construction. The first...
READ MORE
MEMBERS ONLY
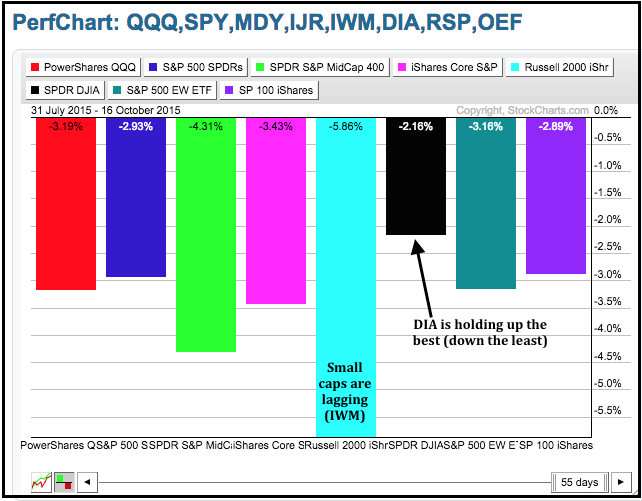
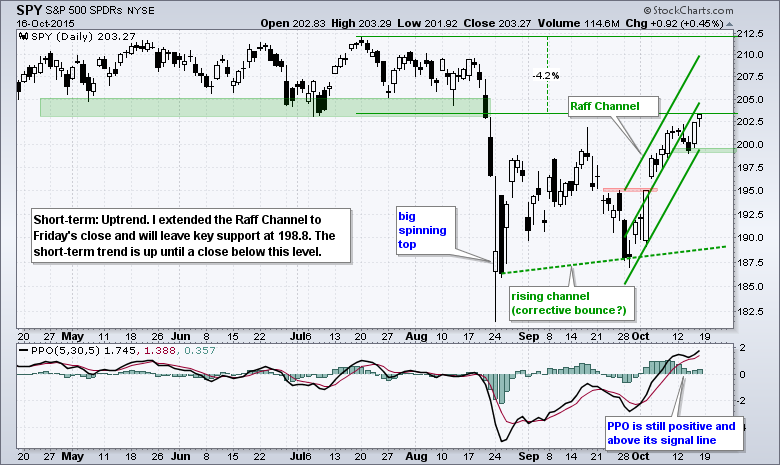
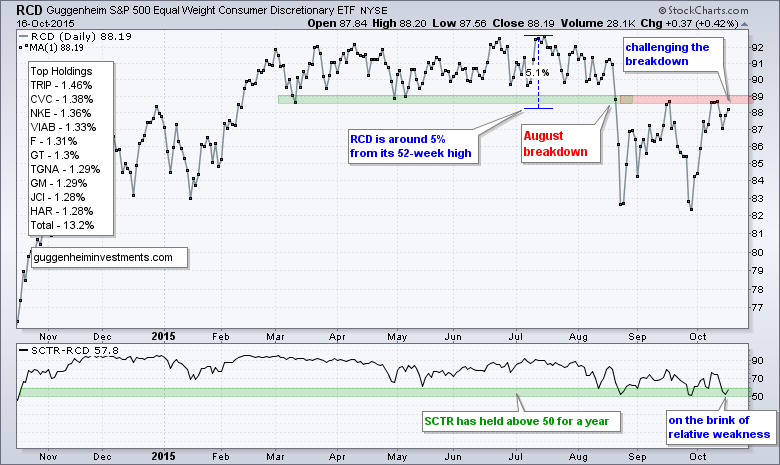
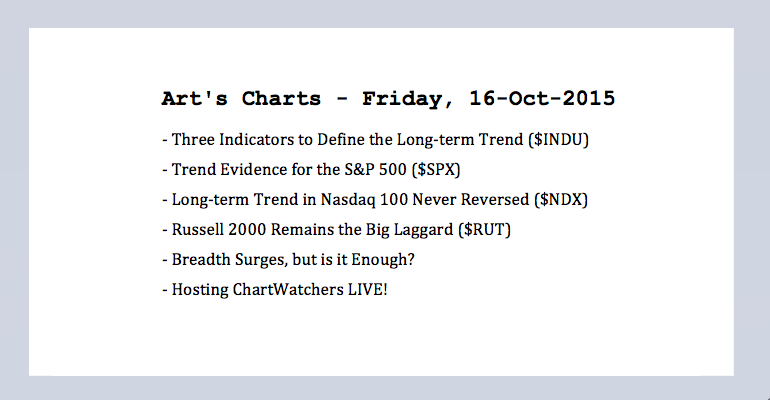
Defining the Trend -- $SPX Challenges Downtrend -- $NDX Never Reversed -- $RUT Lags -- About That Breadth Surge
by Arthur Hill,
Chief Technical Strategist, TrendInvestorPro.com
Today I will start with weekly charts for the S&P 500, Nasdaq 100 and Russell 2000, or the big three as I call these major stock indices. One remains in an uptrend, one is close to reversing its downtrend and one remains in a clear downtrend. I am...
READ MORE