MEMBERS ONLY
QQQ Holds Gap -- Small Cap Breadth Triggers -- Retail-Housing Weaken -- Banks-Brokers Break -- XSD, AAPL and more
by Arthur Hill,
Chief Technical Strategist, TrendInvestorPro.com
Stalling and not Really Falling (Yet)
Looking at the big three major index ETFs, two of the three are still short-term bullish and have yet to break down. QQQ stalled with some serious indecision the last four days. SPY is down about 1% the last two days, but remains above...
READ MORE
MEMBERS ONLY
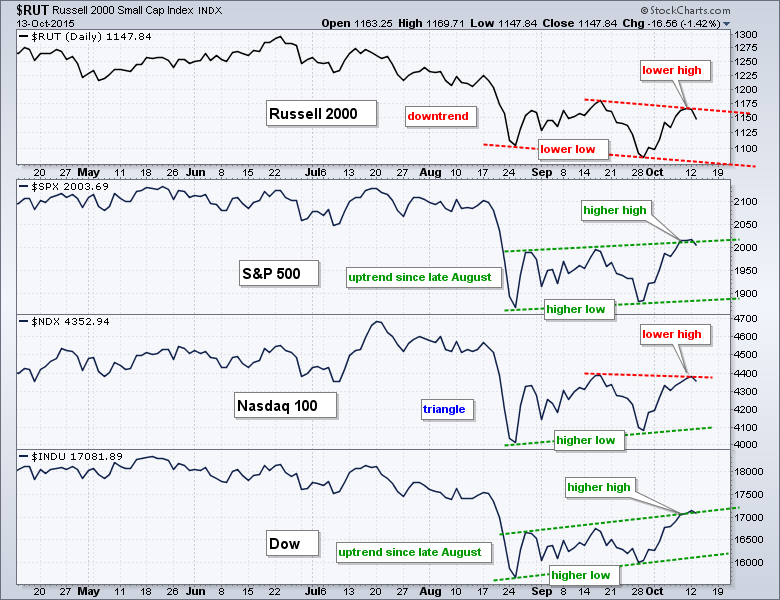
Small Caps and Large Techs Are Lagging
by Arthur Hill,
Chief Technical Strategist, TrendInvestorPro.com
Price action has been rather volatile since the August breakdown, but some performance discrepancies are emerging in October and these could foreshadow broad market weakness. The chart below shows the Russell 2000, S&P 500, Nasdaq 100 and Dow Industrials, all on one chart for easy comparison. First, notice...
READ MORE
MEMBERS ONLY
Small-caps Show Weakness -- Swing within the Channel -- ABC, Wave 2 and Short SPX -- Short-term Breadth
by Arthur Hill,
Chief Technical Strategist, TrendInvestorPro.com
Small-caps Show Relative Weakness
After stalling for two days, the major index ETFs moved lower on Tuesday with the Russell 2000 iShares (IWM) leading the way. Small-caps were lagging in September and they continue to lag in October. While SPY and QQQ managed to exceed their mid September highs, IWM...
READ MORE
MEMBERS ONLY
Narrow Ranges -- QQQ Gap -- Gold Resistance -- Zweig Breadth Thrust
by Arthur Hill,
Chief Technical Strategist, TrendInvestorPro.com
Stymied Indexes Form Narrow Range Days
Stocks stalled on Monday with mixed action in the major index ETFs. Stalling or sideways price action reflects a stand-off between bulls and bears (buying pressure and selling pressure). Note that the price range over the last two trading days has also been extremely...
READ MORE
MEMBERS ONLY
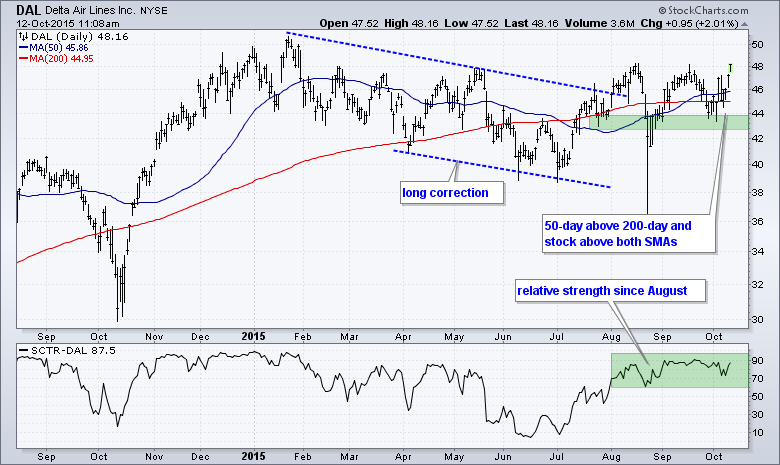
Delta and SouthWest Go For Breakouts
by Arthur Hill,
Chief Technical Strategist, TrendInvestorPro.com
Airline stocks are on the move Monday with nice gains across the board. Hawaiian Airlines (HA) and Skywest (SKYW) are leading the way with breakouts and 52-week highs today. These two have the highest StockCharts Technical Rank (SCTR) of the group and are clearly the strongest of the pack. There...
READ MORE
MEMBERS ONLY
Up Big, but Still Down -- Raff Channels Define Trend -- Finance and Utilities Lag -- Banking ETFs Form Bearish Candles
by Arthur Hill,
Chief Technical Strategist, TrendInvestorPro.com
The major index ETFs are nearing their moment-of-truth as the smaller uptrends start to challenge the bigger downtrends. I am still assuming that the August breakdowns signaled the start of a bigger downtrend. While I do not know how long this downtrend will last, I have yet to get a...
READ MORE
MEMBERS ONLY
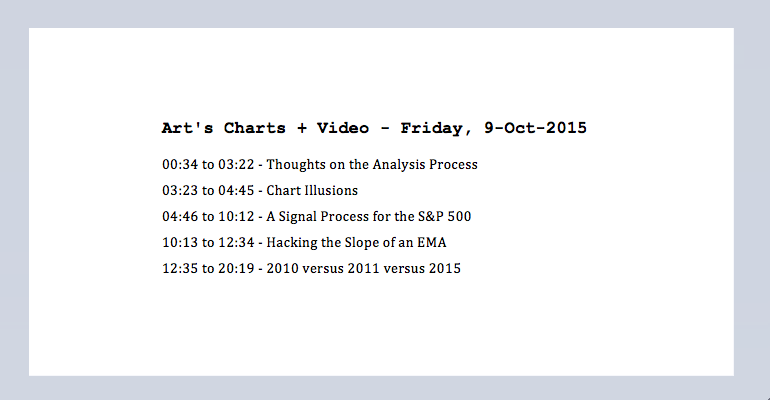
Thoughts on the Analysis Process -- A Signal Process for the S&P 500 -- Hacking the Slope of an EMA -- 2010 versus 2011 versus 2015
by Arthur Hill,
Chief Technical Strategist, TrendInvestorPro.com
Before looking at some charts to establish the bigger trend, I would like to philosophize a little on the analysis process and my approach. I use basic chart analysis and some simple trend-following indicators to define the trend and trade accordingly. My main goal is to be as OBJECTIVE as...
READ MORE
MEMBERS ONLY
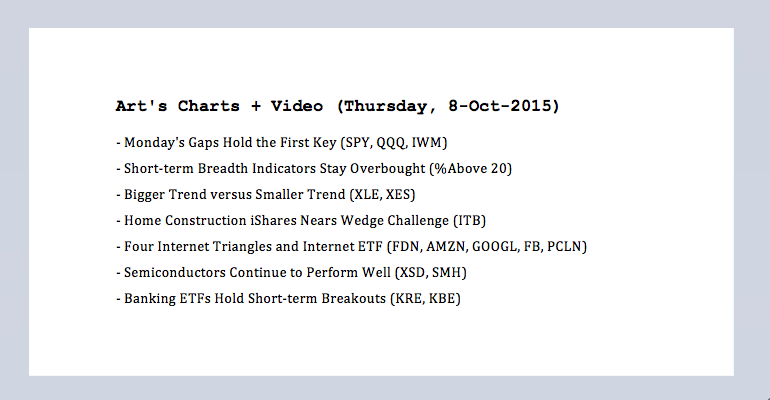
Minding Monday's Gap -- Short-Term Breadth -- Bigger Trend versus Smaller Trend -- Banks Strengthen
by Arthur Hill,
Chief Technical Strategist, TrendInvestorPro.com
Monday's Gaps Hold the First Key
I am still working under the assumption that bigger trend is down after the August break down. Furthermore, SPY and QQQ are in the midst of counter trend moves denoted by a rising channel. The channel lines are based on the closing...
READ MORE
MEMBERS ONLY
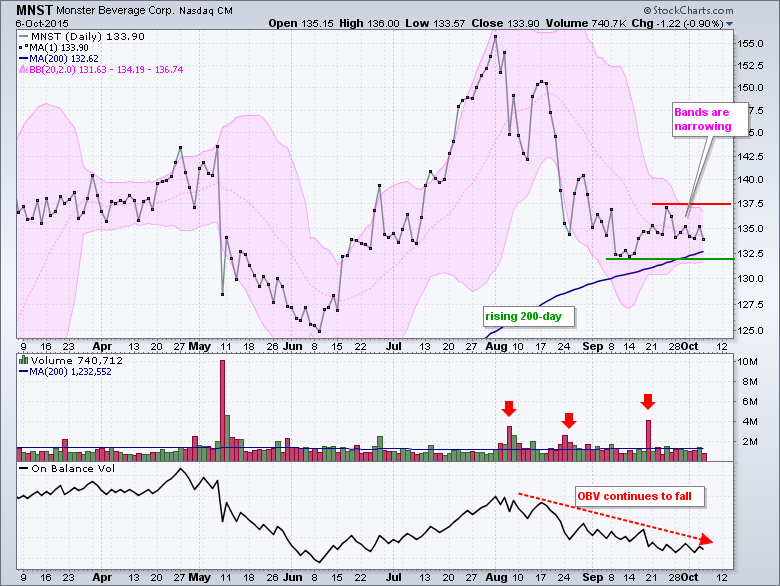
Monster Beverage Loses Energy as Bands Narrow
by Arthur Hill,
Chief Technical Strategist, TrendInvestorPro.com
Monster Beverage (MNST) did not partake in the early October surge and a key volume indicator suggests that distribution is underway. Let's start with the price chart. MNST fell sharply in August and then firmed just above the rising 200-day moving average in September. Volatility contracted as the...
READ MORE
MEMBERS ONLY
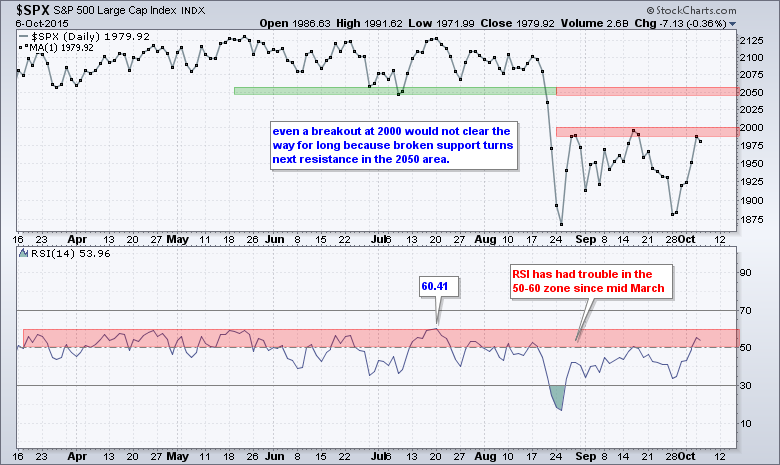
Rock and Hard Place for $SPX -- ST Breadth Becomes Overbought -- 5 Bearish Setups -- 5 Bullish Setups
by Arthur Hill,
Chief Technical Strategist, TrendInvestorPro.com
Overall, the major index ETFs remain in no man's land. Put another way, the market is between a rock (bigger downtrend) and a hard place (smaller uptrend). The bigger trend turned down with the August breakdown and broken resistance represents the rock around 2050. Short-term, the S&...
READ MORE
MEMBERS ONLY
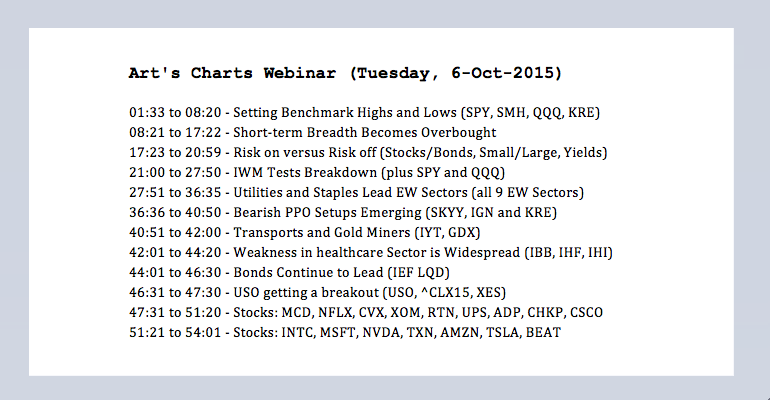
No Man's Land -- IWM Challenges Breakdown -- Staples and Utilities Lead -- Webinar Recording
by Arthur Hill,
Chief Technical Strategist, TrendInvestorPro.com
Welcome to No Man's Land
After months of dull trading, the stock market turned into Thrillsville in late August and volatility has continued into early October. This volatility is reminiscent of the periods from June to August 2010 and from early August to early October 2011. It took...
READ MORE
MEMBERS ONLY
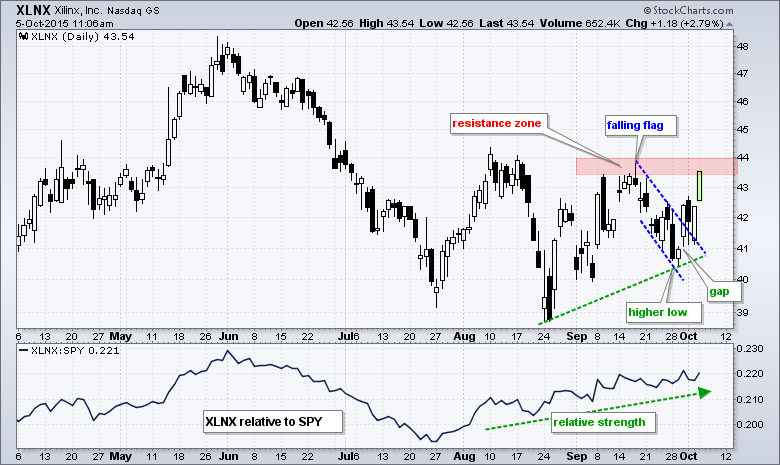
Xilinx Holds the Gap and Shows Relative Strength
by Arthur Hill,
Chief Technical Strategist, TrendInvestorPro.com
Stock market declines are good because they expose the weak hands and highlight potentially strong stocks. Stocks that hold up during a broad market decline show relative strength and this could lead to outperformance when the market turns up again. Xilinx (XLNX) is one such stock because it held up...
READ MORE
MEMBERS ONLY
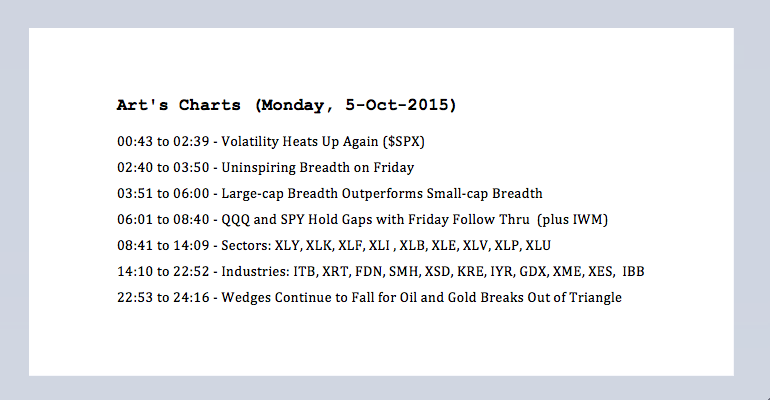
Volatility Heats Up -- Uninspiring Breadth -- QQQ and SPY Hold Gaps -- XLE Breaks Out -- Semis Lead Tech -- Oil and Gold
by Arthur Hill,
Chief Technical Strategist, TrendInvestorPro.com
Note that I will post a video around 10AM ET. Volatility is clearly heating up as the S&P 500 completed its fifth 3+ percent swing since the August closing low. That is almost one 3+ percent swing per week (based on closing prices). With a 3.7% surge...
READ MORE
MEMBERS ONLY
Is RSI Foreshadowing a Tradable Low in the Oil & Gas Equipment & Services SPDR?
by Arthur Hill,
Chief Technical Strategist, TrendInvestorPro.com
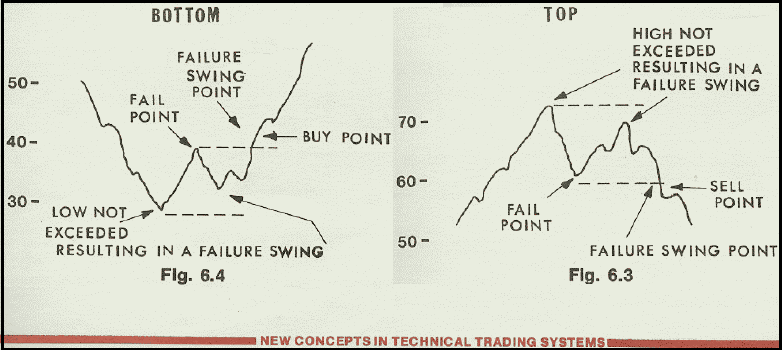
The Oil & Gas Equip & Services SPDR (XES) perked up on Friday with a massive engulfing pattern on high volume. Combined with a bullish failure swing in RSI, the ETF could be setting up for a tradable low.
Created by Welles Wilder, the Relative Strength Index (RSI) is a...
READ MORE
MEMBERS ONLY
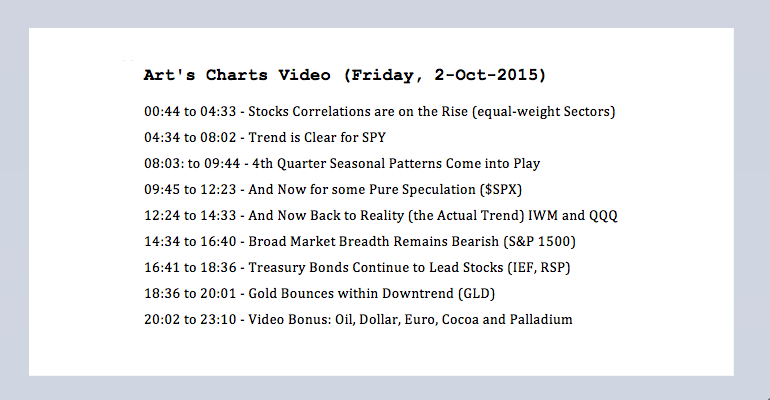
Correlations Rise -- $SPX and Seasonals -- Big Three Down -- Bonds Rule -- Gold Bounces
by Arthur Hill,
Chief Technical Strategist, TrendInvestorPro.com
Note that I will add a video around 11AM ET. Stock futures were higher before the employment report and then moved sharply lower after non-farm payrolls came in below expectations. Bonds are moving higher and the 10-YR Treasury Yield ($TNX) fell below 2%. The decline in stocks and rise in...
READ MORE
MEMBERS ONLY
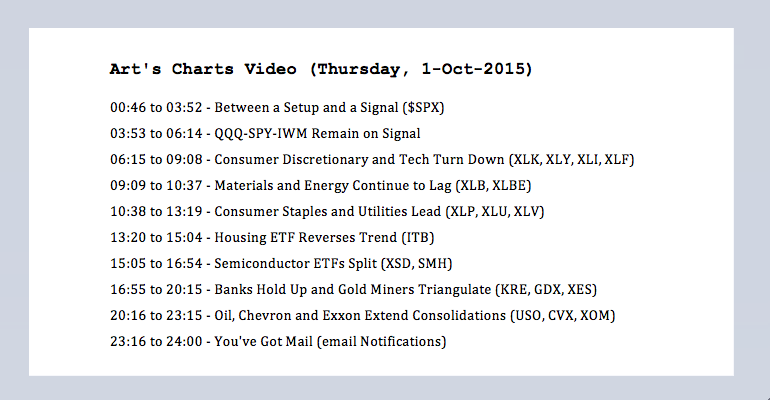
Between Setup and Signal -- Staples-Utilities Lead -- ITB Reverses Trend -- Semis Split -- Oil Firms in Retracement Zone -- Video
by Arthur Hill,
Chief Technical Strategist, TrendInvestorPro.com
Between a Setup and a Signal
Note that I will post a video around 10AM ET. Trends are the driving force, signals are the exception and no-man's land is the norm. What the heck does that mean? First, the bigger trend is the driving force in my trading...
READ MORE
MEMBERS ONLY
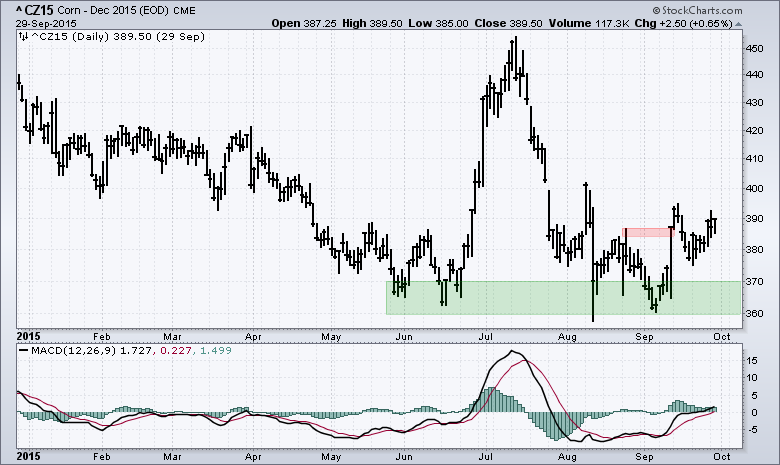
Corn ETF Attempts to End Wave 2 Correction
by Arthur Hill,
Chief Technical Strategist, TrendInvestorPro.com
Corn is showing signs of firming near the June lows and a possible wave 2 could be ending for the Corn Trust ETF (CORN). I will first start with December Corn Futures (^CZ15) because this is the most widely traded instrument for corn. Note that StockCharts provides end-of-day (EOD) data...
READ MORE
MEMBERS ONLY
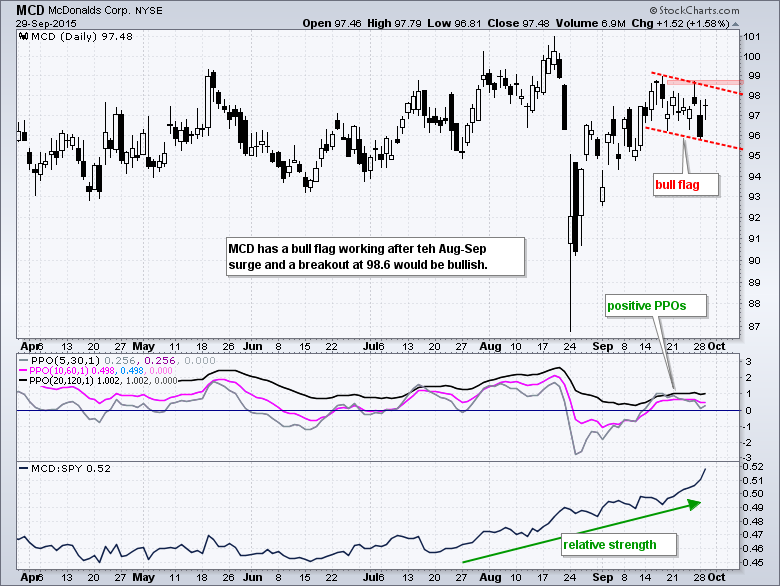
Ten Stocks Holding up Well over the last Two Months
by Arthur Hill,
Chief Technical Strategist, TrendInvestorPro.com
The medium-term and short-term trends for the major index ETFs are down, but there are some stocks holding up well over the last two months and I am highlighting ten today. The charts below extend six months with the PPOs in the first indicator window and the price relative in...
READ MORE
MEMBERS ONLY
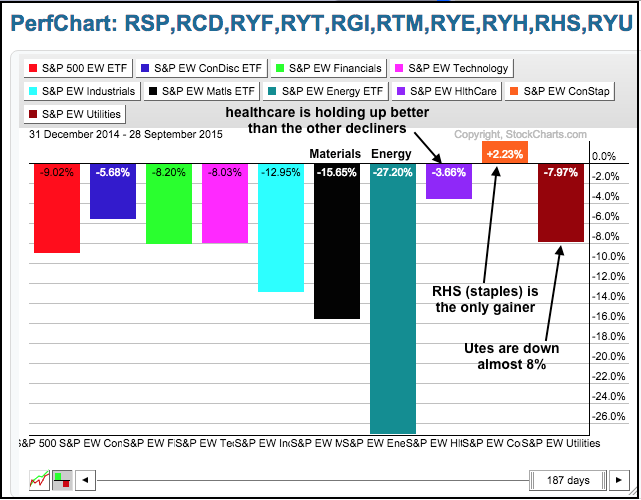
Cash Outperforms - Bond ETFs Struggle with Breakouts - Oil Firms Somewhat - Gold Hits Resistance
by Arthur Hill,
Chief Technical Strategist, TrendInvestorPro.com
Cash Outperforms Defensive Sectors
Correlations rise when the major stock indices are in downtrends. In addition, the deeper and sharper the decline, the higher the positive correlation among stocks. This means there are few places to hide when the stock market turns down. Healthcare, consumer staples and utilities are traditionally...
READ MORE
MEMBERS ONLY
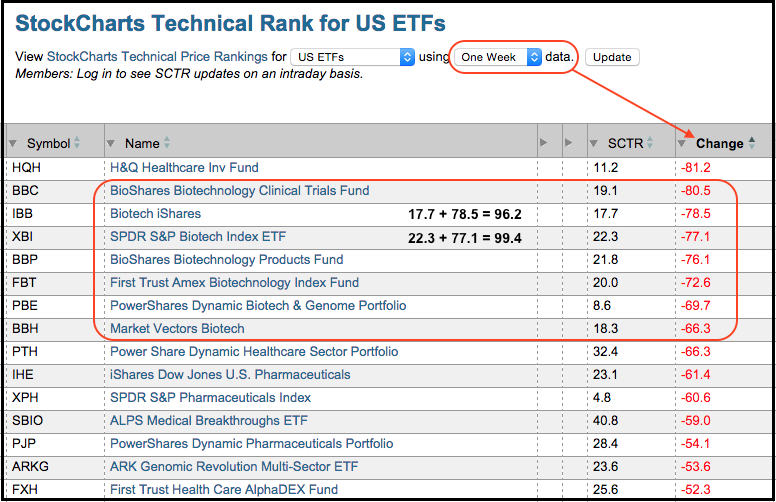
Biotech SCTRs Crater as XBI Breaks Neckline Support
by Arthur Hill,
Chief Technical Strategist, TrendInvestorPro.com
The biotech ETFs have gone from leaders to laggards as the StockCharts Technical Rank (SCTR) plunged double-digits over the past week. The image below shows the ETFs with the biggest decline in their SCTR over the past week. You can set the time period using the drop down at the...
READ MORE
MEMBERS ONLY
MT Breadth Stays Bearish - Follow Through to ST Signals -- Housing and Internet Look Vulnerable -- Video
by Arthur Hill,
Chief Technical Strategist, TrendInvestorPro.com
Bigger Trend and Breadth Remain Bearish
Programming note: I will add a video to this commentary by 10AM ET. Also note that I will not be doing a webinar on Tuesday, but will post a commentary. There is no change in the medium-term trends and indicators for the major index...
READ MORE
MEMBERS ONLY
Charts Worth Watching -- AMZN, AAPL, FB, NFLX, PANW, TASR, TSLA, UA, XOM and more
by Arthur Hill,
Chief Technical Strategist, TrendInvestorPro.com
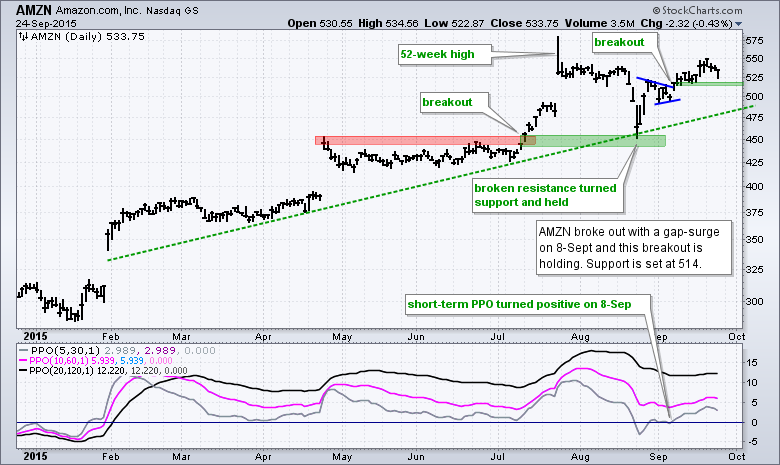
The next charts show mostly stocks in uptrends with recent breakouts. For example, AMZN broke out on September 8th and this breakout is holding. The ability to hold a breakout in a weak market shows both absolute and relative strength. There are two setups for stocks that are in downtrends...
READ MORE
MEMBERS ONLY
Volatility-Adjusted Channels - QQQ-SPY-IWM Firm in Gap Zone - XLK-XLY Hold Support - Economic Data Net Positive
by Arthur Hill,
Chief Technical Strategist, TrendInvestorPro.com
Using Volatility-Adjusted Channels
Note that I will be making a second post today with some individual stock charts (AMZN, AAPL, FB, NFLX, PANW, TASR, TSLA, UA, XOM and more). If you would like to receive email notifications when I post, check out the "yes" button at the bottom...
READ MORE
MEMBERS ONLY
Bearish Momentum Signals - Short S&P 500 ETF Signal -- Analyzing Short QQQ ETF - Stock Alternatives Strengthen
by Arthur Hill,
Chief Technical Strategist, TrendInvestorPro.com
Medium-term (MT), the major index ETFs are in downtrends after the August support breaks. In addition, the PPO (20,120,1) and PPO (10,60,1) are in negative territory to confirm these downtrends. Short-term (ST), the major index ETFs are mixed. IWM and SPY broke down this week and...
READ MORE
MEMBERS ONLY
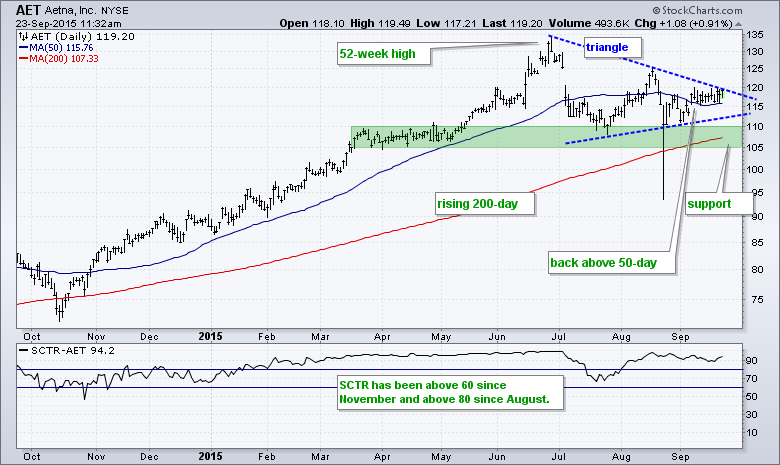
Aetna, I'm Glad I met Ya, and Your Chart
by Arthur Hill,
Chief Technical Strategist, TrendInvestorPro.com
In addition to this successful ad campaign, Aetna sports a bullish looking chart that argues for higher prices. First note that it has been a tough month for stocks with the S&P 500 down around 1.5% month-to-date. Aetna, in contrast, is holding up rather well and up...
READ MORE
MEMBERS ONLY
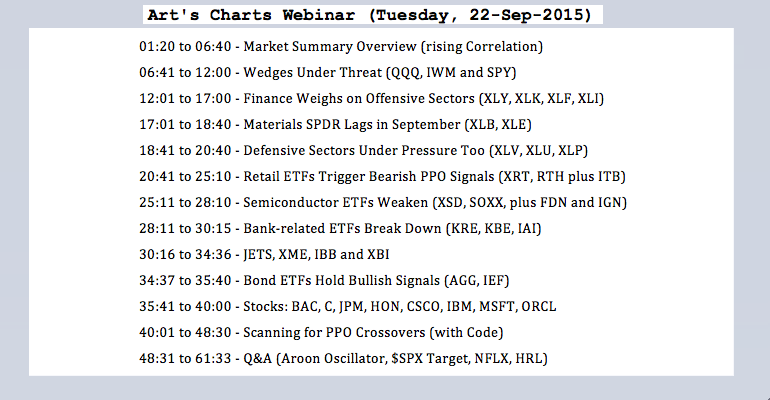
Wedges Under Threat -- Momentum Signals Trigger -- Banks Lead Lower - Webinar Recording
by Arthur Hill,
Chief Technical Strategist, TrendInvestorPro.com
With the Fed noise behind us, for the most part at least, we can now focus on some untainted price action to define trends in the stock market. I view this week as important because there is less noise and chartists should watch for a decisive move - one way...
READ MORE
MEMBERS ONLY
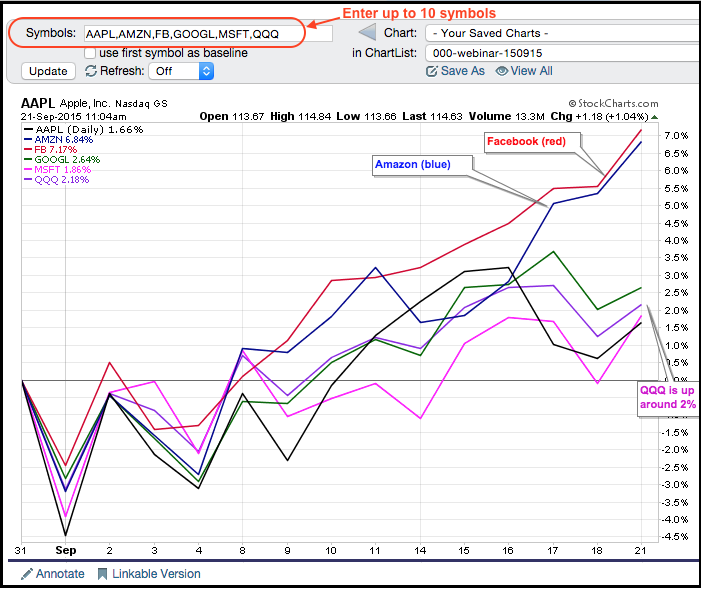
Facebook and Amazon Lead the Big Five
by Arthur Hill,
Chief Technical Strategist, TrendInvestorPro.com
There are lots of technology-consumer companies out there, but few are bigger than the big five: Apple, Amazon, Facebook, Google and Microsoft. While I am not sure if it is a zero-sum game for these behemoths, two are emerging as the leaders over the last few weeks. The SharpChart below...
READ MORE
MEMBERS ONLY
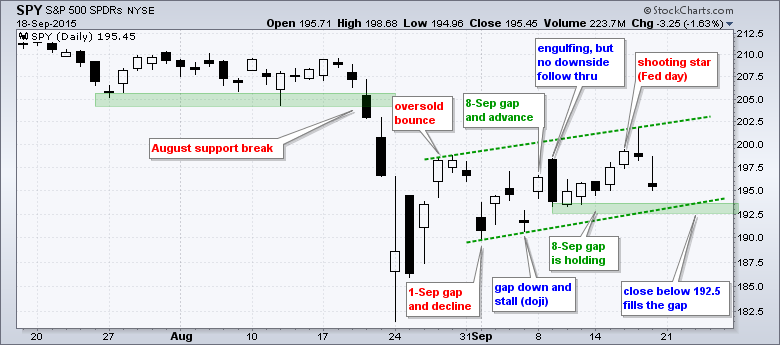
Stocks Wedges versus Noise -- Flags and Pennants in Energy
by Arthur Hill,
Chief Technical Strategist, TrendInvestorPro.com
Wedges are Still Rising - Despite the Noise
The stock market has certainly seen its fair share of noise in September. This noise includes the usual chatter from the talking heads and the Fed, as well as some volatile price action. Over the last 13 trading days, SPY gapped down...
READ MORE
MEMBERS ONLY
Battle of the Wedges - Stocks Versus Bonds
by Arthur Hill,
Chief Technical Strategist, TrendInvestorPro.com
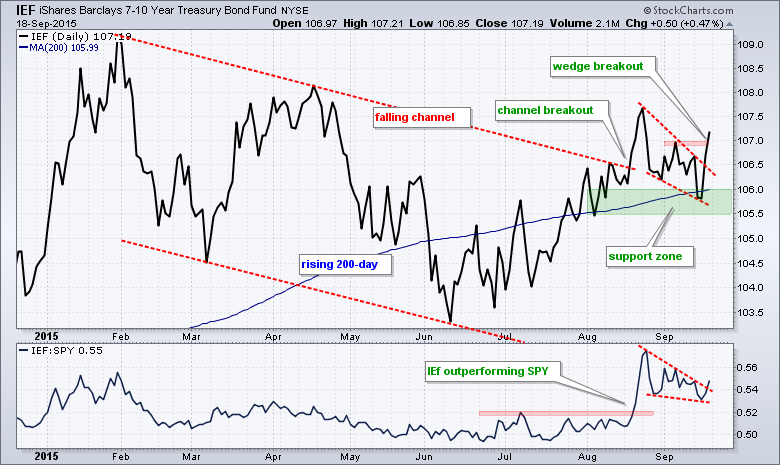
The S&P 500 SPDR (SPY) and the 7-10 YR T-Bond ETF (IEF) are going their separate ways as opposing wedges takes shape and IEF outperforms SPY (bonds outperform stocks). First, note that I am using close-only price charts to filter out some of the noise few weeks. This...
READ MORE
MEMBERS ONLY
Battle of the Wedges - Stocks Versus Bonds
by Arthur Hill,
Chief Technical Strategist, TrendInvestorPro.com
The S&P 500 SPDR (SPY) and the 7-10 YR T-Bond ETF (IEF) are going their separate ways as opposing wedges takes shape and IEF outperforms SPY (bonds outperform stocks). First, note that I am using close-only price charts to filter out some of the noise few weeks. This...
READ MORE
MEMBERS ONLY
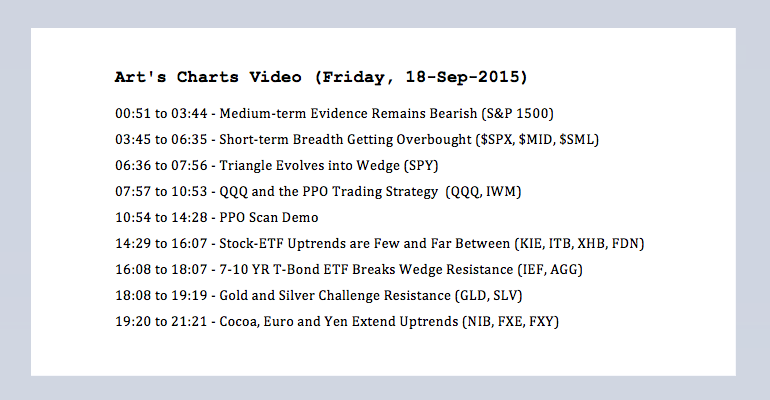
Weighing of the Evidence -- Triangle Evolves into Wedge -- ST Breadth Overbought -- Gold, Silver, Euro and Yen
by Arthur Hill,
Chief Technical Strategist, TrendInvestorPro.com
Medium-term Evidence Remains Bearish
Video will be posted around 11AM ET. The bulk of the medium-term evidence remains bearish for the stock market as a whole. I noted that a bullish breadth thrust occurred on Thursday. This thrust, however, was not confirmed by other breadth indicators - namely High-Low Percent....
READ MORE
MEMBERS ONLY
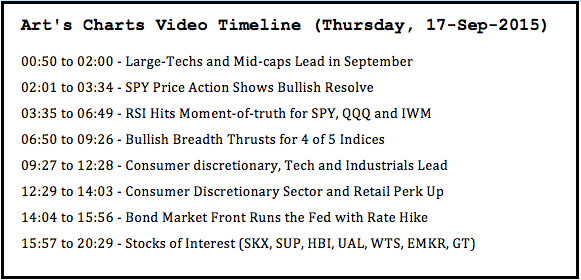
RSI Hits Moment of Truth, Retail Perks Up and Bond Market Front Runs the Fed
by Arthur Hill,
Chief Technical Strategist, TrendInvestorPro.com
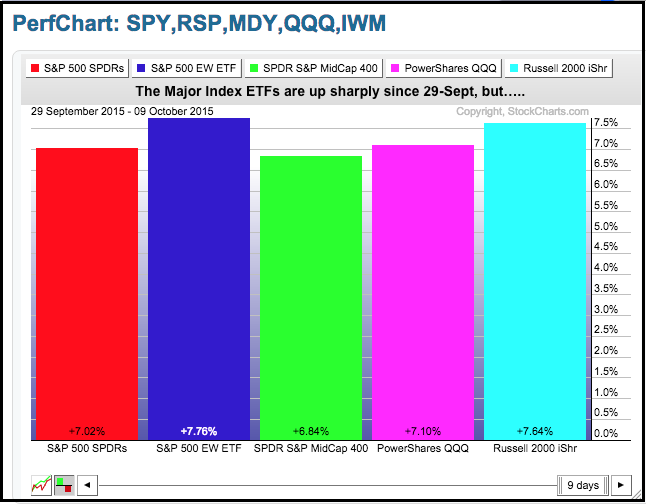
Large-Techs and Mid-caps Lead in September
The September bounce is shaping up rather nicely with the Nasdaq 100 and the S&P MidCap 400 leading the major indices. The PerfChart below shows the month-to-date performance for eight stock indices. The Nasdaq 100 is the clear leader with a 2....
READ MORE
MEMBERS ONLY
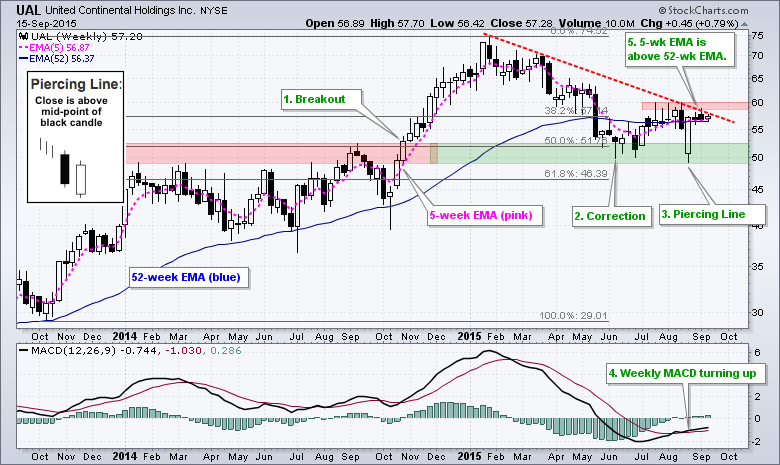
Is UAL Ready to Fly?
by Arthur Hill,
Chief Technical Strategist, TrendInvestorPro.com
The weekly chart for United Airlines (UAL) is looking bullish as the stock firms in a key retracement zone and weekly MACD turns up. The green text on the chart marks five technical features over the last 15 months. First, the stock broke out to new highs in October 2014....
READ MORE
MEMBERS ONLY
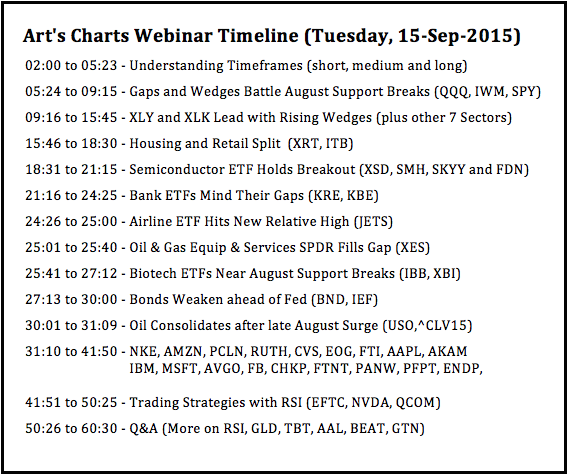
Gaps and Wedges Do Battle with August Support Breaks
by Arthur Hill,
Chief Technical Strategist, TrendInvestorPro.com
The major index ETFs remain in medium-term downtrends and short-term uptrends. Well, the short-term uptrend in SPY is up for debate because a triangle is taking shape. Nevertheless, SPY, QQQ and IWM gapped up last Tuesday and these gaps held for five days. We saw an intraday reversal on Wednesday...
READ MORE
MEMBERS ONLY
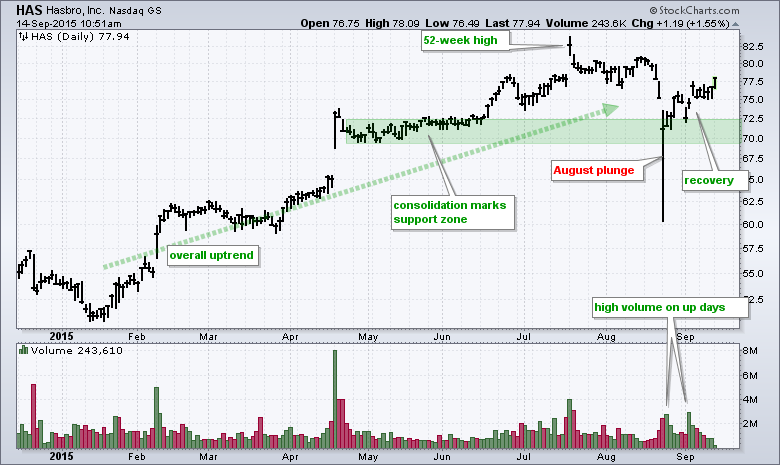
Hasbro: The Force is Strong on This One
by Arthur Hill,
Chief Technical Strategist, TrendInvestorPro.com
Star Wars fans may remember that quote from Darth Vader in Star Wars Episode IV (A New Hope). In any case, it came to mind when looking at the chart for Hasbro, which holds the merchandising rights for Star Wars toys. I see three reasons to be bullish on the...
READ MORE
MEMBERS ONLY
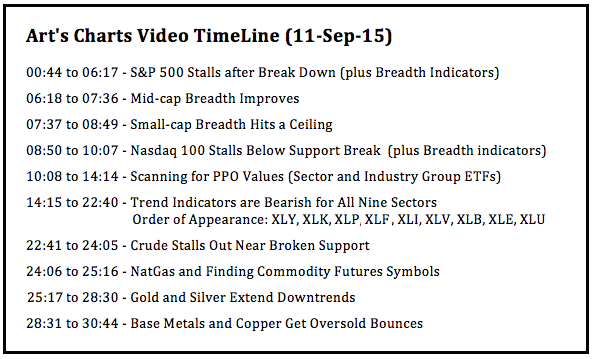
Breadth Indicator Overview, All 9 Sectors in Downtrends, Oil Hits Resistance, Gold and Silver Dull, Copper Leads Base Metals Bounce
by Arthur Hill,
Chief Technical Strategist, TrendInvestorPro.com
There is clearly a bearish headwind working against stocks right now. The major stock indices are in downtrends after their August support breaks, the key breadth indicators are bearish and all nine sectors are in downtrends. The image below shows the major indexes and their key breadth indicators. The boxes...
READ MORE
MEMBERS ONLY
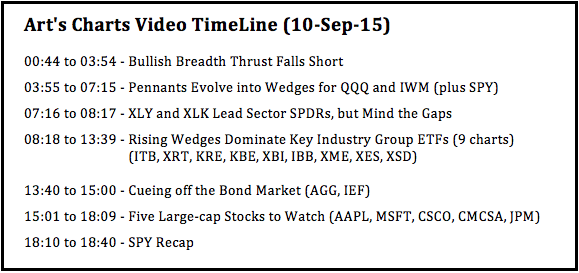
Bullish Breadth Thrust Falls Short -- Wedges Evolve as August Breaks Hold -- 5 Large-Caps to Watch
by Arthur Hill,
Chief Technical Strategist, TrendInvestorPro.com
Bullish Breadth Thrust Falls Short
Stocks surged on Wednesday's open, but quickly gave up these gains and declined into the close. Selling pressure was quite broad as AD Percent for the S&P 500 exceeded -80%. Small-caps held up better as S&P 600 AD Percent...
READ MORE
MEMBERS ONLY
Plotting the Nasdaq 100 Breakout on an Intraday Point & Figure Chart
by Arthur Hill,
Chief Technical Strategist, TrendInvestorPro.com
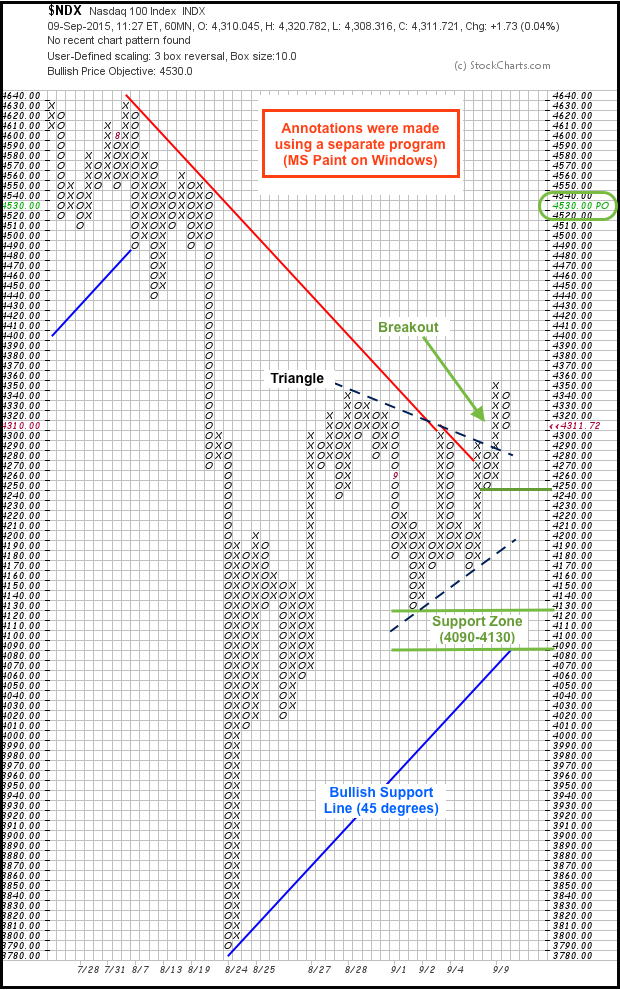
StockCharts users can create intraday P&F charts to shorten their time horizon and identify key levels to watch. The chart below is a 60-minute P&F chart with 10 points per box and a classic 3-box reversal. After plunging to 3790 in mid August, the Nasdaq 100...
READ MORE
MEMBERS ONLY
A Bullish Breadth Thrust in the Making - Index and Sector Breadth Overview
by Arthur Hill,
Chief Technical Strategist, TrendInvestorPro.com
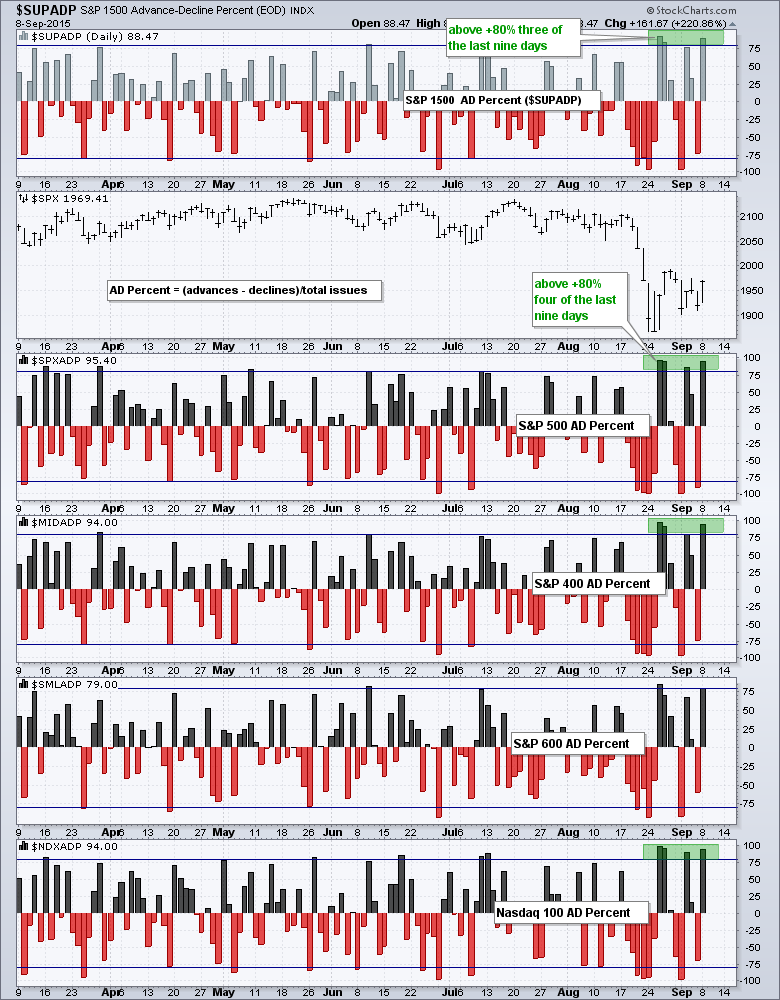
Breadth was exceptionally strong the last two weeks and the broad market indices are on the verge of a bullish breadth thrust. Despite a couple big down days last week, AD Percent for the major index ETFs put in four strong readings in the last nine trading days. Note that...
READ MORE
MEMBERS ONLY
August Break Downs Rule Medium-Term, but Bullish Pennants Shake Up the Short-Term - Webinar Recording
by Arthur Hill,
Chief Technical Strategist, TrendInvestorPro.com
Click here for the recording
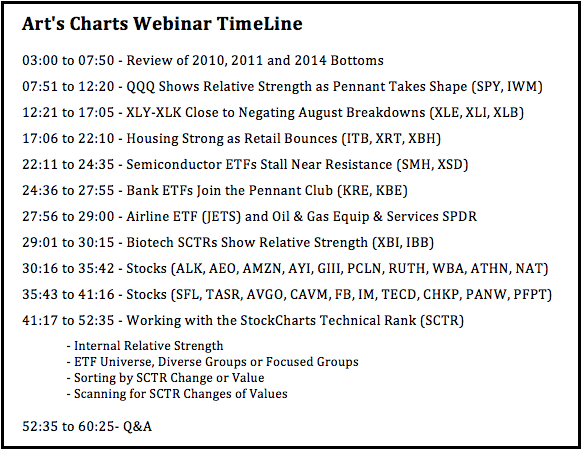
QQQ Shows Relative Strength as Pennant Takes Shape
There are two narratives at work in the stock market and these are reflected on the charts for QQQ, SPY and IWM. First, we have a big support break in August and this break down is medium-term...
READ MORE