MEMBERS ONLY
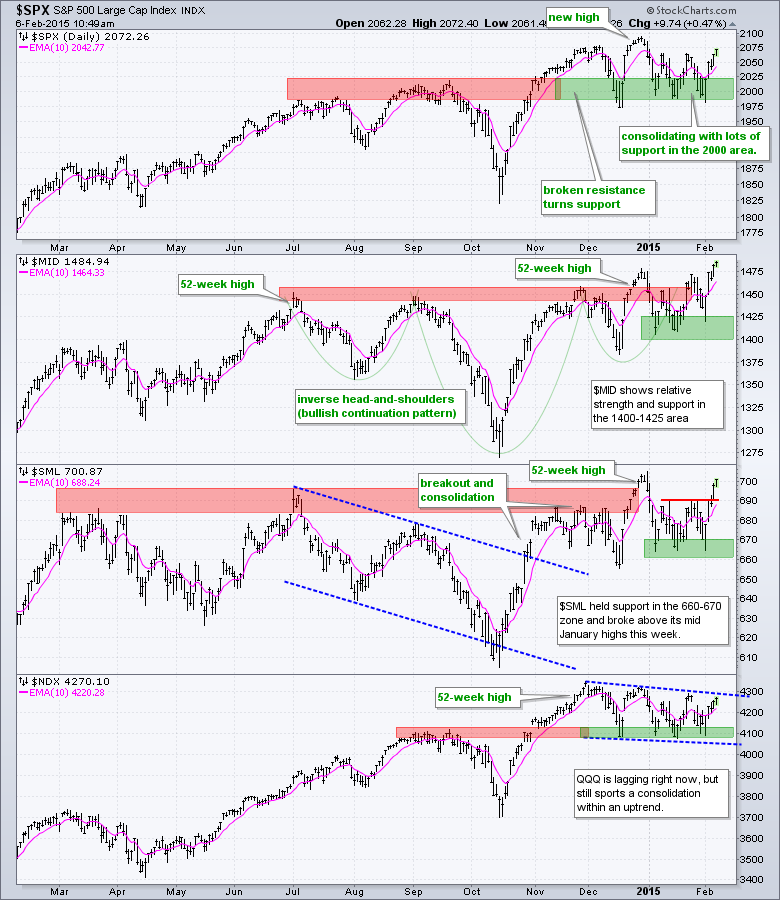
IWM Gets Breakout and Leads - QQQ Lags
by Arthur Hill,
Chief Technical Strategist, TrendInvestorPro.com
Stocks turned it around on Thursday with a strong open and strong close. The S&P 500 surged above 2055 on the open, held this surge and worked its way above 2065 by the close. This is positive price action, but the index remains well below Monday's...
READ MORE
MEMBERS ONLY
An Island Reversal for S&P MidCap SPDR
by Arthur Hill,
Chief Technical Strategist, TrendInvestorPro.com
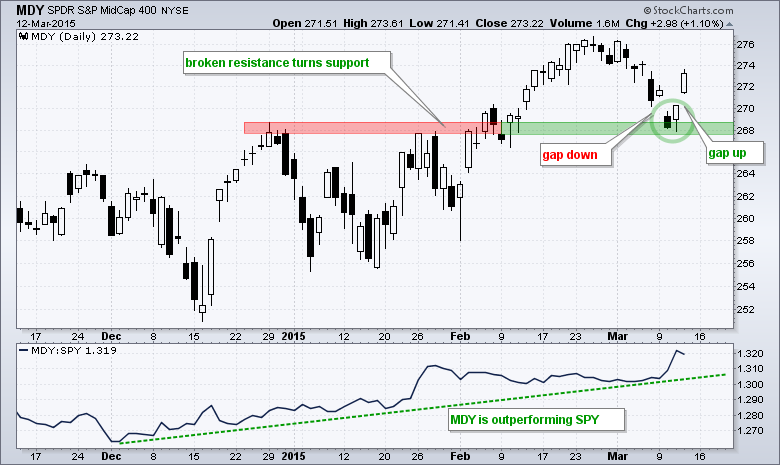
The S&P MidCap SPDR (MDY) fell to broken resistance with a gap down on Tuesday, firmed on Wednesday and gapped up on Thursday morning. The two gaps created a price "island" on Tuesday-Wednesday and an island reversal over the last four days. Notice that this island...
READ MORE
MEMBERS ONLY
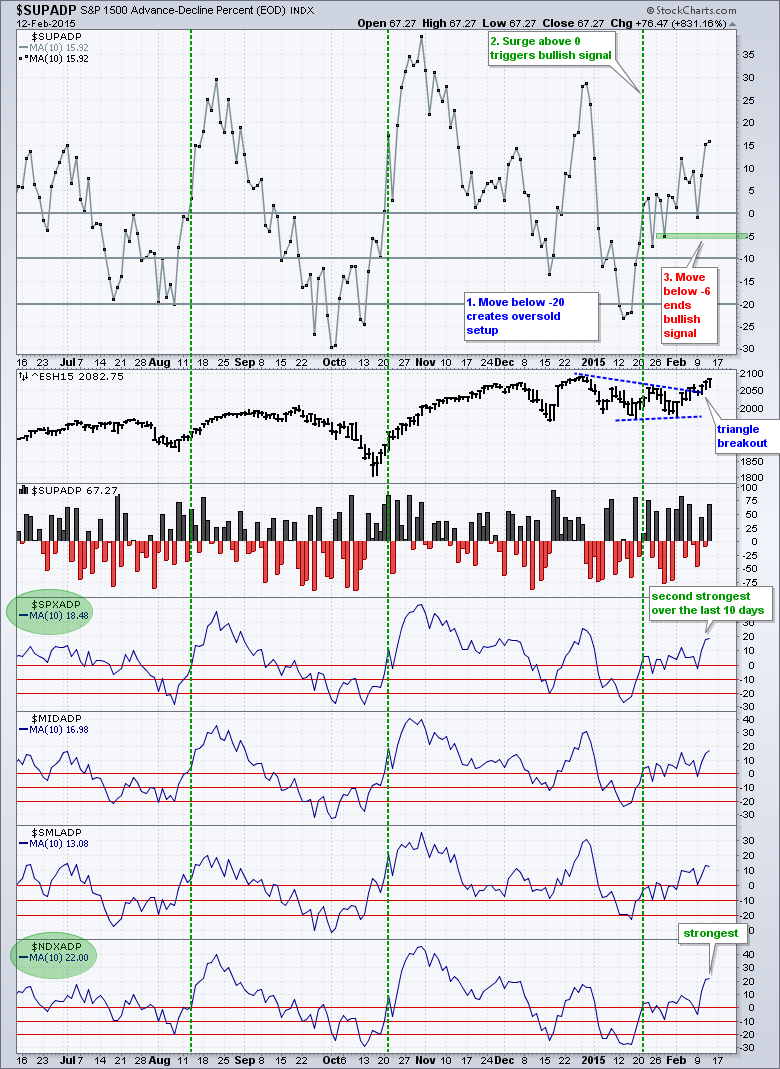
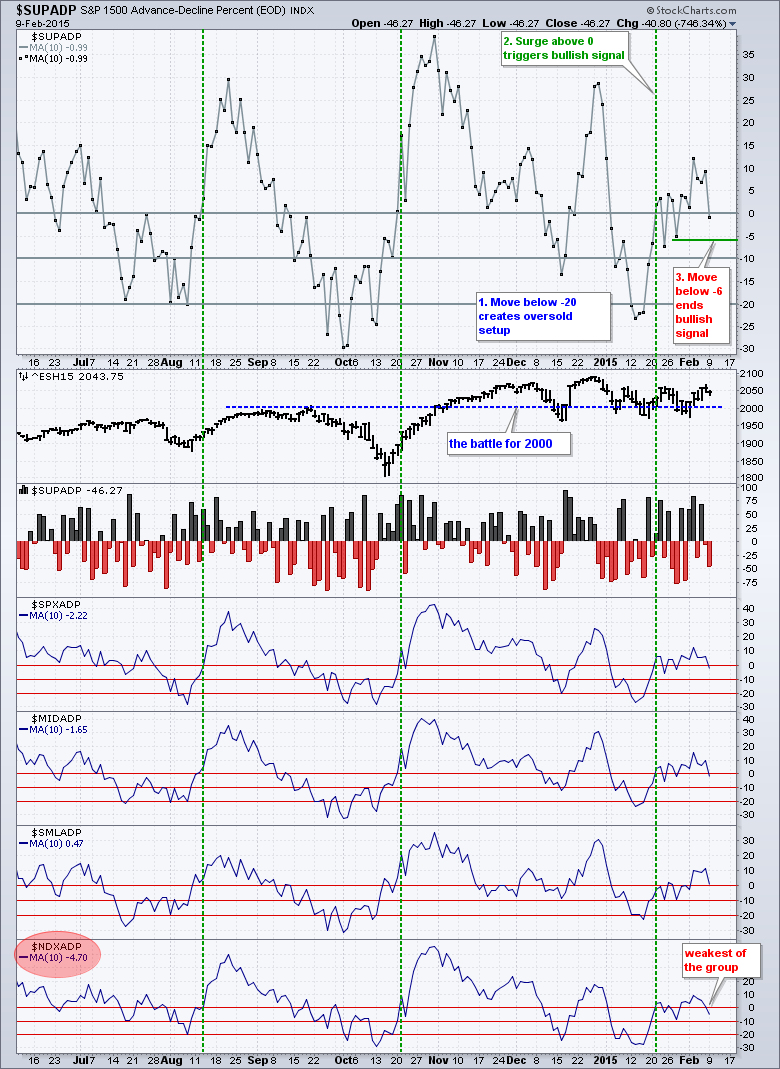
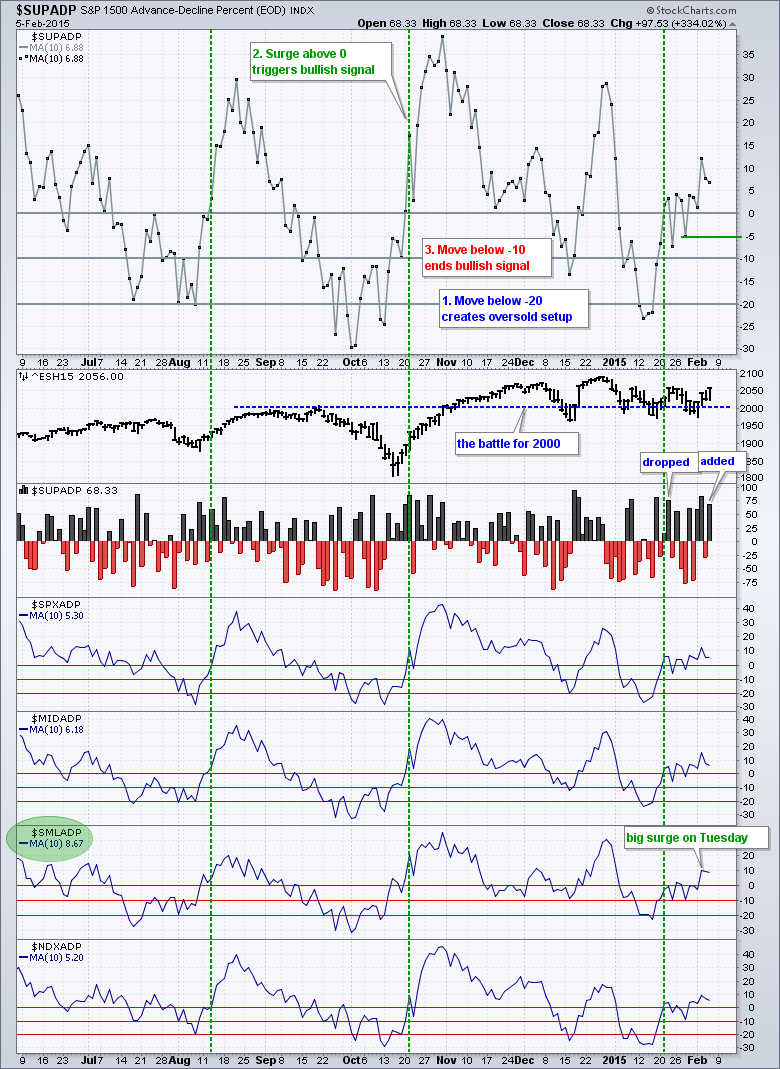
Short-Term Trend, Breadth and Intermarket Analysis
by Arthur Hill,
Chief Technical Strategist, TrendInvestorPro.com
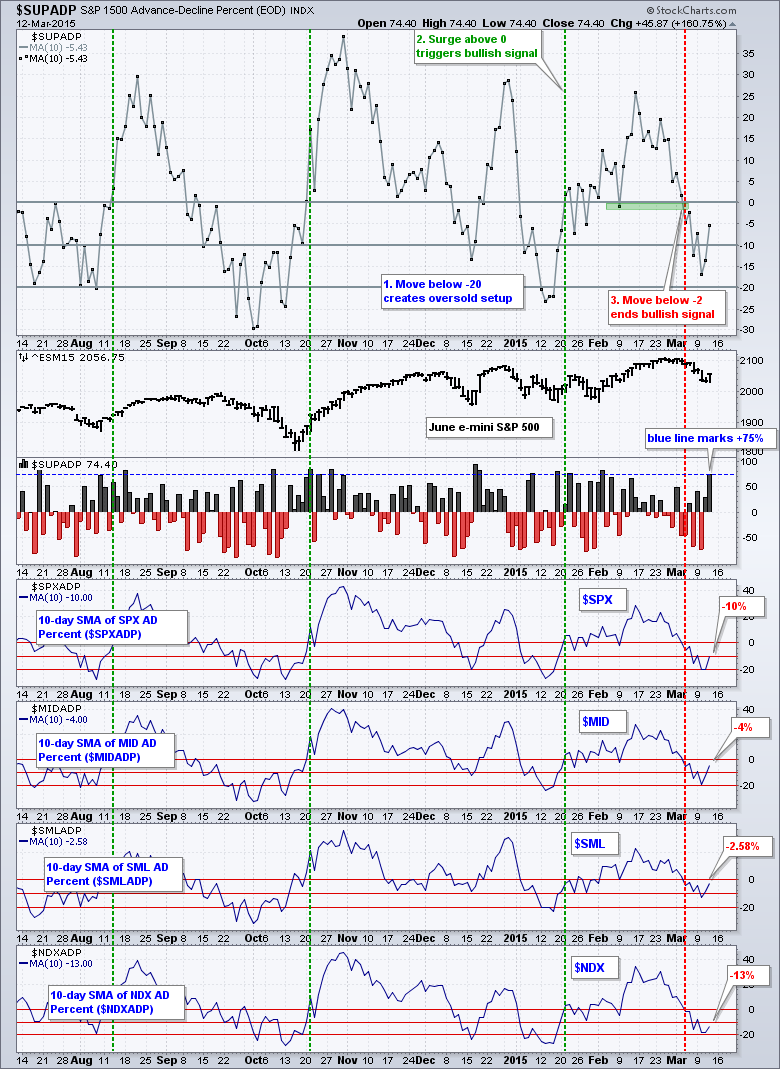
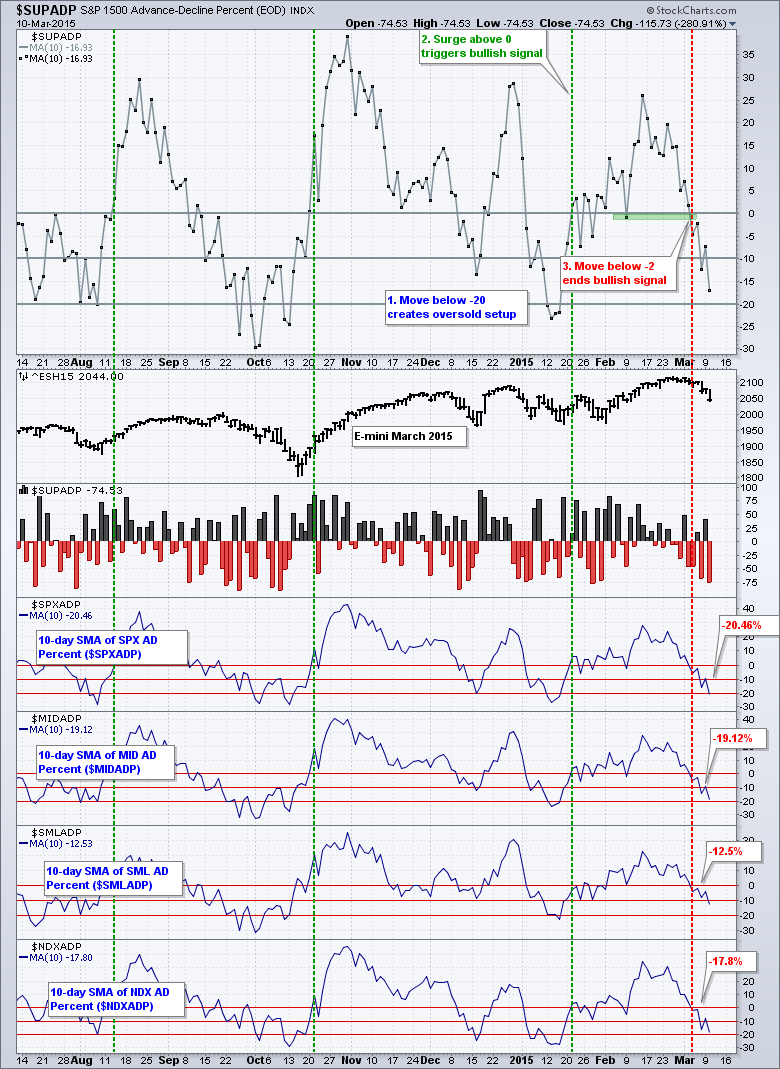
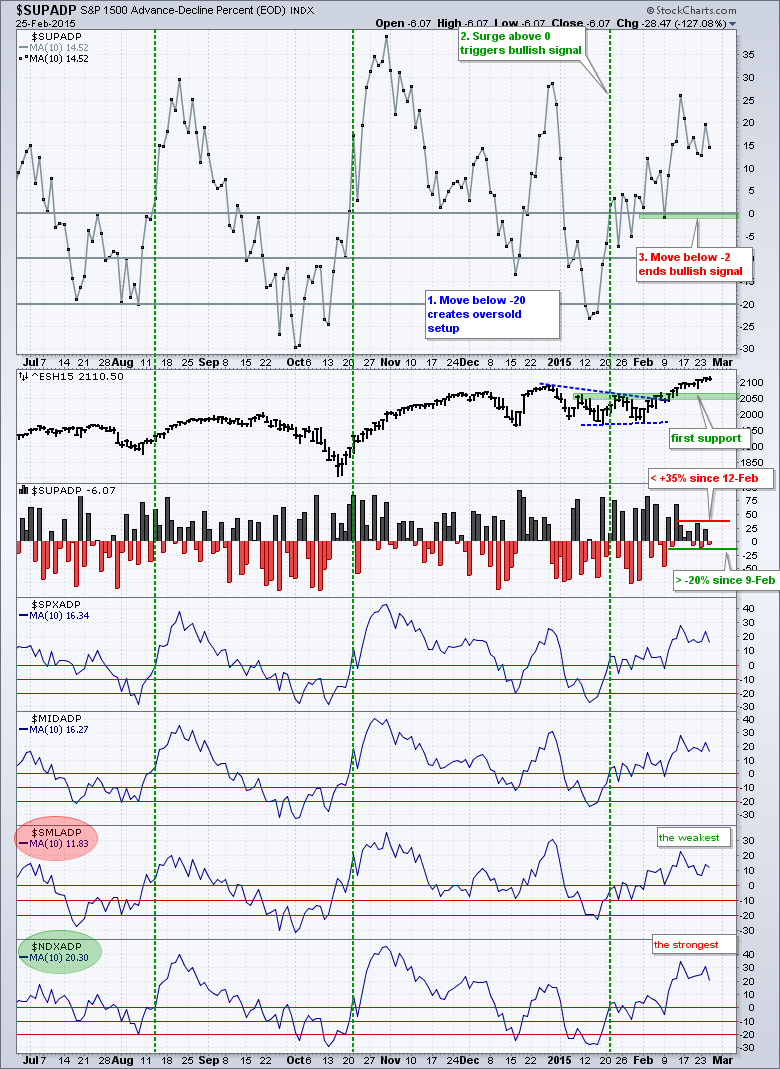
Trading was very mixed on Wall Street. Large-caps were under selling pressure as the Dollar surged to new highs yet again. SPY lost .23% on the day and the US Dollar ETF (UUP) surged 1.11%. Small-caps attracted some buying interest because they are largely immune to Dollar strength. The...
READ MORE
MEMBERS ONLY
Healthcare Stocks and International ETFs Lead SCTR Gainers
by Arthur Hill,
Chief Technical Strategist, TrendInvestorPro.com
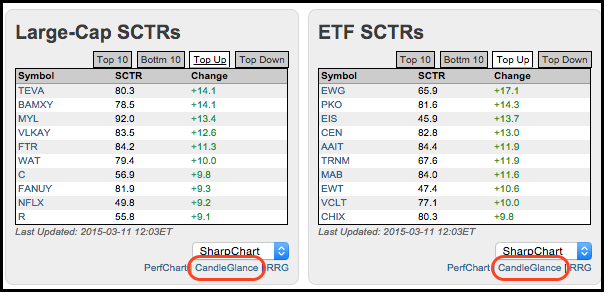
Chartists looking for movers and shakers can turn to the home page and check out the SCTR tables. Click the Top Up tab to see the big gainers (relative strength) and the Top Down tab to see the big losers (relative weakness). The screen shot below shows three stocks from...
READ MORE
MEMBERS ONLY
Downtrends in Stocks, Oil, Gold and Bonds
by Arthur Hill,
Chief Technical Strategist, TrendInvestorPro.com
Stocks were pummeled again on Tuesday with large-caps leading the way. Large-caps have more overseas exposure and are more affected by a strong Dollar. Small-caps held up better, but were not immune to selling pressure. All sectors moved lower with the Technology SPDR (XLK) and the Finance SPDR (XLF) falling...
READ MORE
MEMBERS ONLY
Short-Term Trend, Breadth and Intermarket Analysis
by Arthur Hill,
Chief Technical Strategist, TrendInvestorPro.com
After a pummeling on Friday, stocks got an oversold bounce on Monday. But the bounce was not that impressive. QQQ gained .29%, SPY was up .41% and IWM gained .44%. Industrials led the sectors higher and energy lagged. Miners were hit hard as the Gold Miners ETF (GDX) plunged 3....
READ MORE
MEMBERS ONLY
Stocks, Bonds, Oil and Gold Get Hit
by Arthur Hill,
Chief Technical Strategist, TrendInvestorPro.com
Selling pressure hit both stocks and bonds last week, but bonds more so than stocks. The S&P 500 fell around 1.5% for the week, which is not a drastic decline by any means. The 20+ YR T-Bond ETF (TLT) fell 4.5% last week and is down...
READ MORE
MEMBERS ONLY
Stocks are Down, but Not Broken
by Arthur Hill,
Chief Technical Strategist, TrendInvestorPro.com
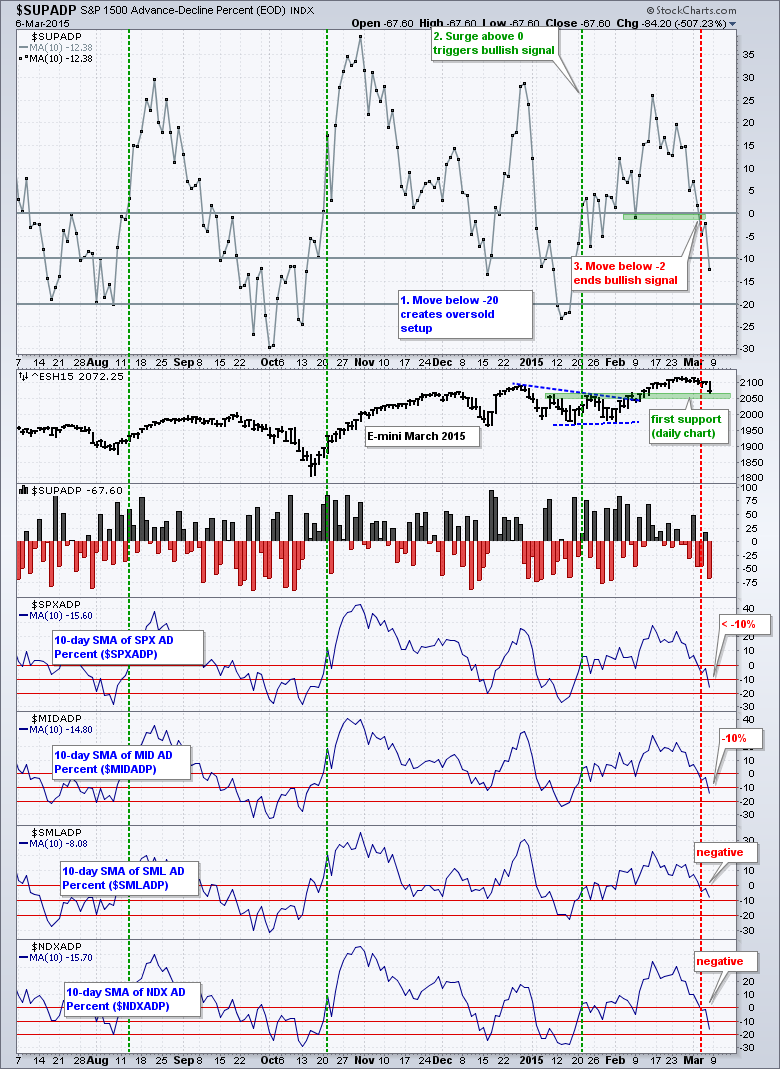
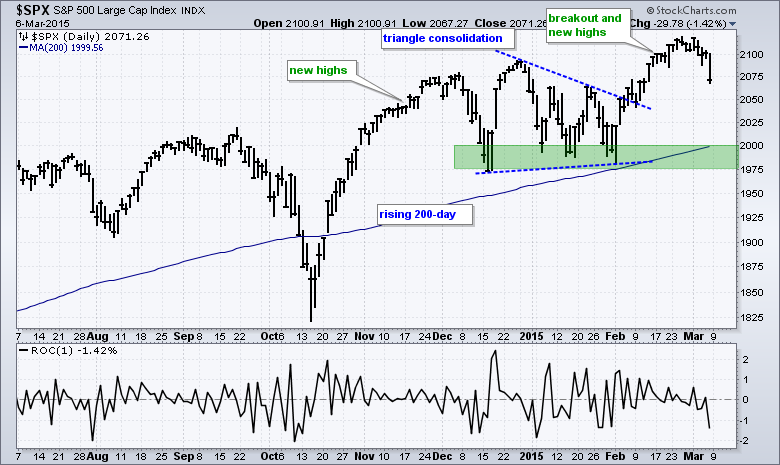
Stocks came under selling pressure in early March and this selling pressure intensified on Friday as the S&P 500 lost 1.42%, which was the biggest one day decline since late January. Even so, it is just one week of selling pressure and not enough to affect the...
READ MORE
MEMBERS ONLY
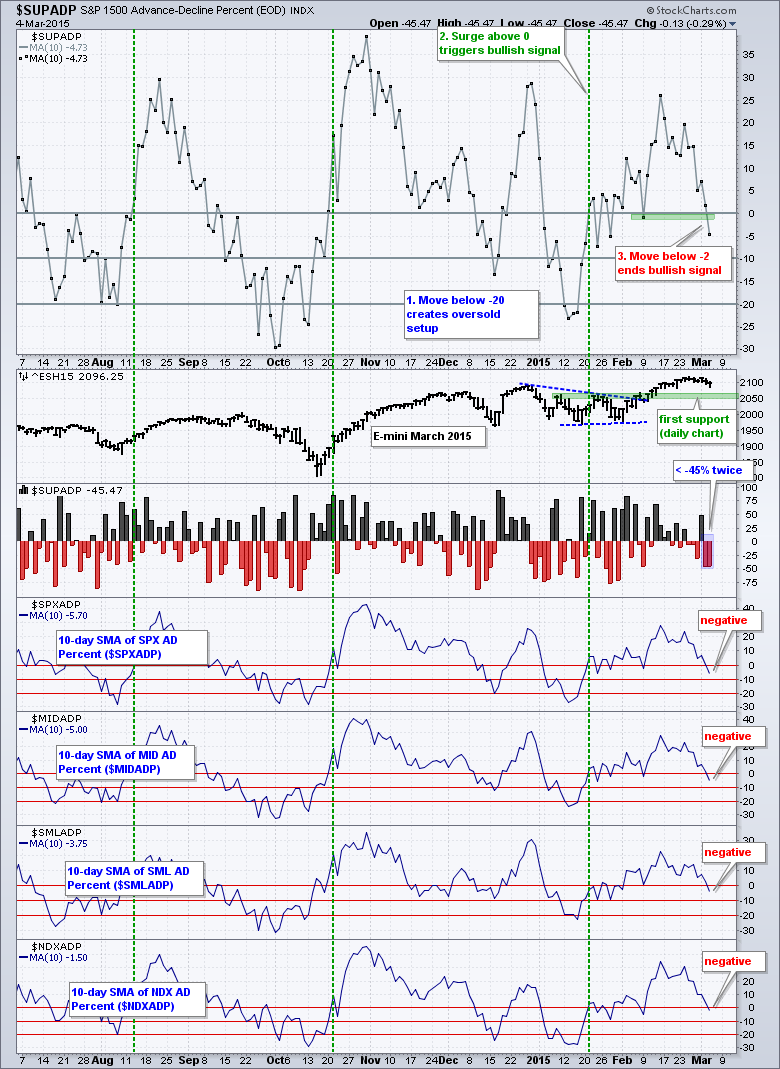
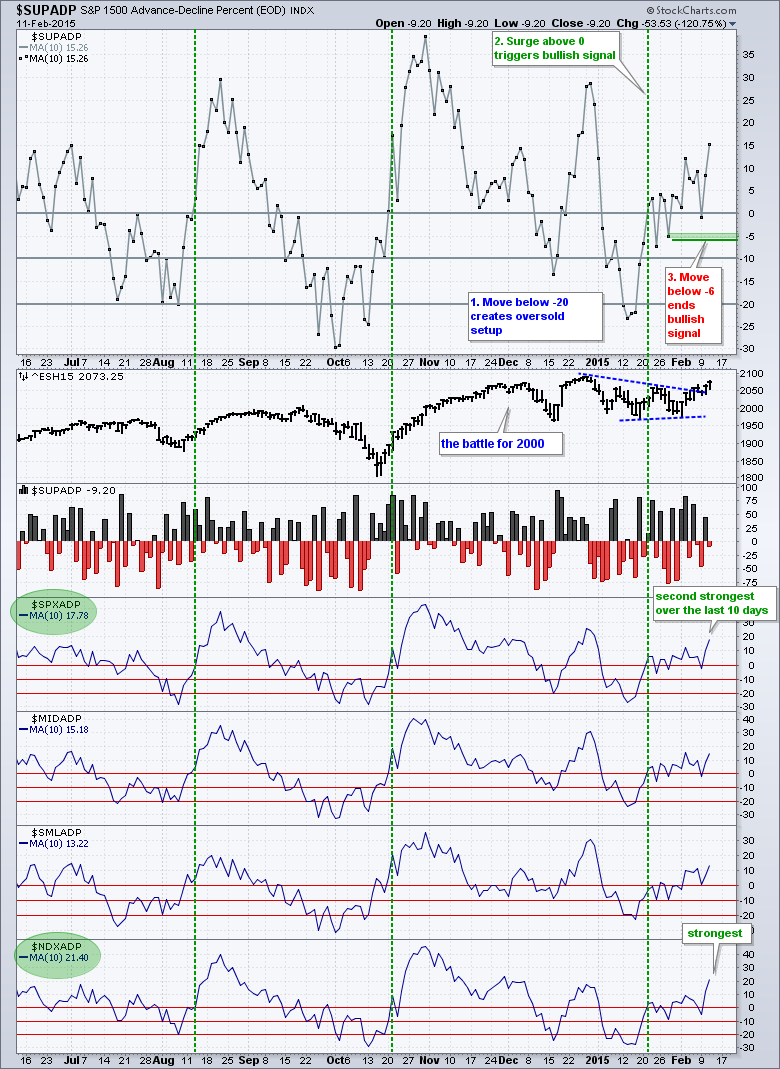
Short-Term Trend, Breadth and Intermarket Analysis
by Arthur Hill,
Chief Technical Strategist, TrendInvestorPro.com
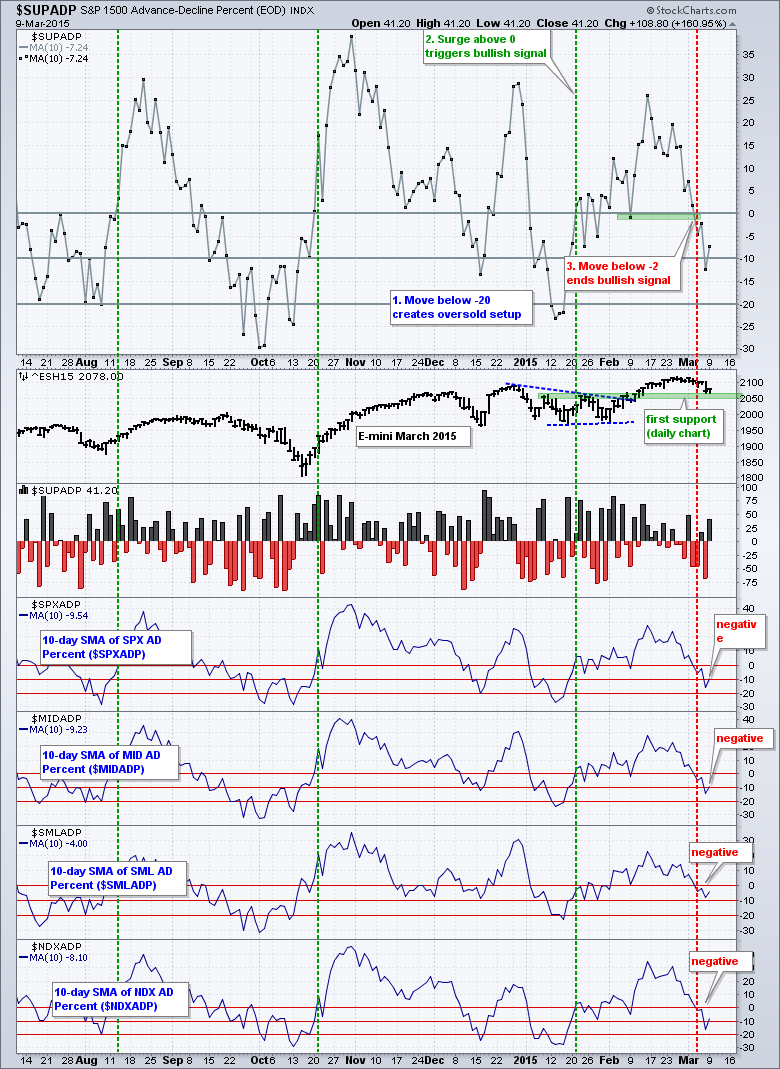
Stocks meandered as traders treaded water ahead of today's employment report. The S&P 500 popped on the open, dropped around lunchtime and recovered in the afternoon. SPY closed with a fractional gain - and a yawn. Banks got a boost from some positive news on the...
READ MORE
MEMBERS ONLY
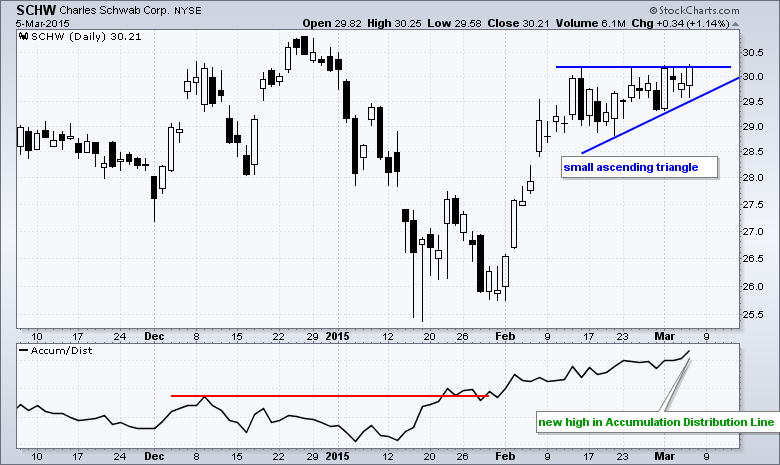
Schwab Goes for a Break as Volume Indicator Leads
by Arthur Hill,
Chief Technical Strategist, TrendInvestorPro.com
Charles Schwab (SCHW) surged in February and then consolidated the last few weeks with an ascending triangle, which is a bullish continuation pattern. A breakout would signal a continuation of the prior advance and target a move to new highs. The indicator window shows the Accumulation Distribution Line (ACDL) hitting...
READ MORE
MEMBERS ONLY
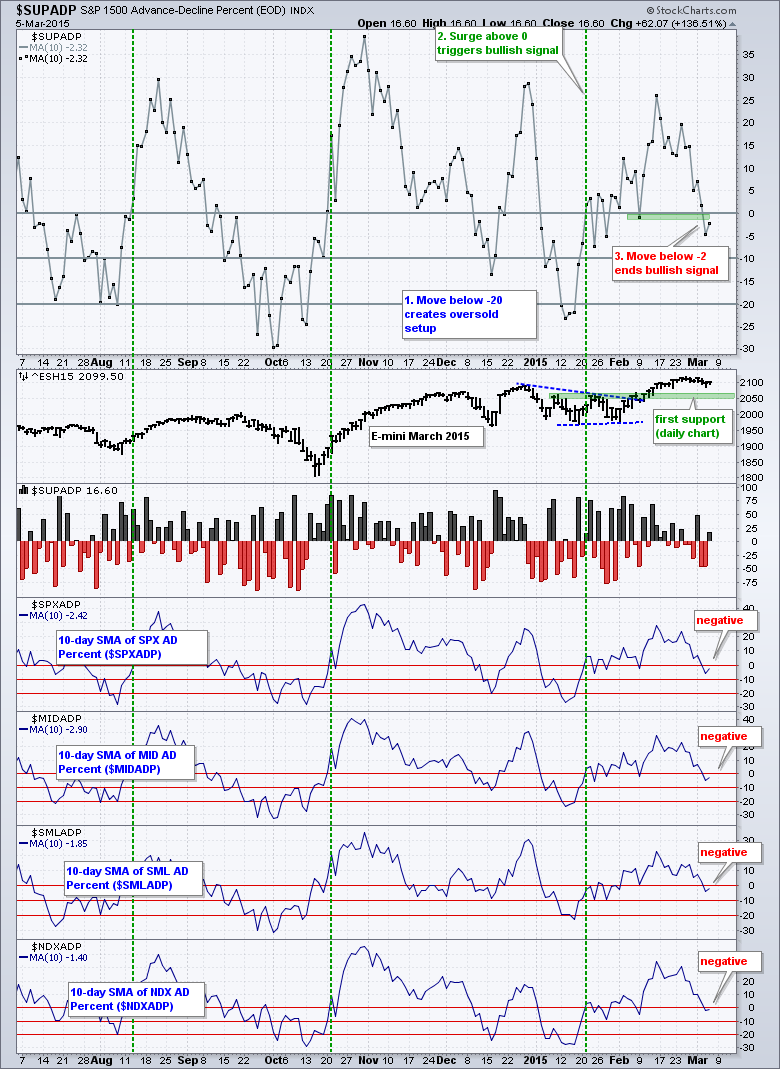
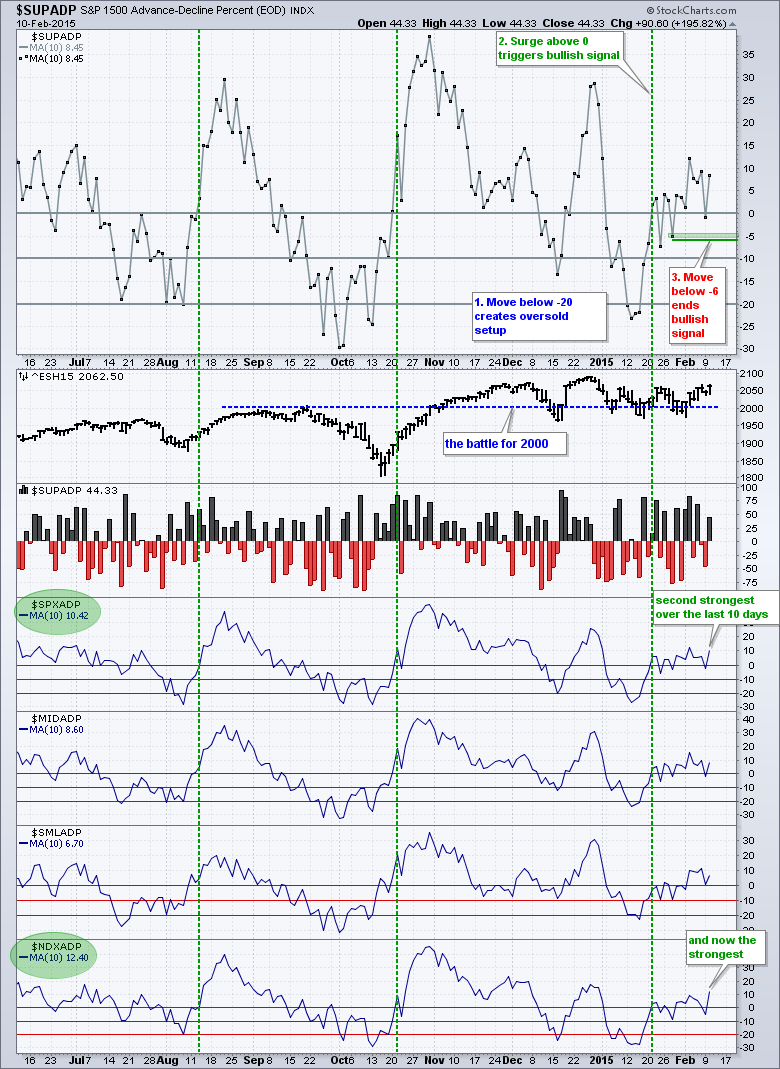
Short Term Trend Changes for Breadth, SPY and USO
by Arthur Hill,
Chief Technical Strategist, TrendInvestorPro.com
The S&P 500 did a repeat of Tuesday as the index opened weak with a plunge below 2090, quickly firmed and then recovered half the plunge with a bounce to the 2099 area. Selling pressure was pretty much across the board, but the declines were modest. Eight of...
READ MORE
MEMBERS ONLY
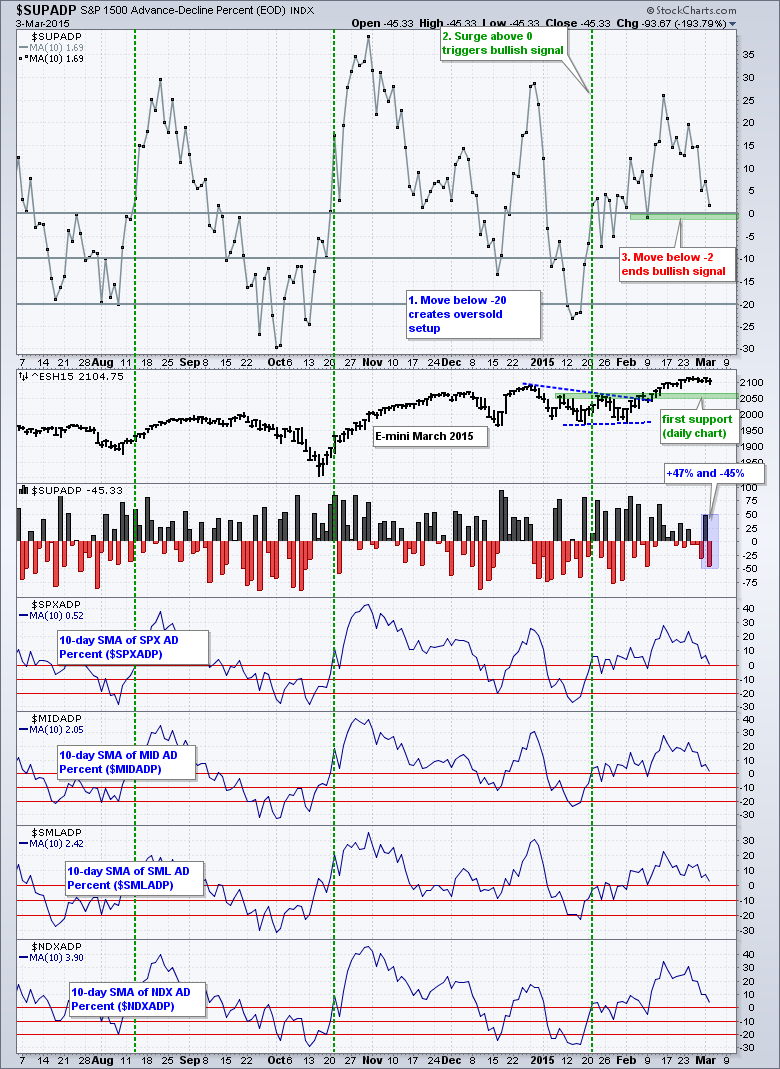
Short-Term Trend, Breadth and Intermarket Analysis
by Arthur Hill,
Chief Technical Strategist, TrendInvestorPro.com
Stocks were hit hard on the open as the S&P 500 fell below 2100 for the first time since February 20th. The index rebounded in the afternoon, but only recovered half of its morning loss. $SPX shows a series of lower lows and lower high the last five...
READ MORE
MEMBERS ONLY
Short-Term Trend, Breadth and Intermarket Analysis
by Arthur Hill,
Chief Technical Strategist, TrendInvestorPro.com
Stocks got right back to their bullish ways with the S&P 500 surging above 2117. The index started with a pop above 2113, dipped below 2100 and finished with a late surge to close near the high of the day. The major index ETFs finished higher with modest...
READ MORE
MEMBERS ONLY
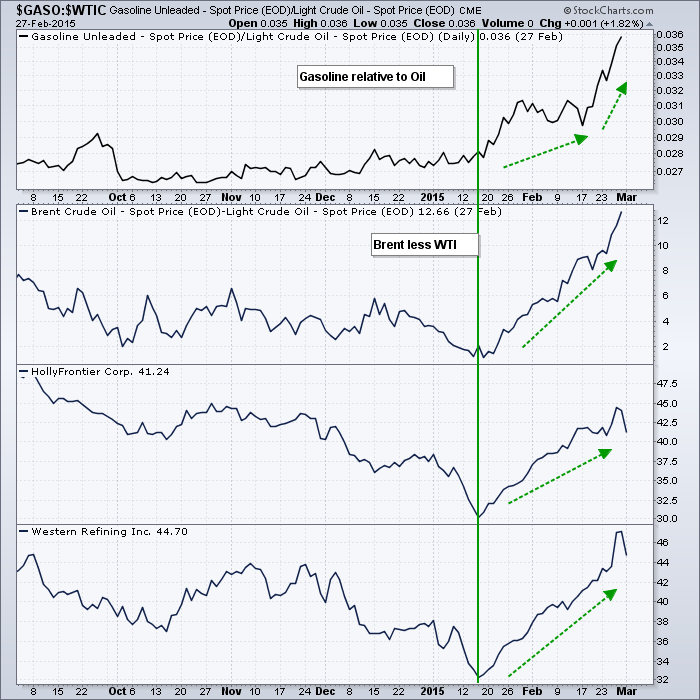
Relative strength in Gasoline and Brent Lifts Two Refiners
by Arthur Hill,
Chief Technical Strategist, TrendInvestorPro.com
WTI Crude ($WTIC) remains relatively subdued, but Brent ($BRENT) and Gasoline ($GASO) have been moving higher the last several weeks. The top chart shows gasoline relative to crude using a ratio plot ($GASO:$WTIC), and the second chart shows the BRENT-WTI spread ($BRENT-$WTIC). Both rose sharply from mid February...
READ MORE
MEMBERS ONLY
Breadth Stalls, TLT Tests Breakout, GLD Hits Resistance
by Arthur Hill,
Chief Technical Strategist, TrendInvestorPro.com
Stocks actually showed some selling pressure last week, but it was relatively mild and only for a few days. The S&P 500 moved above 2119 on Tuesday afternoon and then worked its way lower the rest of the week. With a close below 2105, the index fell around...
READ MORE
MEMBERS ONLY
IWM Perks Up, Dollar Breaks Out and TLT Tests Breakout
by Arthur Hill,
Chief Technical Strategist, TrendInvestorPro.com
It was a mixed day on Wall Street. Large-cap techs and small-caps led with modest gains. Mid-caps and the equal-weight S&P 500 lagged with modest losses. Energy got slammed again as oil fell. Small-cap performance was impressive because eight of the nine small-caps sector ETFs gained ground. The...
READ MORE
MEMBERS ONLY
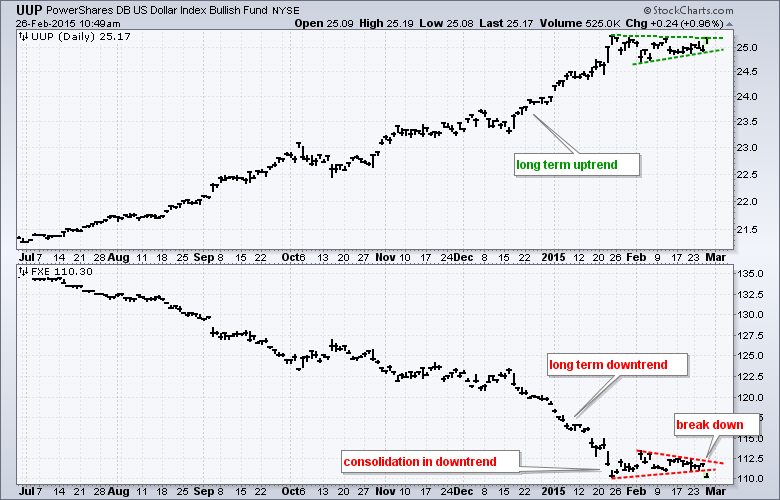
Euro ETF Gets a Continuation Signal
by Arthur Hill,
Chief Technical Strategist, TrendInvestorPro.com
After consolidating for four weeks, the Euro ETF (FXE) is making a bid to continue its downtrend with a break below consolidation support. The bottom chart shows FXE forming a triangle after an extended decline. This is a consolidation within a downtrend and it represents a rest within that trend....
READ MORE
MEMBERS ONLY
Breadth Stalls, TLT Holds Breakout and GLD Gets a Bounce
by Arthur Hill,
Chief Technical Strategist, TrendInvestorPro.com
The S&P 500 moved to a new high during the session, but selling pressure hit in the afternoon and the index closed with a fractional loss. Wednesday's price action is the first negative price action we have seen in a while. The inability to hold a...
READ MORE
MEMBERS ONLY
Intel Battles Gap and Relative Performance
by Arthur Hill,
Chief Technical Strategist, TrendInvestorPro.com
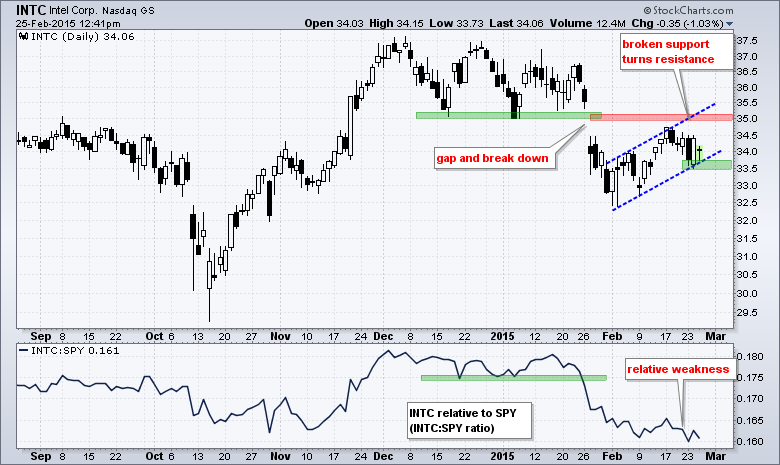
Intel is having a tough time this year. In fact, Intel (INTC) has been having a tough time since early December. The stock peaked around 37.5 in early December, formed a series of lower highs into mid January and then gapped down in late January. This gap-plunge broke support...
READ MORE
MEMBERS ONLY
Some Risk Aversion Creeps in as Breadth Underwhelms
by Arthur Hill,
Chief Technical Strategist, TrendInvestorPro.com
Stocks started the day strong as the S&P 500 surged above 2115 in the first ninety minutes. The index pulled back to the 2110 area around midday and rebounded in the afternoon to close above 2115. Once again, the gains for the day were modest across the board....
READ MORE
MEMBERS ONLY
Short-Term Trend, Breadth and Intermarket Analysis
by Arthur Hill,
Chief Technical Strategist, TrendInvestorPro.com
There it is again! Stocks started the day weak as the S&P 500 dropped to the 2104 level in the first hour. After choppy trading most of the day, the index surged in the final hour and closed a whisker below 2110. Selling pressure remains muted and buying...
READ MORE
MEMBERS ONLY
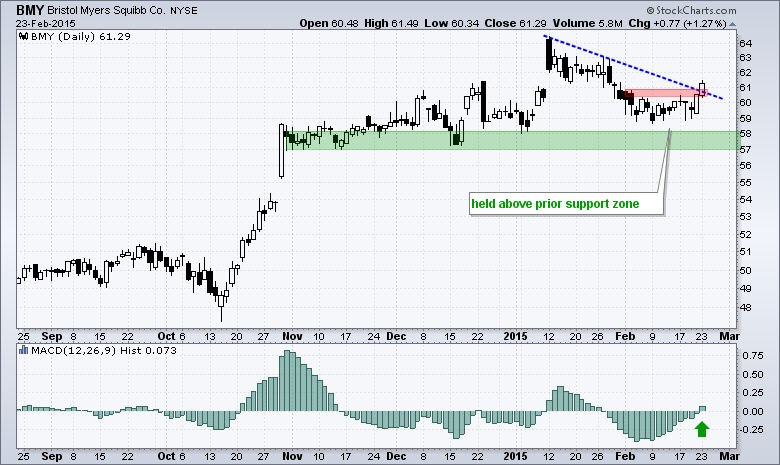
Bristol Myers Gets a Histogram Signal
by Arthur Hill,
Chief Technical Strategist, TrendInvestorPro.com
Bristol Myers (BMY) is making a bid to turn back up and bounce off support. On the price chart, the stock firmed above the December-January lows in February and moved to its highest level of the month today. The indicator window shows the MACD Histogram turning positive, which means MACD...
READ MORE
MEMBERS ONLY
Short-Term Trend, Breadth and Intermarket Analysis
by Arthur Hill,
Chief Technical Strategist, TrendInvestorPro.com
Even though the major index ETFs are short-term overbought, stocks continue to exhibit bullish price action overall. For example, the S&P 500 fell over 10 points and dipped below 2087 in the first thirty minutes on Friday, but quickly found its footing and advanced the rest of the...
READ MORE
MEMBERS ONLY
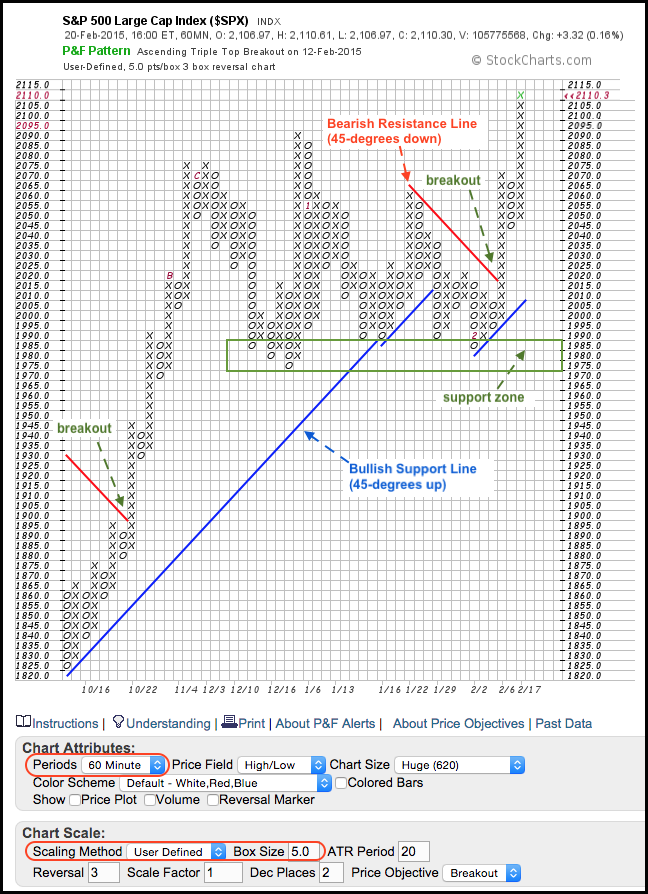
Adding a Systematic Touch with P&F Charts
by Arthur Hill,
Chief Technical Strategist, TrendInvestorPro.com
Chartists looking to filter small price movements and add a systematic touch to their analysis can turn to Point & Figure charts. Chart 1 shows a 60-minute P&F chart for the **S&P 500** and each box is five points. With a traditional 3-box reversal setting, this...
READ MORE
MEMBERS ONLY
Short-Term Trend, Breadth and Intermarket Analysis
by Arthur Hill,
Chief Technical Strategist, TrendInvestorPro.com
The S&P 500 has been flat as a pancake the last three days, but the Nasdaq 100 and Russell 2000 continued higher. Note that the S&P 500 is up .02% this week, the Nasdaq 100 is up .63% and the Russell 2000 is up .39%. The...
READ MORE
MEMBERS ONLY
Short-Term Trend, Breadth and Intermarket Analysis
by Arthur Hill,
Chief Technical Strategist, TrendInvestorPro.com
Stocks started the day with some mild selling pressure, firmed during the day and then rallied in the final two hours. The rally, however, was not that strong and the major index ETFs closed mixed on the day. QQQ was up a fraction and DIA was down a fraction. The...
READ MORE
MEMBERS ONLY
Pre-defined Technical Alerts Continue Green
by Arthur Hill,
Chief Technical Strategist, TrendInvestorPro.com
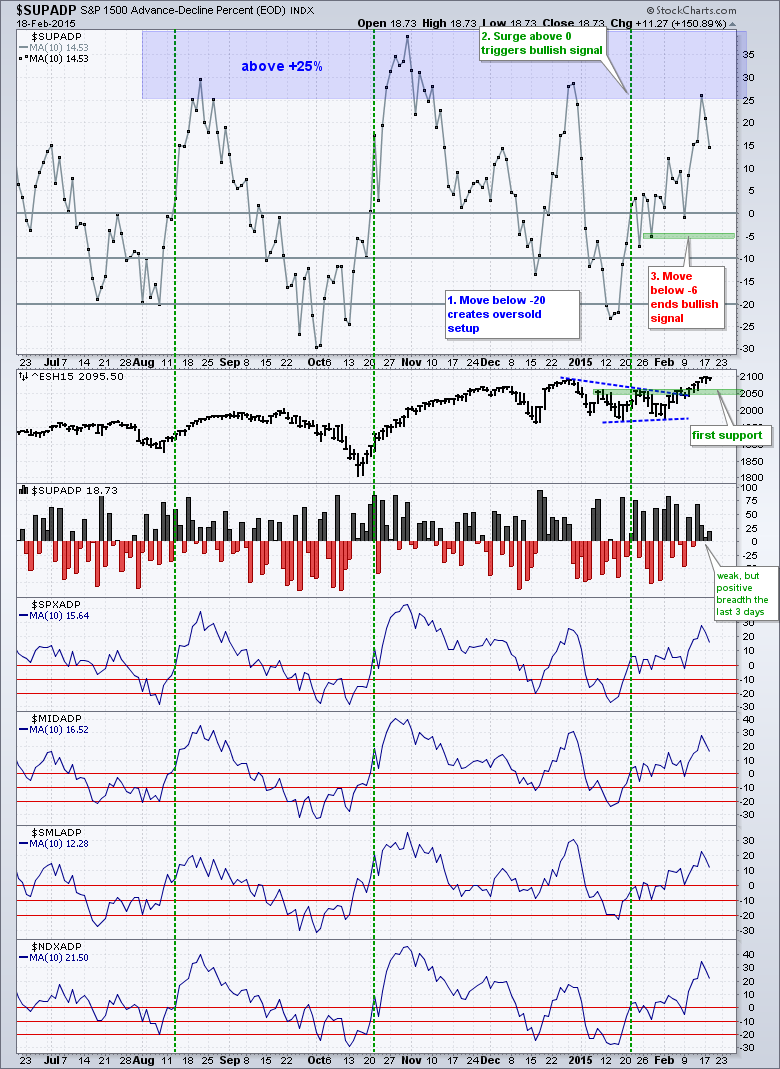
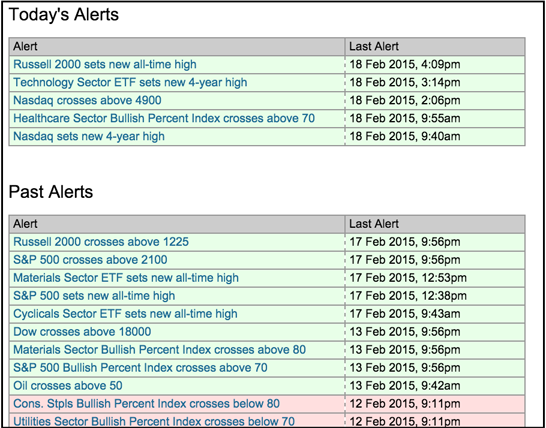
Chartists can regularly check the Pre-defined Technical Alerts page for clues on market trends. Green alerts dominate the last three days and these green alerts come from the stock market. Just today, the Russell 2000 hit an all time high and the Nasdaq hit a 4-year high. Multi-year highs occur...
READ MORE
MEMBERS ONLY
Short-Term Trend, Breadth and Intermarket Analysis
by Arthur Hill,
Chief Technical Strategist, TrendInvestorPro.com
Stocks opened strong, dipped in the afternoon and then finished strong. Once again, the price action during the day is bullish and buying pressure continues to assert itself. The major index ETFs closed with fractional gains. The sectors were mixed with small gains and losses. Consumer discretionary, utilities and consumer...
READ MORE
MEMBERS ONLY
Breadth Hits an Extreme - TLT Becomes Oversold
by Arthur Hill,
Chief Technical Strategist, TrendInvestorPro.com
Stocks continued higher last week with the S&P 500, Nasdaq 100 and Russell 2000 hitting new highs on Friday. Techs led the rally as xrt6QQQ gained 3.67% and XLK surged 3.77%. Utilities did not partake as Treasury yields rose again last week. The Home Construction iShares...
READ MORE
MEMBERS ONLY
QQQ Hits New High for 2015 - TLT Hits Key Retracement
by Arthur Hill,
Chief Technical Strategist, TrendInvestorPro.com
Stocks put in another positive day with bullish price action. The S&P 500 opened strong with a surge above 2080 and then worked its way higher to close at 2088. Once again, we are seeing the ability to start strong and finish strong. Stock market strength was broad...
READ MORE
MEMBERS ONLY
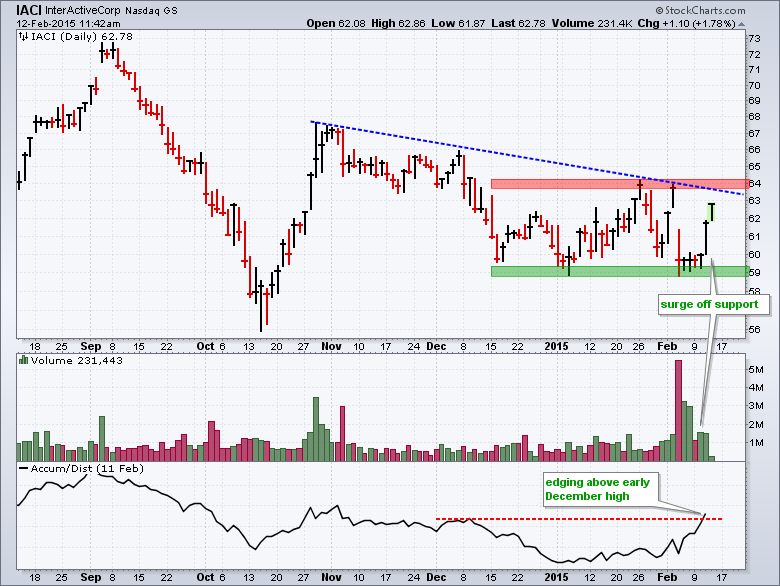
InterActive Corp Shows Signs of Accumulation
by Arthur Hill,
Chief Technical Strategist, TrendInvestorPro.com
Interactive Corp (IACI) has turned rather volatile this year with a choppy trading range between 59 and 64. The stock gapped down to range support last week, but immediately firmed and surged off support with good volume. IACI is now in the process of filling the gap and a break...
READ MORE
MEMBERS ONLY
Large-caps Lead - UUP Breaks Out - GLD Extends Downtrend
by Arthur Hill,
Chief Technical Strategist, TrendInvestorPro.com
It was a choppy day on Wall Street with QQQ edging higher and IWM edging lower. The sectors were mixed with techs and consumer staples producing small gains. Utilities took another hit as the Utilities SPDR (XLU) fell over 2%. Within the tech sector, the Networking iShares (IGN), Semiconductor SPDR...
READ MORE
MEMBERS ONLY
QQQ Takes the Lead and UUP Stalls
by Arthur Hill,
Chief Technical Strategist, TrendInvestorPro.com
Stocks put in another good performance on Tuesday. The S&P 500 opened strong and worked its way higher the rest of the day. As with last week, this is the kind of price action the bulls want to see. The consumer discretionary, healthcare and technology sectors led the...
READ MORE
MEMBERS ONLY
Short-Term Trend, Breadth and Intermarket Analysis
by Arthur Hill,
Chief Technical Strategist, TrendInvestorPro.com
Selling pressure extended on Monday, but the selling pressure was rather tame and the losses were modest. A little selling pressure after a big advance last week is normal at this stage. Healthcare, utilities and consumer staples led the sectors lower. Energy stocks gained as oil extended its bounce. The...
READ MORE
MEMBERS ONLY
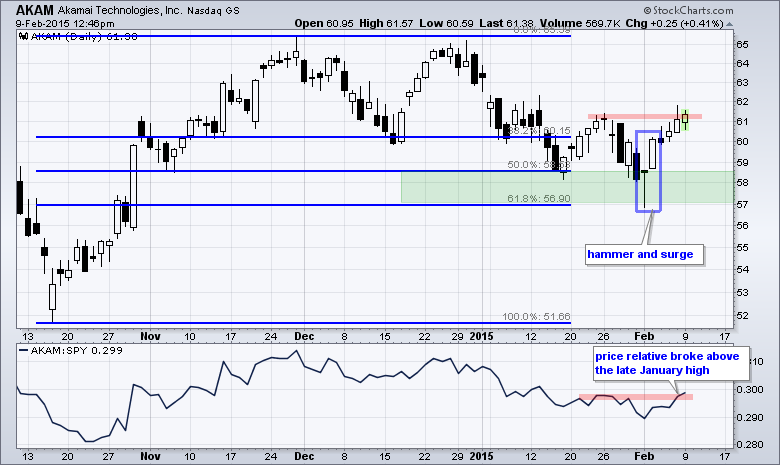
Akamai Forges Candlestick Reversal at Key Retracement
by Arthur Hill,
Chief Technical Strategist, TrendInvestorPro.com
It has been a rough year for Akamai (AKAM), but the decline over the last few months looks like a classic correction. After hitting a new high in late November, the stock retraced 50-62% with a decline to the 57-58 area. This retracement amount is typical for a correction within...
READ MORE
MEMBERS ONLY
SPY and IWM Hold Breakouts, QQQ Lags and TLT Breaks
by Arthur Hill,
Chief Technical Strategist, TrendInvestorPro.com
Stocks were hit with some selling pressure on Friday, but the week as a whole showed some pretty positive price action. SPY began its advance on Monday, gapped up on Tuesday and then worked its way higher until Friday morning. Selling pressure hit in the afternoon, but SPY still managed...
READ MORE
MEMBERS ONLY
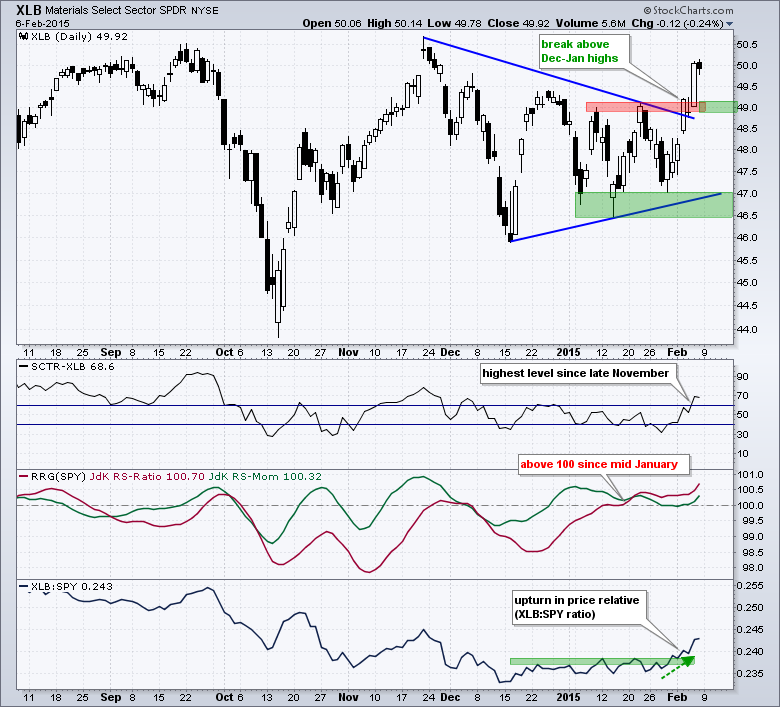
Three Relative Performance Indicators Turn Up for XLB
by Arthur Hill,
Chief Technical Strategist, TrendInvestorPro.com
The Materials SPDR (XLB) sprang to life on the price chart and three relative strength indicators broke out. On the price chart, XLB surged in October-November and then consolidated in December-January with a big triangle. Trading was certainly choppy within the triangle, but the ETF finally made a decisive break...
READ MORE
MEMBERS ONLY
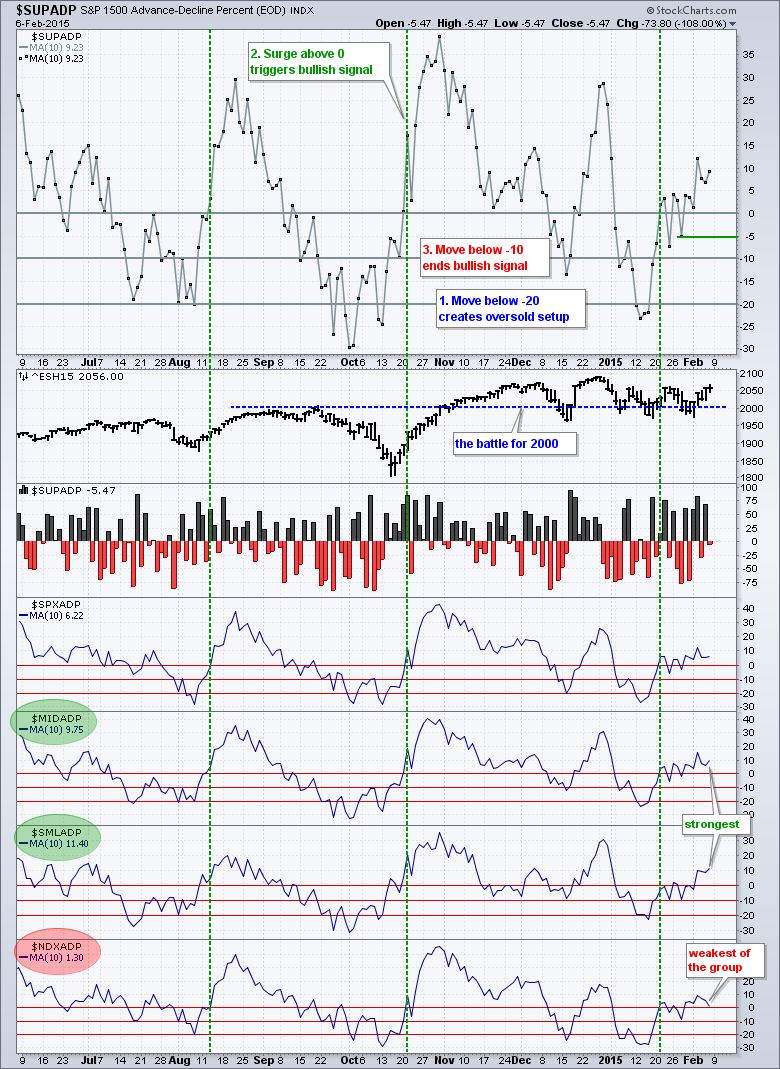
$SPX, $NDX, High Low Indicators, Financial ETFs, Materials ETFs, Semi ETF, Yields, Gold, Economic Indicators
by Arthur Hill,
Chief Technical Strategist, TrendInvestorPro.com
-- S&P 500 and Nasdaq 100 Make Breakout Bids (creating unique charts)
-- High-Low Percent Indicators Stay Bullish
-- Bounce in T-Yields Lifts Financials
-- XSD Shows Chart Strength (finding ETF holdings)
-- Materials Sector Springs to Life
-- Treasury Yields Bounce
-- Dollar Jumps
-- Gold Falls...
READ MORE
MEMBERS ONLY
Short-Term Trend, Breadth and Gold Analysis
by Arthur Hill,
Chief Technical Strategist, TrendInvestorPro.com
The S&P 500 surged late Monday and early Tuesday with a move from 1990 to 2040, and then worked its way higher. This is positive price action because the index held the surge and continued higher. Small-caps led the way on Thursday with IWM gaining 1.29%. All...
READ MORE
MEMBERS ONLY
Keys to the SPY Breakout - GLD Stalls after Break Down
by Arthur Hill,
Chief Technical Strategist, TrendInvestorPro.com
After a surge from 1985 to 2050, trading in the S&P 500 turned choppy on Wednesday with a rather tight range. There was, however, some late selling pressure as the index dropped from 2053 to 2040 in the final 30 minutes. Must have been some news event hitting...
READ MORE