MEMBERS ONLY
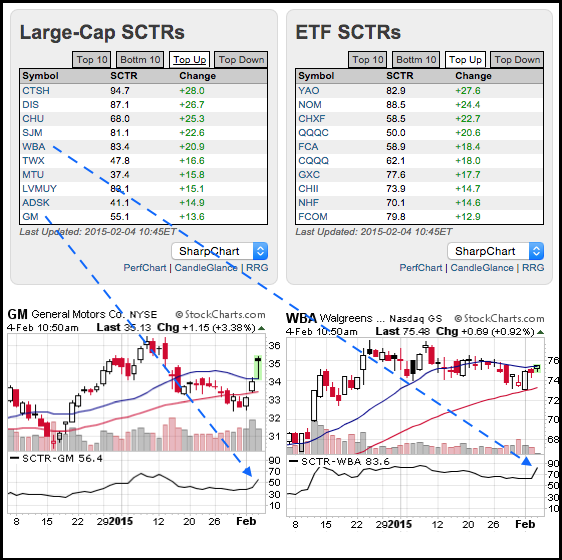
Technical Ranks Surge for Walgreen and GM
by Arthur Hill,
Chief Technical Strategist, TrendInvestorPro.com
The image below shows a screen shot from the home page with SCTR tables for large-caps and ETFs. The "top up" tab was selected to focus on the biggest gainers. Notice that the StockCharts Technical Rank (SCTR) for GM moved above 50 and the SCTR for Walgreens moved...
READ MORE
MEMBERS ONLY
SPY and QQQ Lead with Gaps and Breakouts
by Arthur Hill,
Chief Technical Strategist, TrendInvestorPro.com
Stocks started strong with a surge on the open, traded flat for a few hours and then moved higher the entire afternoon. The ability to open strong and finish strong is positive and the S&P 500 finished strong the last two days. Energy led the way as oil...
READ MORE
MEMBERS ONLY
SPY, QQQ and IWM Bounce off Support
by Arthur Hill,
Chief Technical Strategist, TrendInvestorPro.com
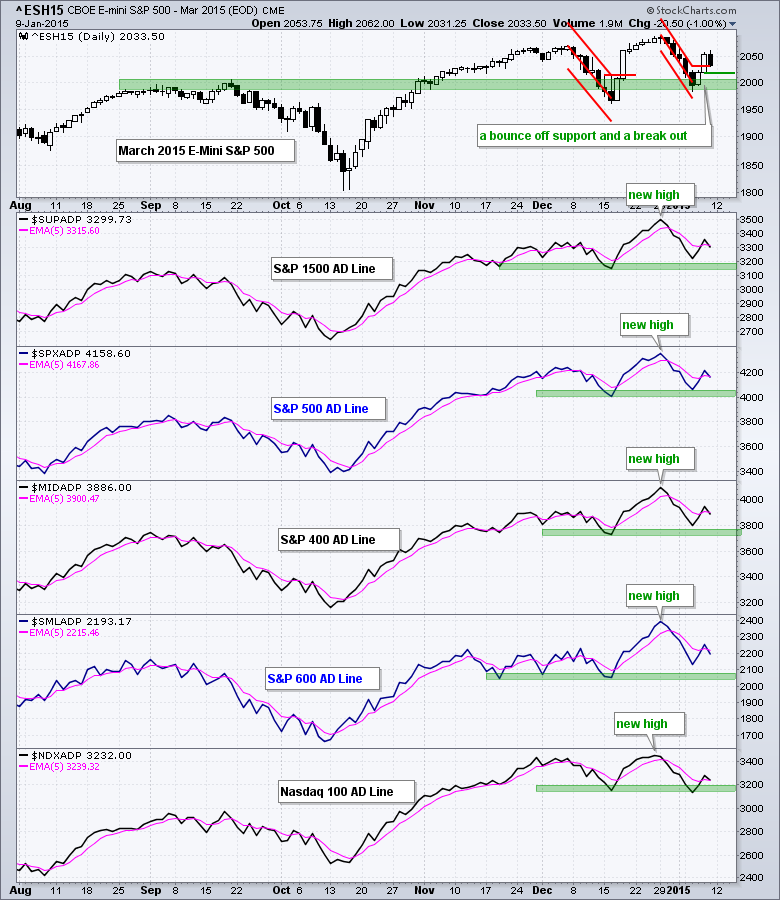
Stocks started the day weak with selling pressure on the open, but quickly firmed around 10AM and the S&P 500 surged above 2000 before lunch. After an early afternoon swoon, buyers stepped in again and pushed this key benchmark back above 2000. In fact, the index closed above...
READ MORE
MEMBERS ONLY
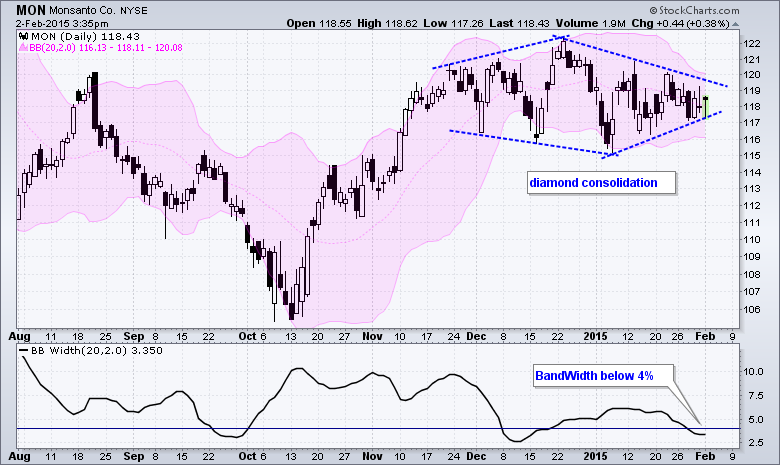
The Noose Tightens on Monsanto
by Arthur Hill,
Chief Technical Strategist, TrendInvestorPro.com
Monsanto (MON) could be poised for a volatility expansion because BandWidth has narrowed over the last few weeks and volatility has contracted signficantly. The BandWidth indicator tells us that the difference between the upper and lower Bollinger Bands is less than 4%, which is relatively low. John Bollinger theorized that...
READ MORE
MEMBERS ONLY
Short-Term Trend, Breadth and Risk Analysis
by Arthur Hill,
Chief Technical Strategist, TrendInvestorPro.com
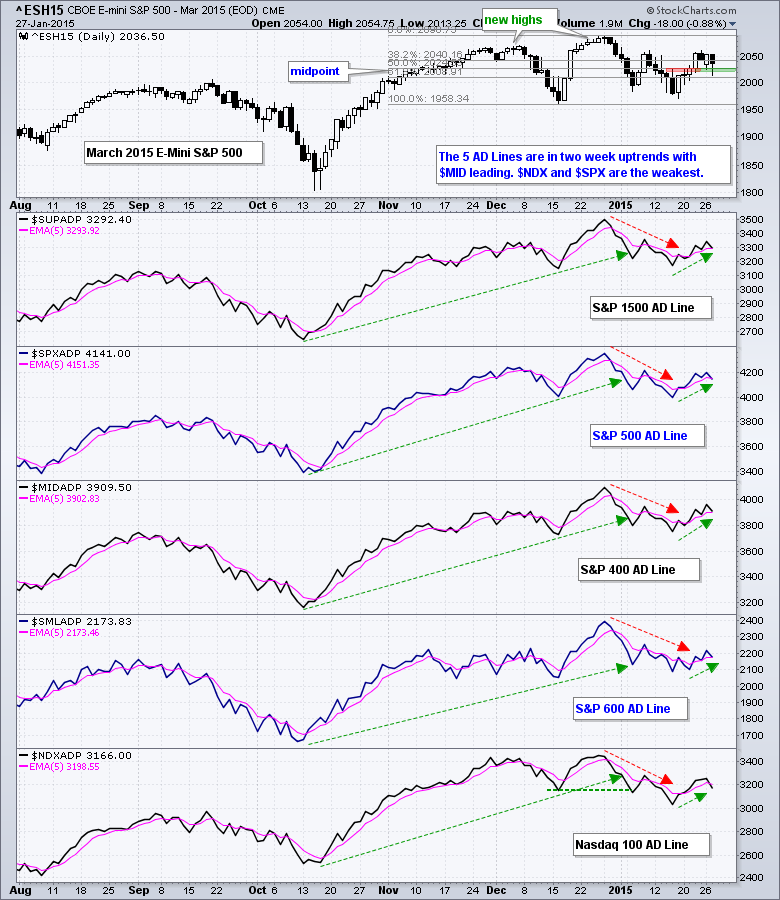
Stocks took it on the chin last week with large-caps leading the way lower. QQQ and the S&P 100 ETF (OEF) lost around 3% last week. Big banks and big techs led the way lower as XLK and XLF lost over 3%. The Consumer Discretionary SPDR (XLY) held...
READ MORE
MEMBERS ONLY
Short-Term Trend, Breadth and Intermarket Analysis
by Arthur Hill,
Chief Technical Strategist, TrendInvestorPro.com
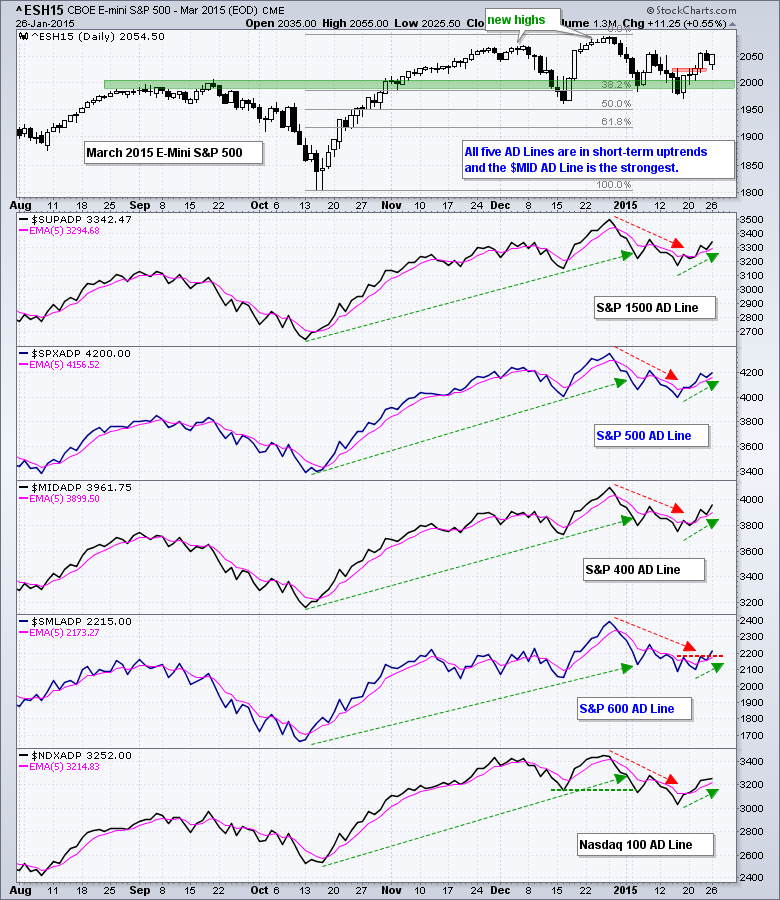
Stocks started the day with some selling pressure, but firmed around 11AM and moved steadily higher the rest of the day. Small-caps and micro-caps led the way as IWM and IWC gained 1.38% and 1.48%, respectively. The consumer discretionary sector led the SPDRs, the equal-weight sectors and the...
READ MORE
MEMBERS ONLY
Gaps Hold - GLD Triangulates - Oil Breaks Down
by Arthur Hill,
Chief Technical Strategist, TrendInvestorPro.com
Stocks took it on the chin again on Wednesday with the major index ETFs losing over 1%. Well, QQQ managed a 0.5% loss because Apple and Facebook gained. Nevertheless, 89 out of the 100 stocks in QQQ declined and selling pressure was pretty lopsided. Energy-related stocks were hammered as...
READ MORE
MEMBERS ONLY
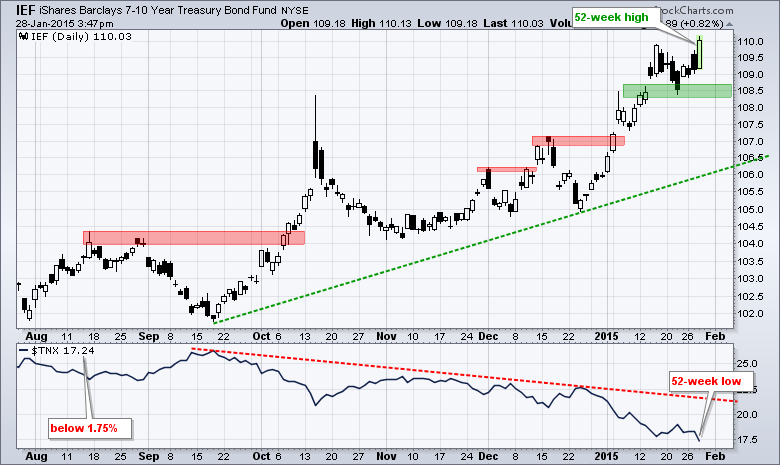
Bond Market Says Lower Rates Ahead
by Arthur Hill,
Chief Technical Strategist, TrendInvestorPro.com
Another Fed statement has come and gone, and Treasury bonds simply continue to march higher. The chart below shows the 7-10 YR T-Bond ETF (IEF) hitting yet another 52-week high today with a big move above 110. The indicator window shows the 10-YR Treasury Yield ($TNX) moving below 1.75%...
READ MORE
MEMBERS ONLY
Short-Term Trend, Breadth and Risk Analysis
by Arthur Hill,
Chief Technical Strategist, TrendInvestorPro.com
Stocks continued their volatile ways as SPY and QQQ fell sharply on the open, rebounded and then sold off in the final hour. Microsoft and Durable Goods got most of the blame. The strong Dollar is also affecting earnings in large-caps. Small-caps held up quite well as IWM fell just...
READ MORE
MEMBERS ONLY
Retail SPDR Holds Key Area and Shows Relative Strength
by Arthur Hill,
Chief Technical Strategist, TrendInvestorPro.com
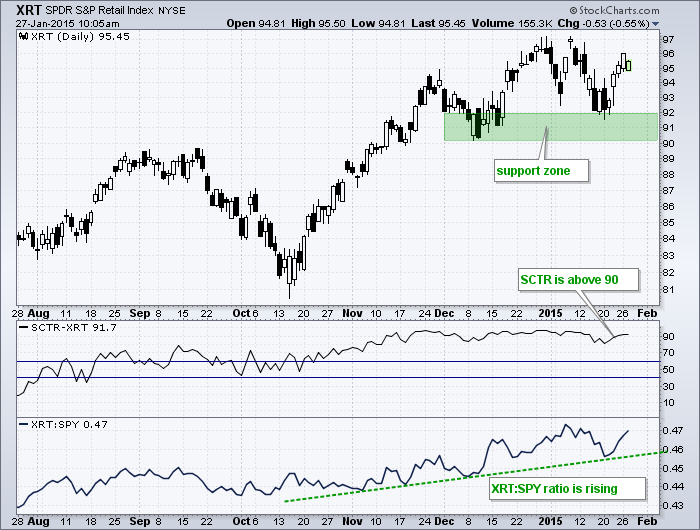
The chart below shows the Retail SPDR (XRT) bouncing off a support zone and remaining in an uptrend. For relative strength, the first indicator window shows the StockCharts Technical Rank (SCTR) above 90, which means XRT is in the top 10% of our ETF universe. The second window shows the...
READ MORE
MEMBERS ONLY
MDY and IWM Start to Lead - TLT Stalls Ahead of Fed
by Arthur Hill,
Chief Technical Strategist, TrendInvestorPro.com
Stocks started the day weak, but quickly found their footing and moved higher the rest of the day. Despite this recovery, QQQ ended the day with a fractional loss and SPY closed with a fractional gain. Small-caps and mid-caps were another story as IWM gained 1% and MDY led with...
READ MORE
MEMBERS ONLY
Short-term Trend Analysis for QQQ, GLD, TLT, USO and More
by Arthur Hill,
Chief Technical Strategist, TrendInvestorPro.com
Stocks took a breather on Friday, but the Nasdaq 100 ETF (QQQ) and Russell 2000 Growth iShares (IWO) bucked the selling pressure by producing small gains to end the week. Overall, QQQ led the market last week with a 3.41% gain and the Technology SPDR (XLK) led the sector...
READ MORE
MEMBERS ONLY
IWM Follows with a Breakout - USO Forms Another Consolidation
by Arthur Hill,
Chief Technical Strategist, TrendInvestorPro.com
Stocks moved sharply higher on Thursday with IWM getting the biggest gain among the major index ETFs. Note that IWM and IJR were both up over 2%. Even though these two show relative weakness in January, they typically outperform during a broad market move. The Finance SPDR (XLF) sprang to...
READ MORE
MEMBERS ONLY
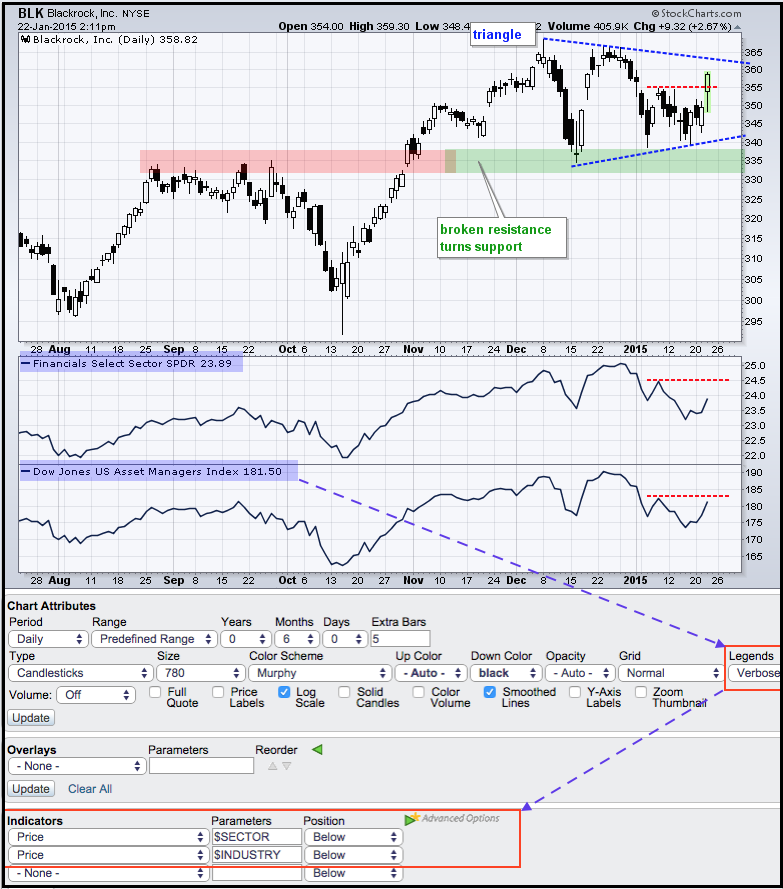
Blackrock Leads Assets Managers Group Higher
by Arthur Hill,
Chief Technical Strategist, TrendInvestorPro.com
The finance sector came to life on Thursday with leadership from banks ($DJUSBK) and asset managers ($DJUSAG). The chart below shows asset manager Blackrock holding its breakout and surging off support with a big move above 355. Notice that the stock shows a little more "chart" strength than...
READ MORE
MEMBERS ONLY
QQQ and SPY Perk Up, but IWM Shows Relative Weakness
by Arthur Hill,
Chief Technical Strategist, TrendInvestorPro.com
Stocks managed to claw out some gains with large-caps leading the way. SPY and QQQ gained around a half percent. Small-caps were weak as IWM fell .32%. The gains and losses were small and not that significant. Energy, materials and utilities led the market higher. This is not the crew...
READ MORE
MEMBERS ONLY
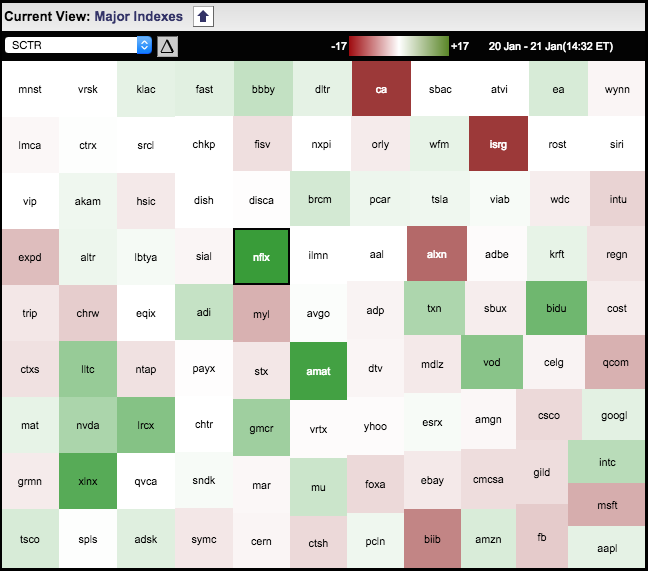
Six Semiconductor Stocks Lead on SCTR MarketCarpet
by Arthur Hill,
Chief Technical Strategist, TrendInvestorPro.com
The image below comes from a MarketCarpet for the Nasdaq 100. It is set to show the biggest changes in the StockCharts Technical Rank (SCTR). The biggest gainers have dark green boxes and the biggest losers have dark red boxes. Notice that seven green boxes come from the semiconductor group...
READ MORE
MEMBERS ONLY
Short-term Trend Analysis for QQQ, GLD, TLT, UUP and More
by Arthur Hill,
Chief Technical Strategist, TrendInvestorPro.com
The technology sector came to life with a modest gain on Tuesday, but the consumer discretionary and finance sectors countered with declines. Relative weakness in finance is getting to be a problem for the overall market and may not clear up as long as Treasury yields fall. The consumer discretionary...
READ MORE
MEMBERS ONLY
Breadth, Risk Indicators and Short-Term Trend Analysis
by Arthur Hill,
Chief Technical Strategist, TrendInvestorPro.com
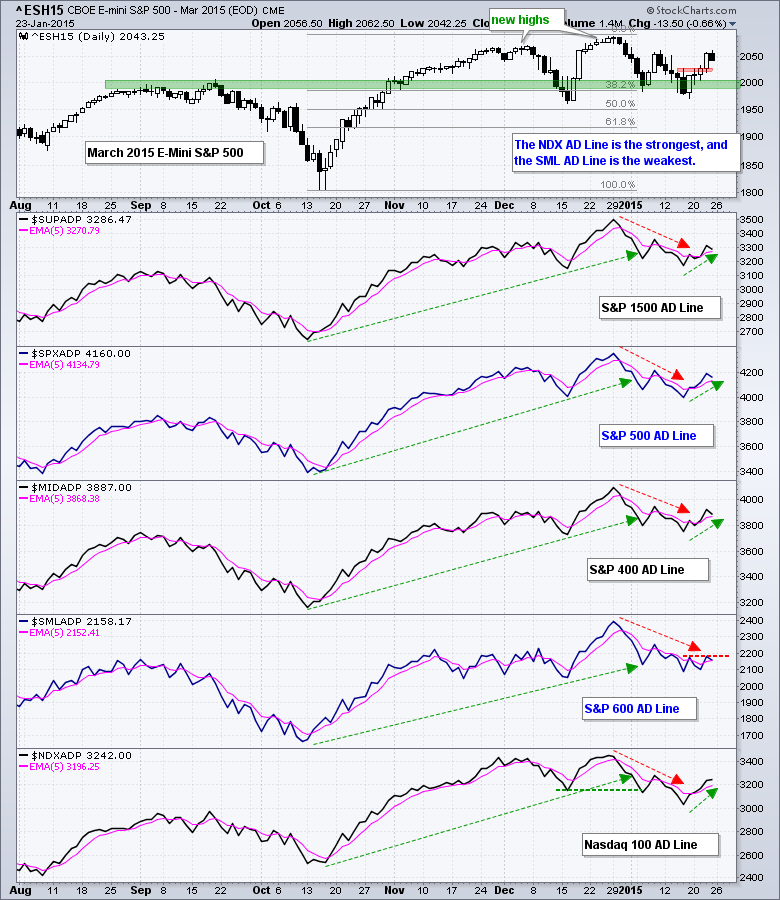
SPY, QQQ and IWM broke down last week, but rebounded sharply on Friday. Despite this rebound, the major index ETFs closed down for the week. IWM led Friday with a 1.63% advance and small-caps continue to hold up well overall. Energy led the sectors higher as XLE got a...
READ MORE
MEMBERS ONLY
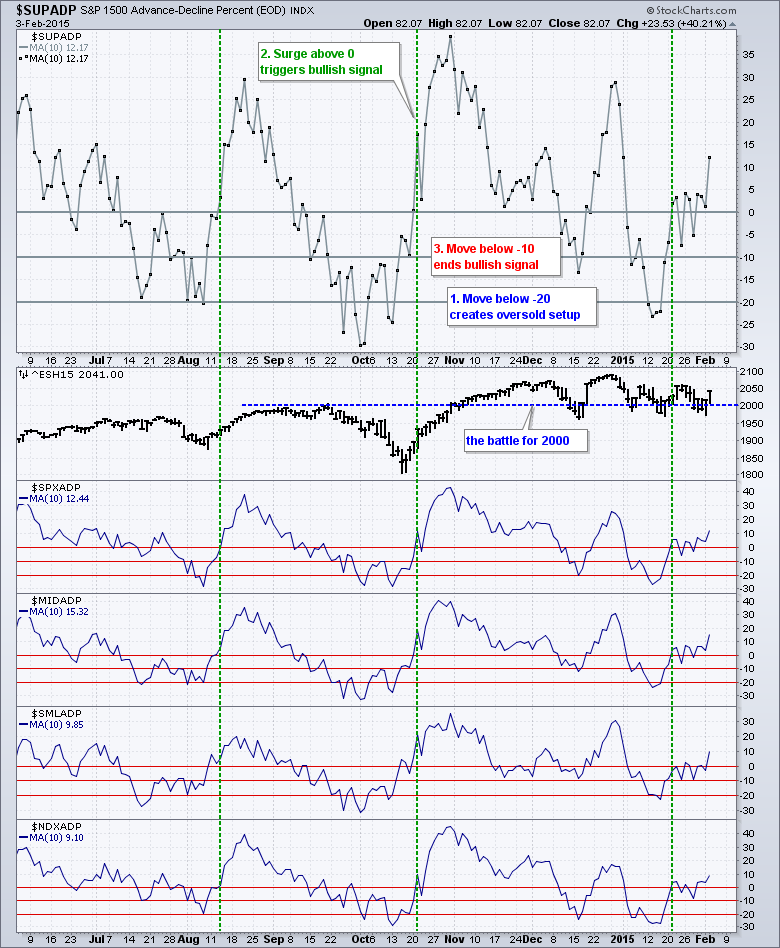
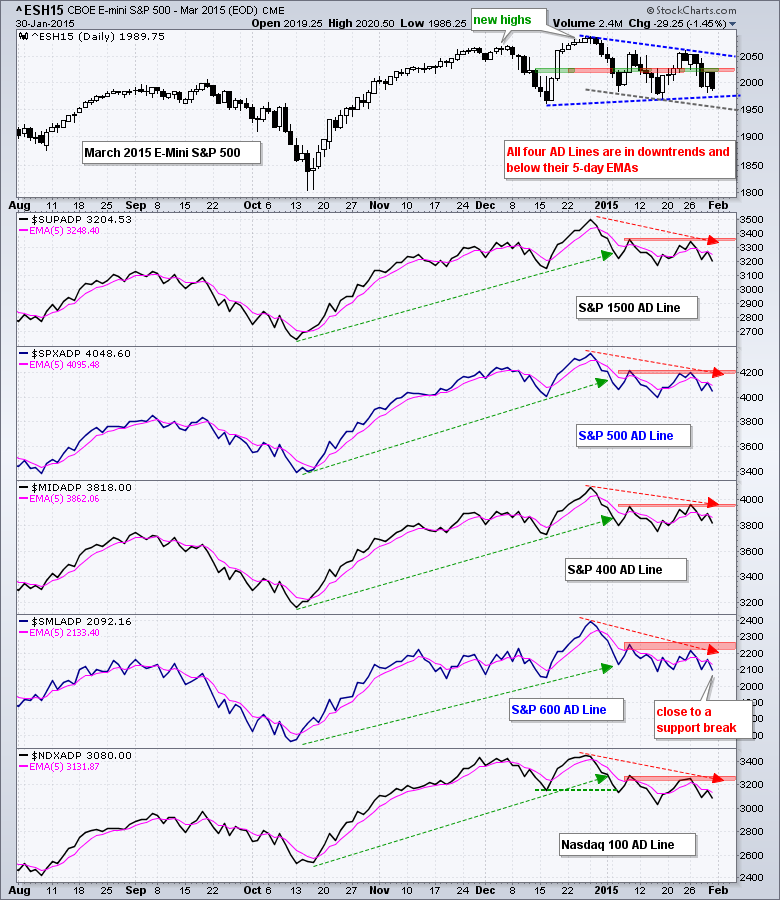
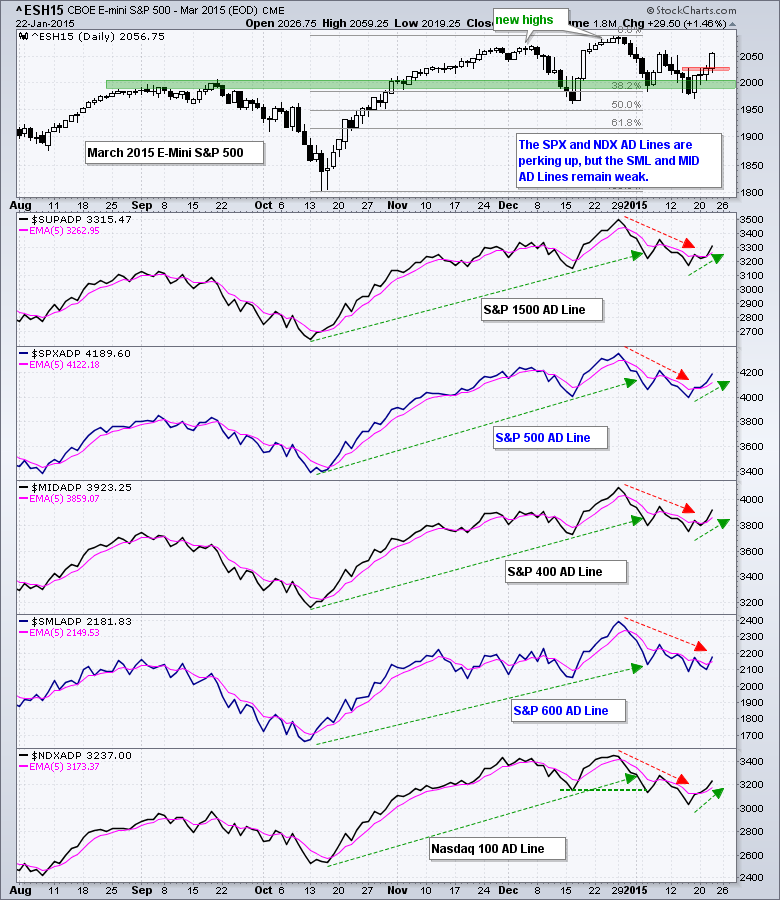
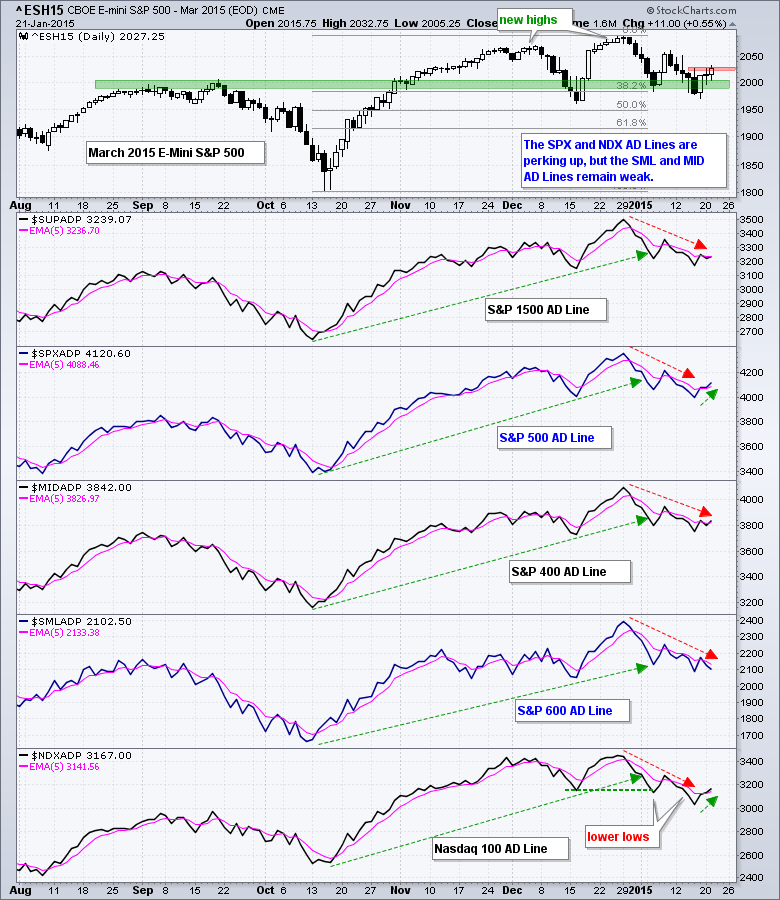
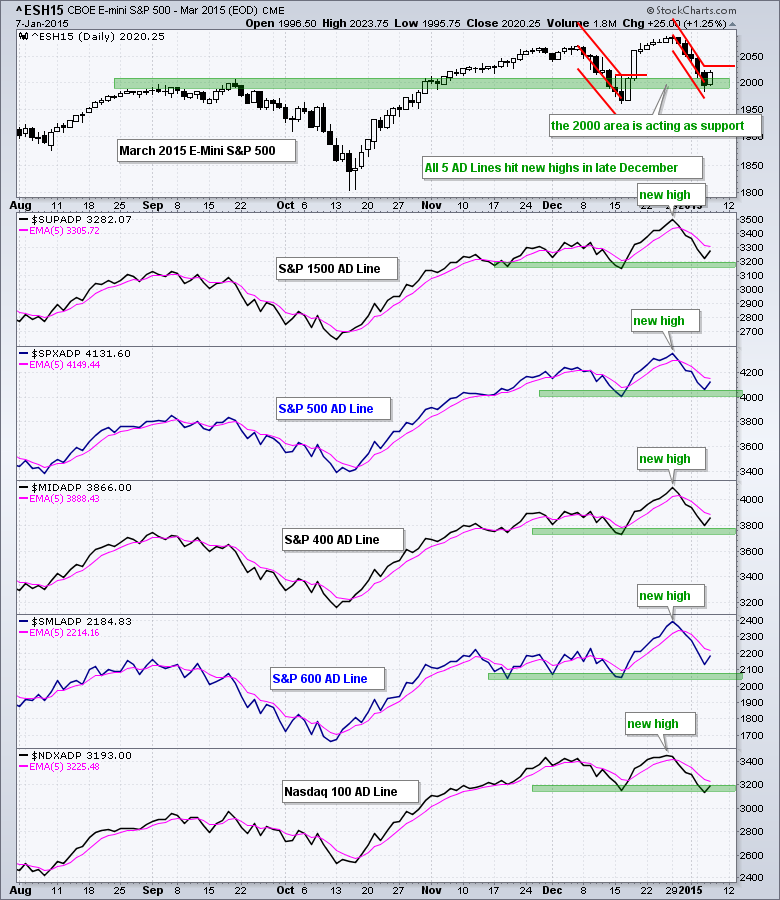
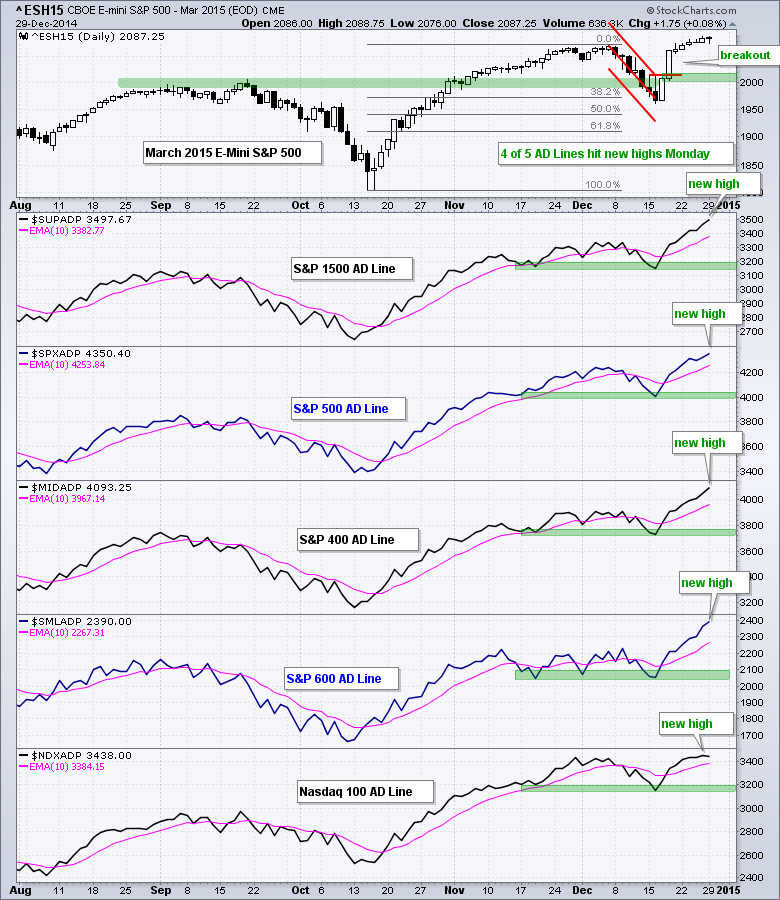
S&P 500 Does Battle with a Big Round Number
by Arthur Hill,
Chief Technical Strategist, TrendInvestorPro.com
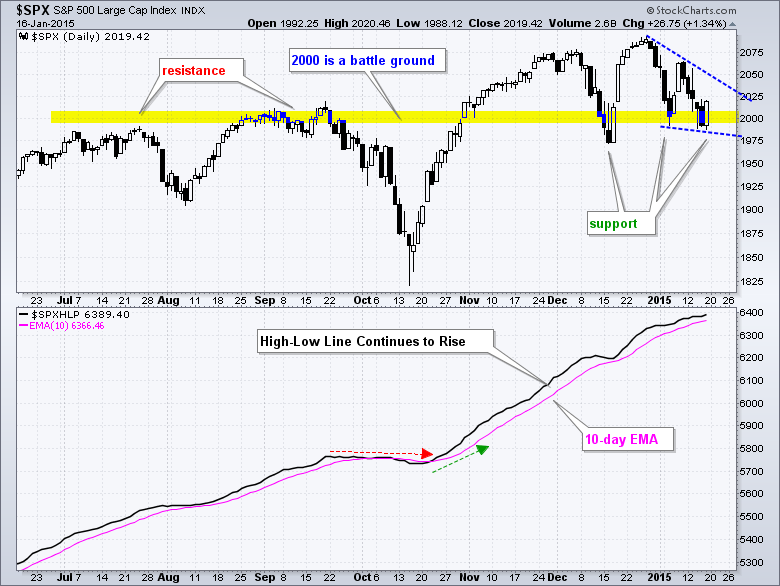
Even though big round numbers should not have any technical significance, it is hard to argue with the magnetic pull of 2000 on the S&P 500. The index first neared 2000 when it broke above 1975 in July. After a pullback to the 1900 area in early August,...
READ MORE
MEMBERS ONLY
Breadth, Risk Indicators and Short-Term Trend Analysis
by Arthur Hill,
Chief Technical Strategist, TrendInvestorPro.com
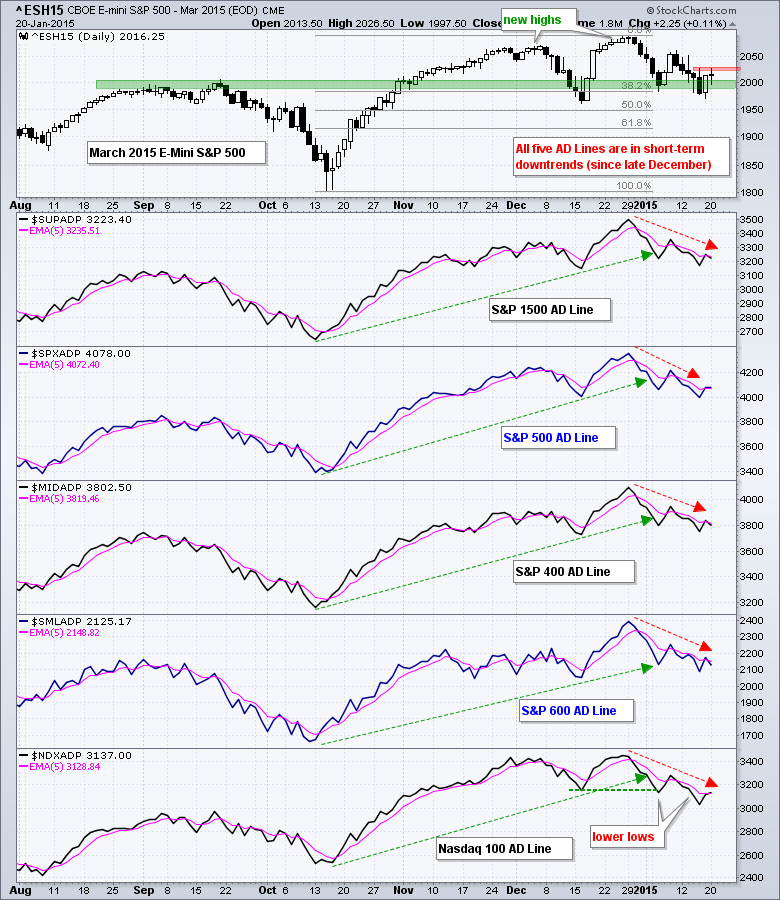
Stocks tried to bounce on Thursday, but selling pressure soon took over and the major index ETFs closed with losses again. Small-caps and large techs led the way as IWM fell 1.69% and QQQ declined 1.30%. Eight of nine sectors were down with consumer discretionary, technology, finance, energy...
READ MORE
MEMBERS ONLY
Consumer Discretionary Sector Turns Deep Red, But Utilities See Green
by Arthur Hill,
Chief Technical Strategist, TrendInvestorPro.com
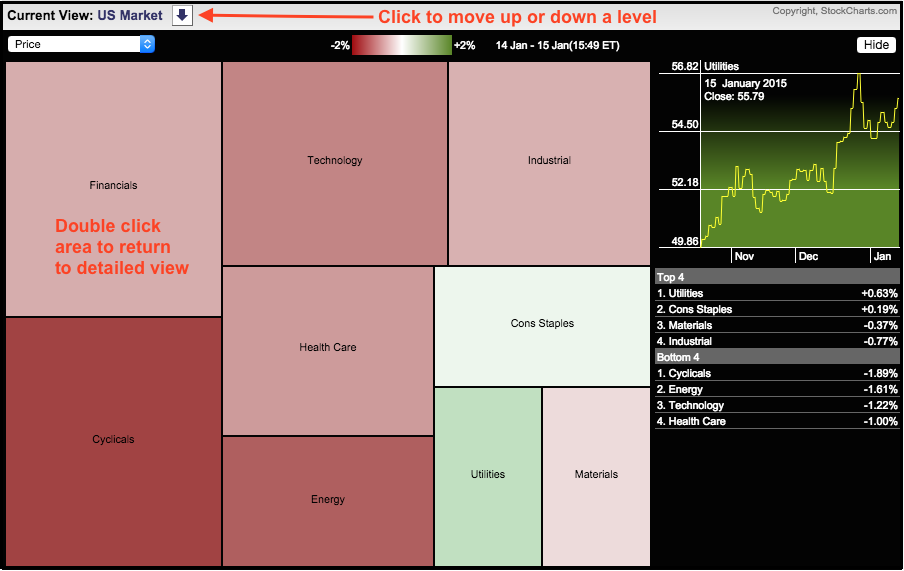
The Sector MarketCarpet shows serious selling pressure in the consumer discretionary (cyclical), energy and technology sectors on Thursday because they are the deepest red. In contrast, the utilities sector is bright green because utility stocks advanced as money sought yield. The consumer staples sector also attracted some buying interest because...
READ MORE
MEMBERS ONLY
Breadth, Risk Indicators and Short-Term Trend Analysis
by Arthur Hill,
Chief Technical Strategist, TrendInvestorPro.com
Stocks started the day under selling pressure as the major index ETFs gapped down on the open. Selling pressure continued into the afternoon, but buyers stepped in around 2PM and pushed stocks off their lows. This bounce was too little too late because SPY did not fill its opening gap....
READ MORE
MEMBERS ONLY
SPY and QQQ Give Up their Gaps - IWM Shows Relative Strength
by Arthur Hill,
Chief Technical Strategist, TrendInvestorPro.com
Stocks surged in early trading, worked their way lower in mid morning and then plunged after lunch. With a small rebound in the final hour, the net losses were reduced and the major index ETFs closed fractionally lower. The Russell 2000 held up the best and closed fractionally higher. Energy,...
READ MORE
MEMBERS ONLY
SPY and IWM Hit a Moment-of-Truth - TLT Hits New High
by Arthur Hill,
Chief Technical Strategist, TrendInvestorPro.com
Stocks opened weak with a sharp decline in the first 30 minutes and then traded flat the rest of the day. Even though stocks managed to firm after early weakness, buyers held back and the major index ETFs closed with modest losses. Oil got the blame again as crude fell...
READ MORE
MEMBERS ONLY
Sector PerfChart Shows A Defensive Start to 2015
by Arthur Hill,
Chief Technical Strategist, TrendInvestorPro.com
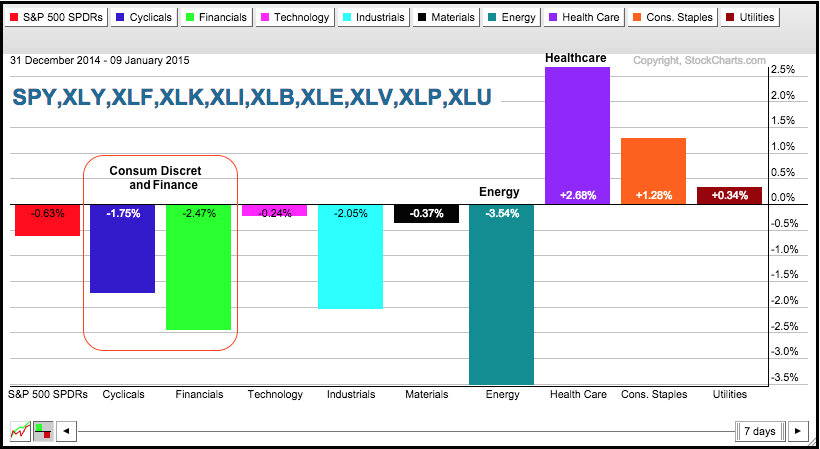
The sector PerfChart shows year-to-date performance for the nine sector SPDRs and SPY. Three sectors are up, six are down and SPY is down fractionally. The HealthCare SPDR (XLV) was the second best performing sector in 2014 and it is the best performing sector so far this year. The Energy...
READ MORE
MEMBERS ONLY
SPY and QQQ Hold Their Gaps - GLD Breaks Flag Trendline
by Arthur Hill,
Chief Technical Strategist, TrendInvestorPro.com
It was a pretty wild week as stocks plunged Monday-Tuesday, surged Wednesday-Thursday and fell back on Friday. After all the pushing and shoving, the major index ETFs ended with small losses for the week. Well, IWM lost 1.14%, which is a modest loss. Energy, industrials and finance weighed on...
READ MORE
MEMBERS ONLY
Microsoft Forms Second Candlestick Reversal in Four Weeks
by Arthur Hill,
Chief Technical Strategist, TrendInvestorPro.com
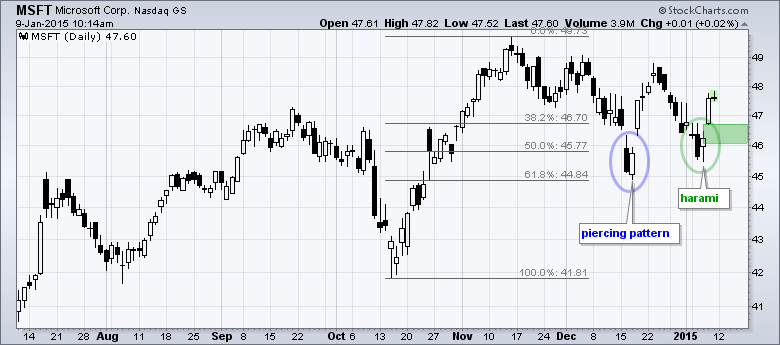
Microsoft (MSFT) sprang to life with a harami on Tuesday-Wednesday and a gap up on Thursday. This gap confirmed the harami and should be considered bullish as long as it holds. A move back below 46 would fill the gap and negate this reversal. Note that the long-term trend is...
READ MORE
MEMBERS ONLY
SPY Breaks out of Raff Channel - GLD Forms Small Flag
by Arthur Hill,
Chief Technical Strategist, TrendInvestorPro.com
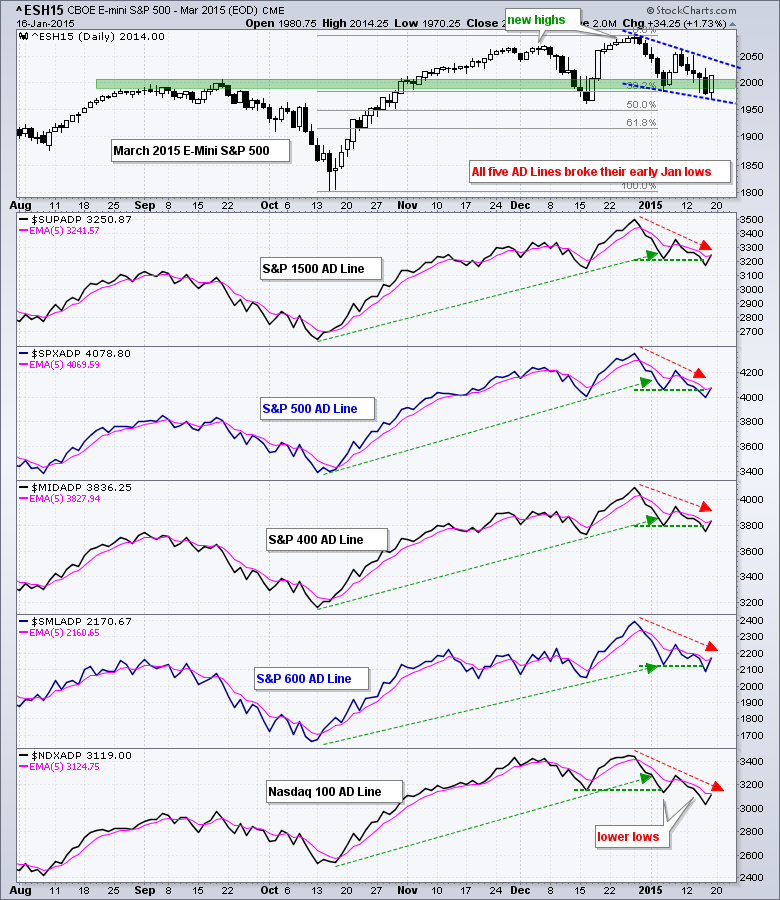
It is just like mid December as SPY, IWM and QQQ fell sharply and then suddenly reversed with a two-day surge. As with mid December, traders not getting in before the gap are now stuck wondering how to play this reversal, especially with the employment report on deck this morning....
READ MORE
MEMBERS ONLY
Oversold Bounce Materializes, but Short-Term Downtrends Remain
by Arthur Hill,
Chief Technical Strategist, TrendInvestorPro.com
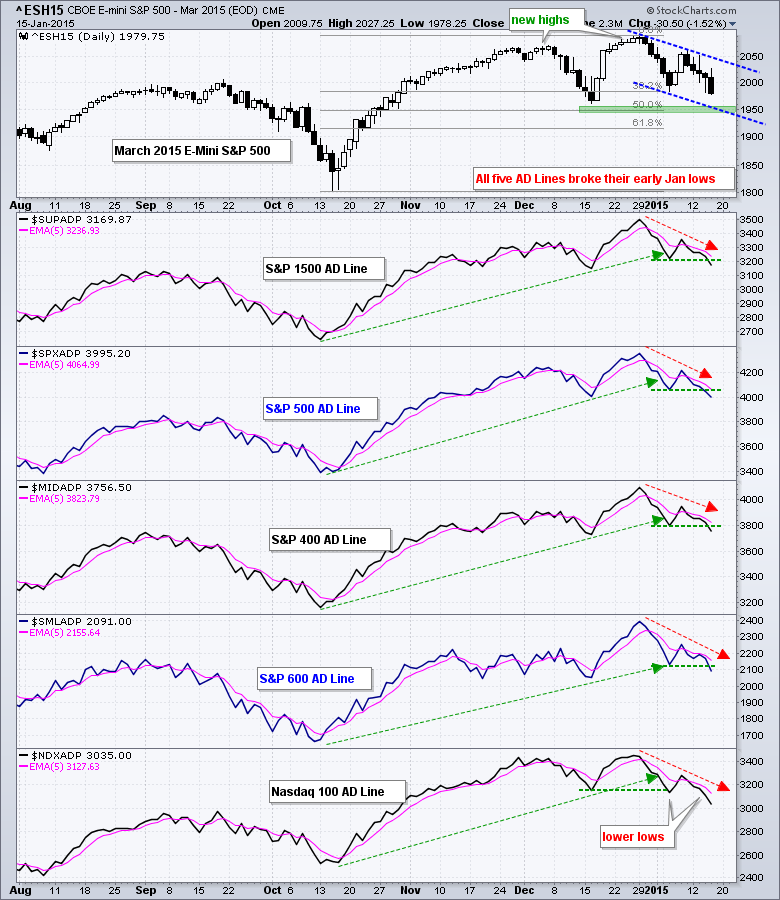
Stocks finally got an oversold bounce and even closed strong. Most of the bounce occurred with a morning pop, but SPY, IWM and QQQ managed to add to these early gains. In particular, IWM got a late surge and closed near the high of the day. SPY and QQQ closed...
READ MORE
MEMBERS ONLY
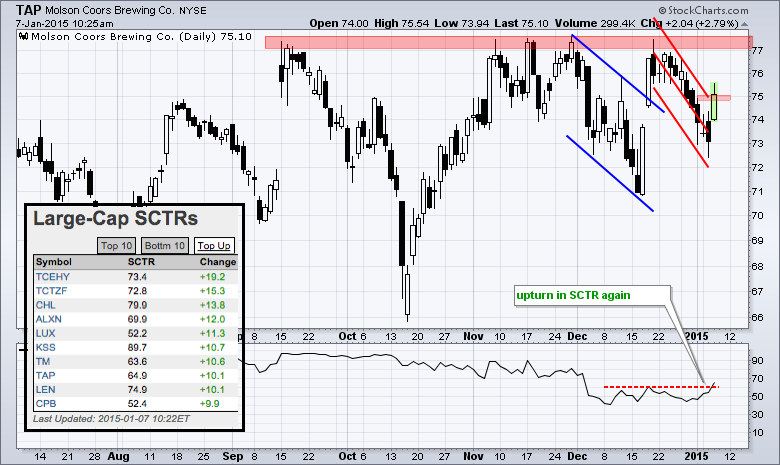
SCTR Surges for Molson Coors
by Arthur Hill,
Chief Technical Strategist, TrendInvestorPro.com
StockCharts users can view the StockCharts Technical Rank (SCTR) tables on the home page and even focus on the big movers by clicking the "top up" tab. I noticed Molson Coors (TAP) with a big move and interesting chart. The stock, which is part of the consumer staples...
READ MORE
MEMBERS ONLY
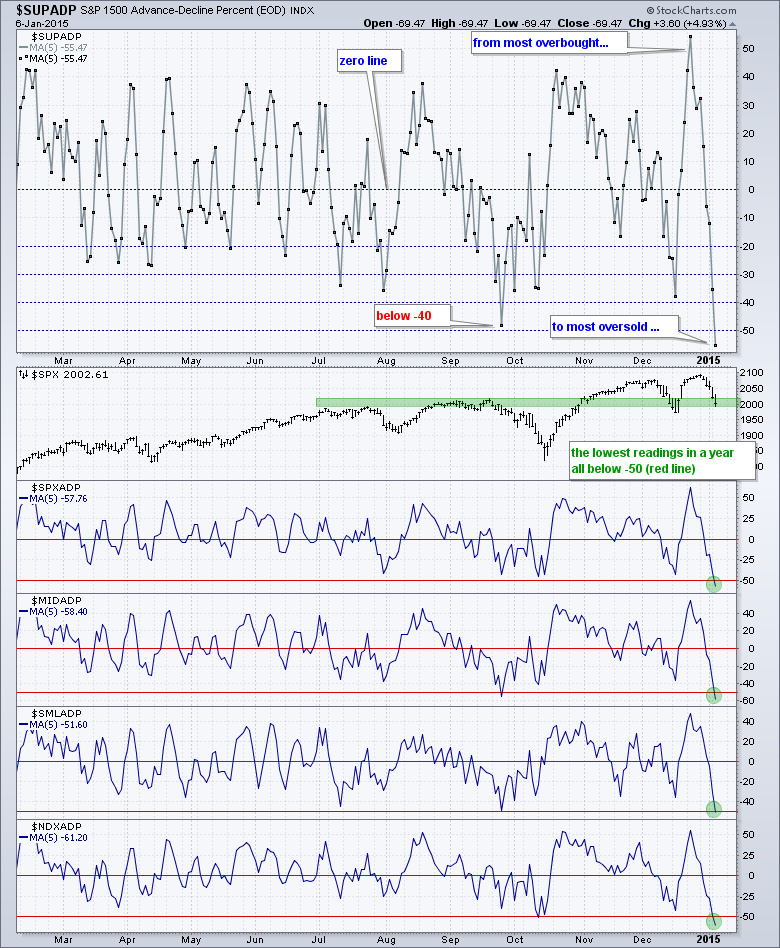
Breadth Indicators Hit Extremes on Both Sides
by Arthur Hill,
Chief Technical Strategist, TrendInvestorPro.com
Stocks took it on the chin again with small-caps leading the way lower. IWM fell 1.73%, QQQ lost 1.34% and SPY declined .94%. All three are down over 4% the last five days and short-term oversold. It was clearly a risk off day as the 20+ YR T-Bond...
READ MORE
MEMBERS ONLY
IWM Shows Relative Strength, but QQQ Shows Relative Weakness
by Arthur Hill,
Chief Technical Strategist, TrendInvestorPro.com
Stocks ended the year weak and started the year weak with Greece and oil getting most of the blame. Light Crude fell below $50 and energy stocks got hammered. European stocks plunged on fears of a Greek exit, and Japan followed suit today with a 3% decline. I am not...
READ MORE
MEMBERS ONLY
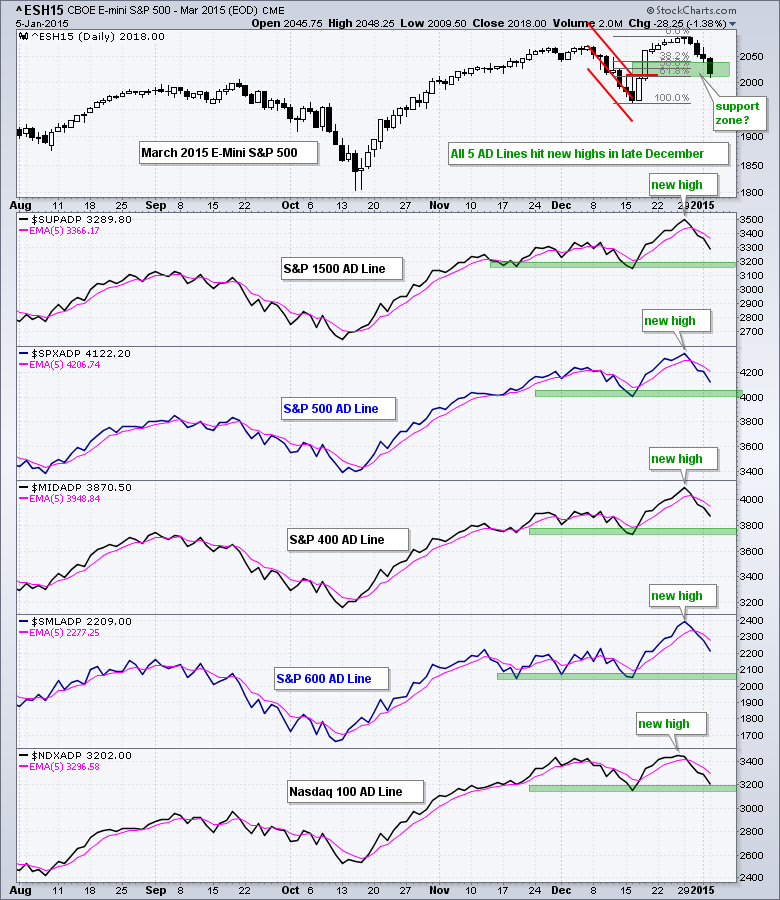
IWM Tests Top of Support Zone - GLD Turns Volatile
by Arthur Hill,
Chief Technical Strategist, TrendInvestorPro.com
Stocks got the Santa Claus rally, but it fizzled after Christmas and selling pressure took hold over the last three trading days. After a big advance from 17 to 29 December, the stock market was entitled to a pullback. The major index ETFs are now trading in big support zones...
READ MORE
MEMBERS ONLY
Russell 2000 Survives Bollinger Band Head Fake
by Arthur Hill,
Chief Technical Strategist, TrendInvestorPro.com
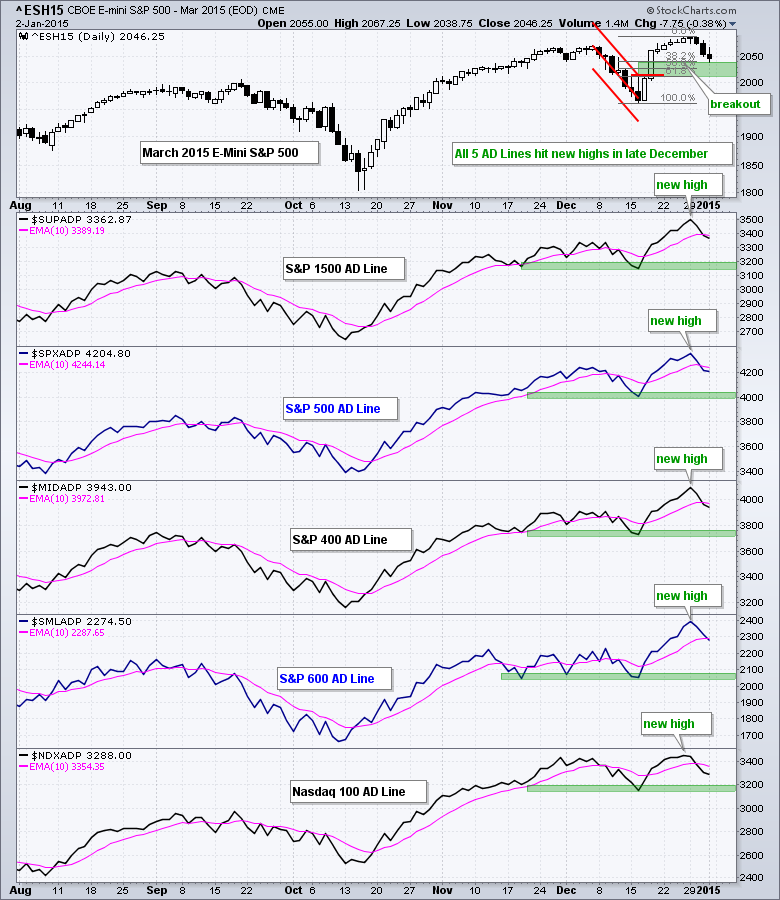
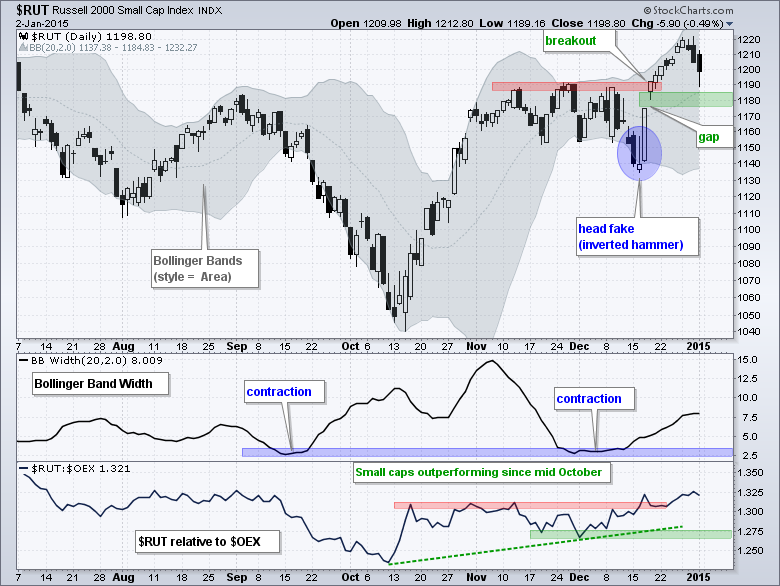
A month ago in ChartWatchers I wrote about the bullish seasonal pattern for small-caps and featured a big flag pattern on the chart for the Russell 2000 ETF. Trading turned volatile in mid December, but the bullish seasonal pattern held up and the Santa Claus rally ultimately materialized. The Russell...
READ MORE
MEMBERS ONLY
Home Construction and Retail Finish the Year Strong
by Arthur Hill,
Chief Technical Strategist, TrendInvestorPro.com
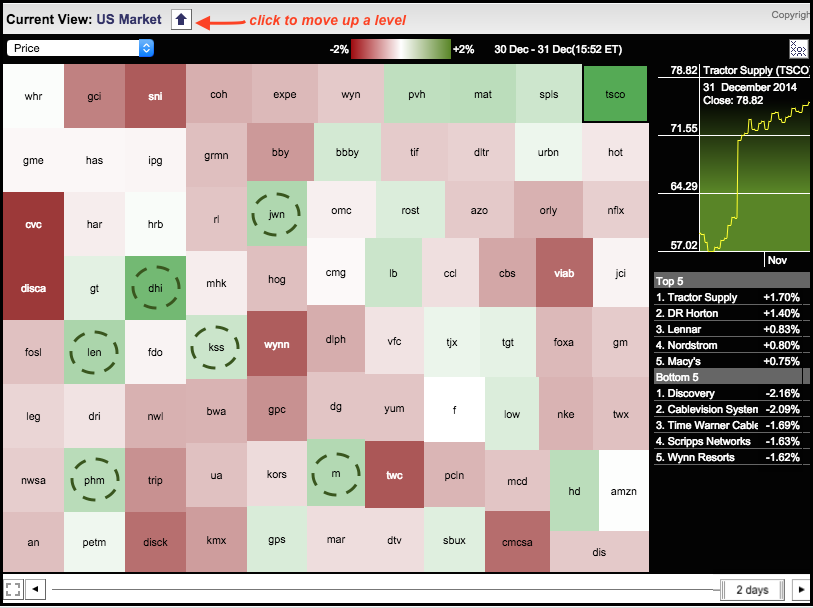
The S&P 500 took a dip on the last trading day of 2014, but several home construction and retail stocks bucked the selling pressure. Chartists can easily separate the winners and losers using the Sector Market Carpet. The image below focuses on the cyclicals (consumer discretionary) sector and...
READ MORE
MEMBERS ONLY
FLEX Forms Big Continuation Pattern
by Arthur Hill,
Chief Technical Strategist, TrendInvestorPro.com
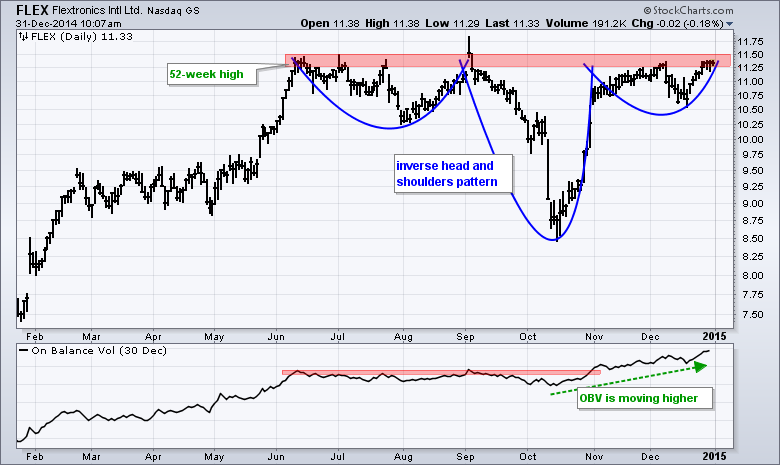
Flextronics (FLEX) hit a 52-week high in June and then formed an extended consolidation that looks like an inverse head-and-shoulders pattern. It is not picture perfect, but the "essence" of the pattern is there. There is a prior uptrend, a left shoulder dip, a deeper dip for the...
READ MORE
MEMBERS ONLY
USO Breaks Down Again - TLT Surges off Support
by Arthur Hill,
Chief Technical Strategist, TrendInvestorPro.com
Stocks were mixed on Monday. The Russell 2000 iShares and S&P MidCap SPDR led with modest gains, while the Dow Diamonds and Nasdaq 100 ETF lagged with fractional losses. Consumer staples and technology were weak. Utilities and consumer discretionary were strong. The Utilities SPDR has been on a...
READ MORE
MEMBERS ONLY
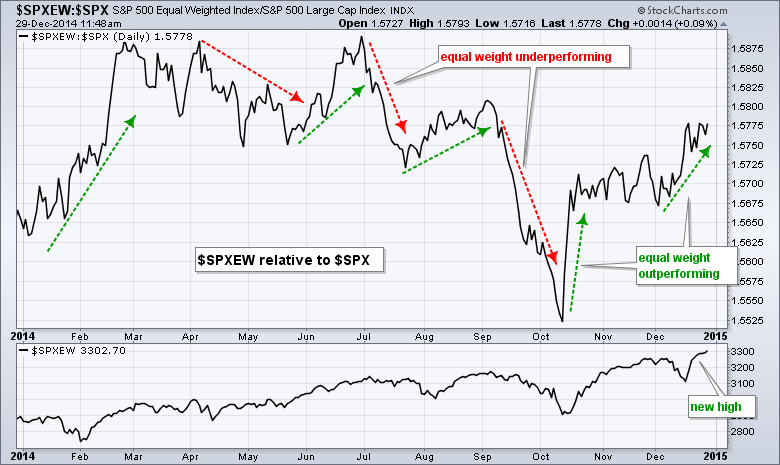
Equal-weight S&P 500 Outperforming Cap-weight S&P 500
by Arthur Hill,
Chief Technical Strategist, TrendInvestorPro.com
The chart below shows the ratio of the S&P 500 Equal-Weight Index to the S&P 500 ($SPXEW:$SPX). Also known as the price relative, this ratio chart compares the performance of the S&P 500 Equal-Weight Index to the S&P 500. $SPXEW outperforms...
READ MORE
MEMBERS ONLY
Stocks Outperforming Bonds - GLD Gets Oversold Bounce
by Arthur Hill,
Chief Technical Strategist, TrendInvestorPro.com
Stocks continued higher in slow trading last week, which is pretty typical for yearend price action. The existing trend is up and prices extend in the direction of the existing trend, but in a much slower manner. Even though it is hard to read into low-volume price movements during a...
READ MORE
MEMBERS ONLY
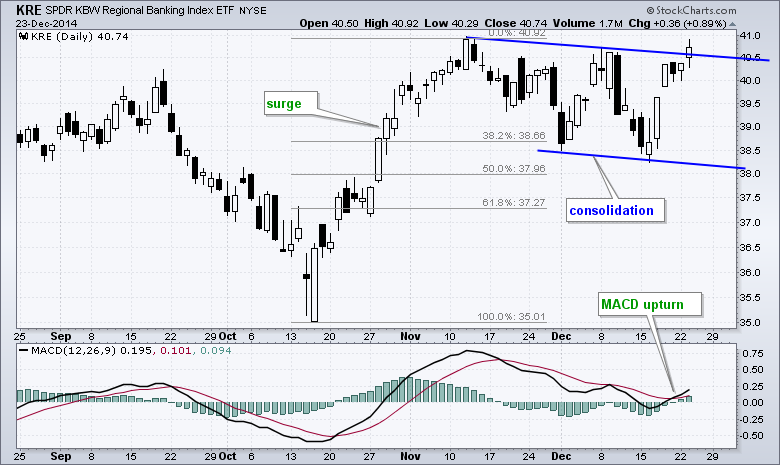
Regional Bank SPDR Goes for a Breakout
by Arthur Hill,
Chief Technical Strategist, TrendInvestorPro.com
The Regional Bank SPDR (KRE) is showing potential with a break above the flag trend line. Notice how the ETF surged and then corrected with the falling flag. This correction alleviated overbought conditions from mid November and the breakout signals a continuation of the prior surge. The indicator window shows...
READ MORE