MEMBERS ONLY
IWM Tests Support and Shows Relative Strength
by Arthur Hill,
Chief Technical Strategist, TrendInvestorPro.com
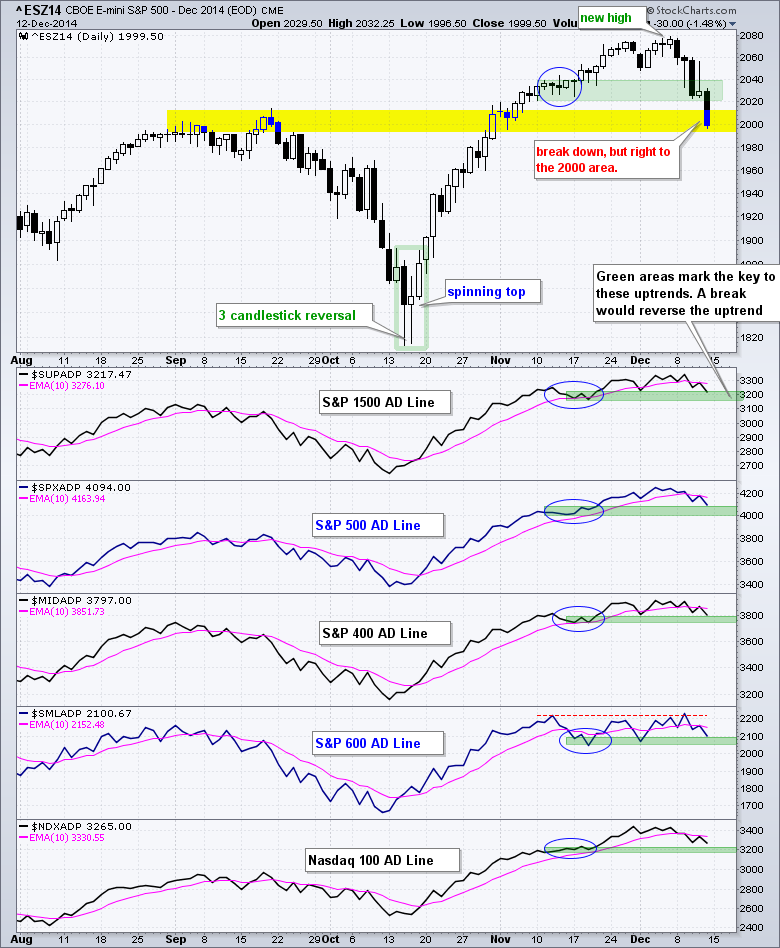
Stocks fell sharply last week as the S&P 500 suffered its largest weekly decline since May 2012. This was also the fifth weekly decline greater than 2.5% this year. Note that the prior four declines did not derail the bull market because the S&P 500...
READ MORE
MEMBERS ONLY
Good News Fails to Inspire Stocks - GLD Forms a Bull Flag
by Arthur Hill,
Chief Technical Strategist, TrendInvestorPro.com
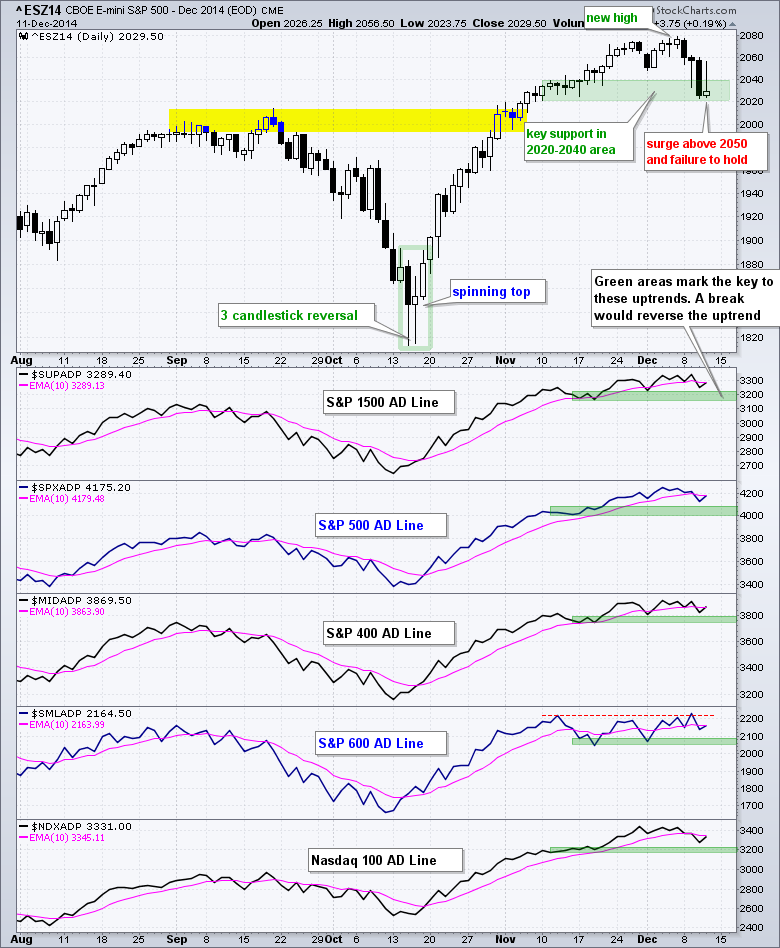
Stocks got good news with the employment report last Friday and the bounce was rather tepid. Stocks got more good news with retail sales on Thursday, but failed to hold the bounce. The inability to rise in the face of good news is negative. Perhaps the stock market is starting...
READ MORE
MEMBERS ONLY
LinkedIn Tests Breakout and Gap Zone
by Arthur Hill,
Chief Technical Strategist, TrendInvestorPro.com
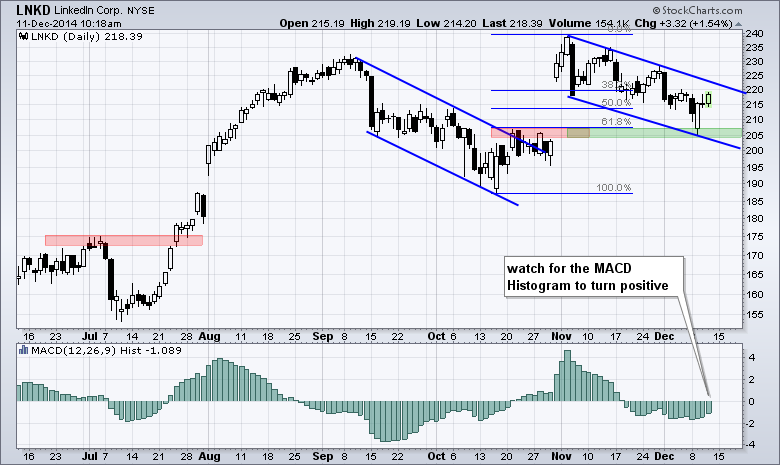
LinkedIn broke out and surged to a new high in early November, and then corrected the last five weeks with a falling channel. This channel retraced 62% of the prior surge and almost filled the gap, but didn't. Throw in support from broken resistance in the 205 area,...
READ MORE
MEMBERS ONLY
A Key Test for SPY and QQQ - Plus CVT, MBLY, RF, STLD
by Arthur Hill,
Chief Technical Strategist, TrendInvestorPro.com
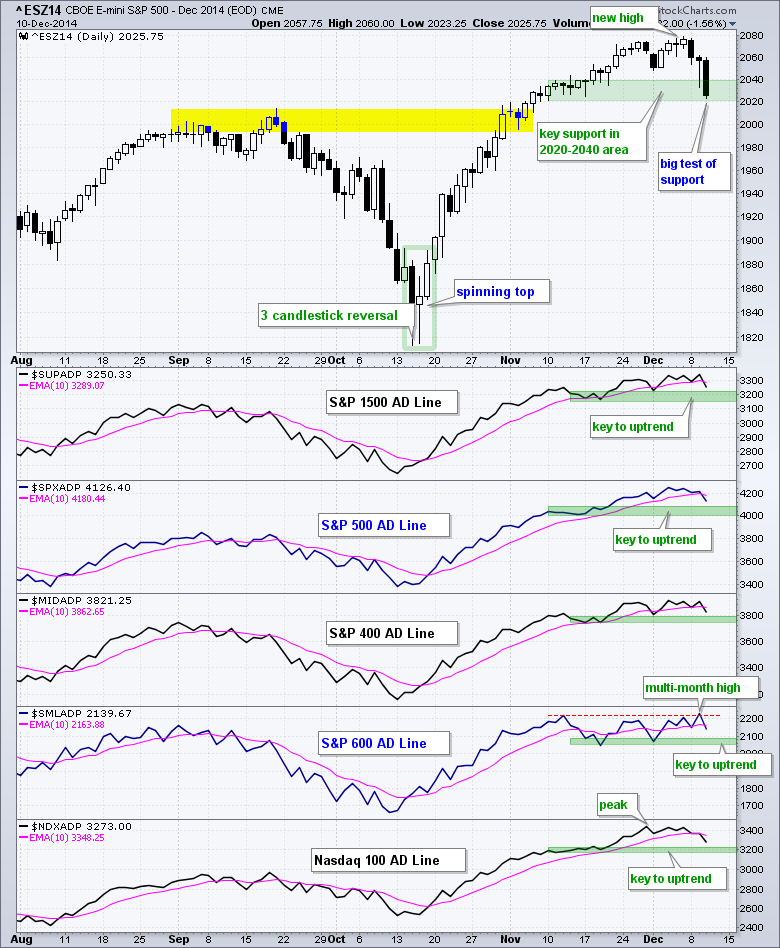
There are plenty of reasons for Wednesday's sell off: plunging oil, weakness in junk bonds, bank exposure to the energy sector, Greek drama and the usual Euro stuff. One thing was clear: there were more sellers than buyers on Wednesday. I do not know the reasons behind every...
READ MORE
MEMBERS ONLY
Small Caps are Starting to Outperform
by Arthur Hill,
Chief Technical Strategist, TrendInvestorPro.com
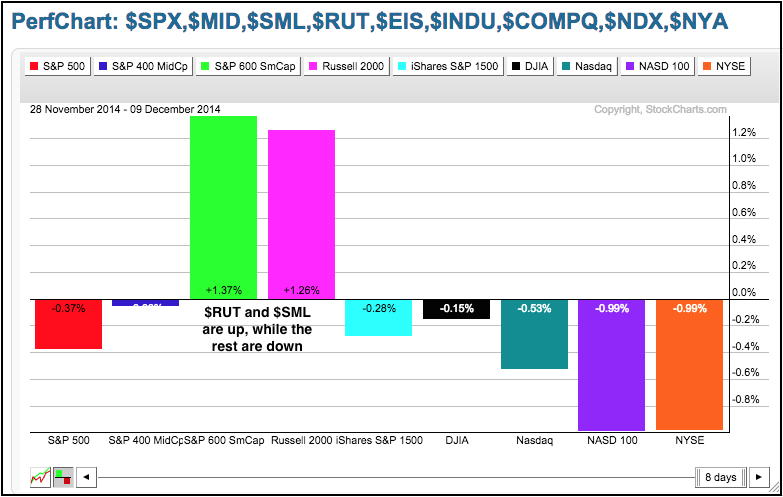
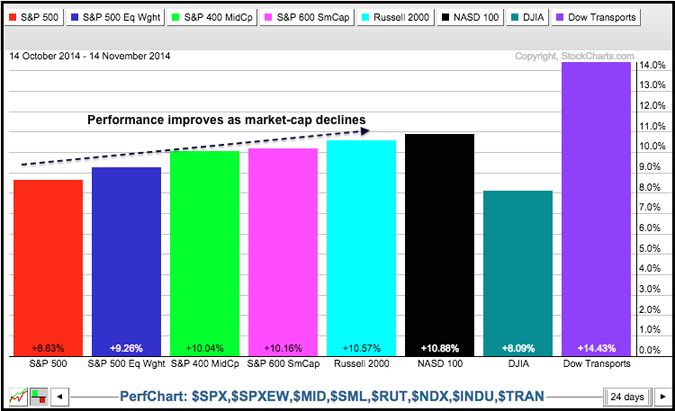
Small-caps are starting to live up to their reputation for outperformance in December. Even though the month is far from finished, the PerfChart below shows the Russell 2000 and the S&P Small-Cap 600 with 1+ percent gains so far. In contrast, the other seven indices are...
READ MORE
MEMBERS ONLY
IWM Challenges Again - Small-Cap Breadth Surges
by Arthur Hill,
Chief Technical Strategist, TrendInvestorPro.com
The major index ETFs were mixed on Tuesday, but the leadership role flipped in favor of small-caps. DIA, SPY and QQQ moved lower, while IWM and IJR edged higher. Moreover, small-caps opened weak with the rest of the market and came roaring back once participants figured out that...
READ MORE
MEMBERS ONLY
IWM Swings To Support - GLD Gets a Wedge Break - Plus AWI, BWA, CBS, SCCO
by Arthur Hill,
Chief Technical Strategist, TrendInvestorPro.com
Stocks moved lower on Monday with small-caps and energy shares leading the way. The Russell 2000 iShares (IWM) declined over 1% and the SmallCap Energy ETF (PSCE) declined over 7%. Even though the energy sector accounts for just 3.5% of IWM, an oversize decline like 7.6% will...
READ MORE
MEMBERS ONLY
IWM Extends Consolidation - Watching the Wedge in GLD
by Arthur Hill,
Chief Technical Strategist, TrendInvestorPro.com
Stocks got a big dose of good news on Friday as non-farm payrolls added over 300,000 for the second time this year. The employment report capped off a strong week for economic indicators. Despite a positive news week, stocks were quite flat and Friday's gains were...
READ MORE
MEMBERS ONLY
Small-caps Underperform Despite December Seasonal Pattern
by Arthur Hill,
Chief Technical Strategist, TrendInvestorPro.com
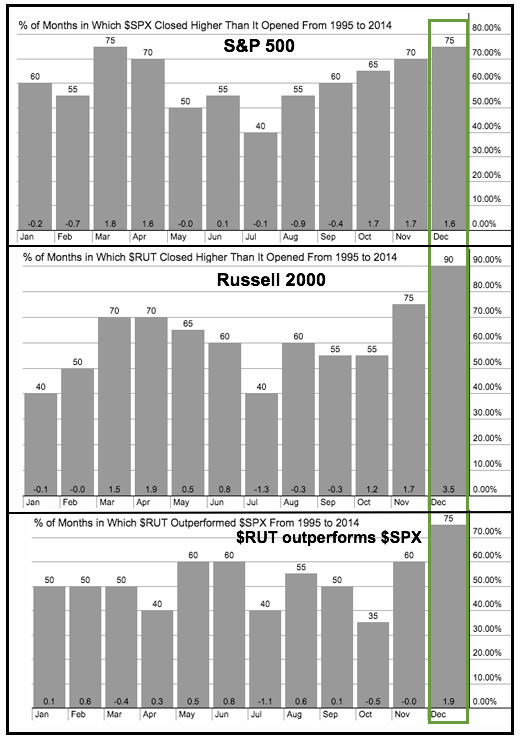
There are two bullish seasonal patterns at work right now. First, stocks have shown a strong tendency to advance in December. Second, small-caps have shown a strong tendency to outperform large-caps in December. Over the last twenty years, the S&P 500 has risen 75% of the...
READ MORE
MEMBERS ONLY
Russell MicroCap iShares Goes for P&F Breakout
by Arthur Hill,
Chief Technical Strategist, TrendInvestorPro.com
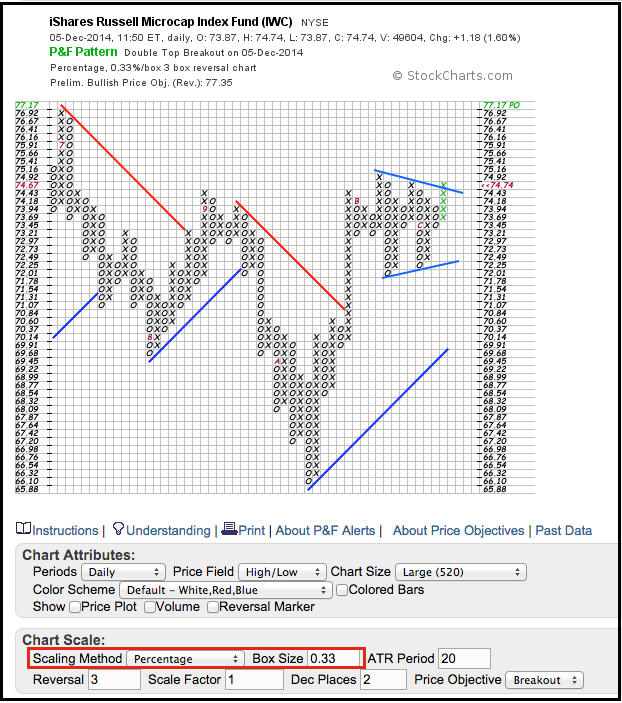
The Russell MicroCap iShares (IWC) is leading the market higher on Friday and breaking above a triangle trend line. The P&F chart shows the ETF surging in October and then consolidating in November. The red A marks the beginning of October and the red B marks the beginning...
READ MORE
MEMBERS ONLY
Stocks Stall in Uptrends - A Big Day for Treasury Bonds
by Arthur Hill,
Chief Technical Strategist, TrendInvestorPro.com
The market went into a risk-off mode on Thursday with the Russell 2000 iShares (IWM) losing .48% and the 20+ YR T-Bond ETF (TLT) surging .84% ahead of today's employment report. Even though the surge in Treasuries shows a certain flight to safety, I do not...
READ MORE
MEMBERS ONLY
Seasonality Tool Says 'Tis the Season
by Arthur Hill,
Chief Technical Strategist, TrendInvestorPro.com
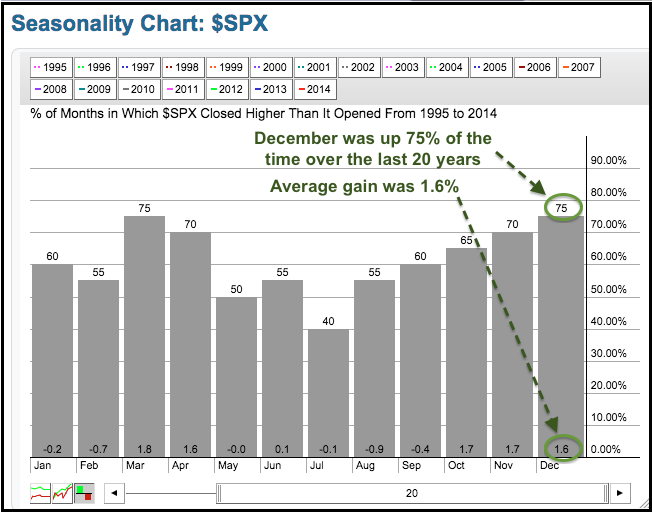
There has been a lot of chatter about the seasonal pattern for the S&P 500 in December, and it is bullish. StockCharts users do not need to rely on the chatter because they can chart seasonal patterns using our Seasonality Tool and see for themselves. The chart below...
READ MORE
MEMBERS ONLY
Three of Five AD Lines Hit New Highs - Plus ETFC, EXPE, FAST, HCBK, SCHW
by Arthur Hill,
Chief Technical Strategist, TrendInvestorPro.com
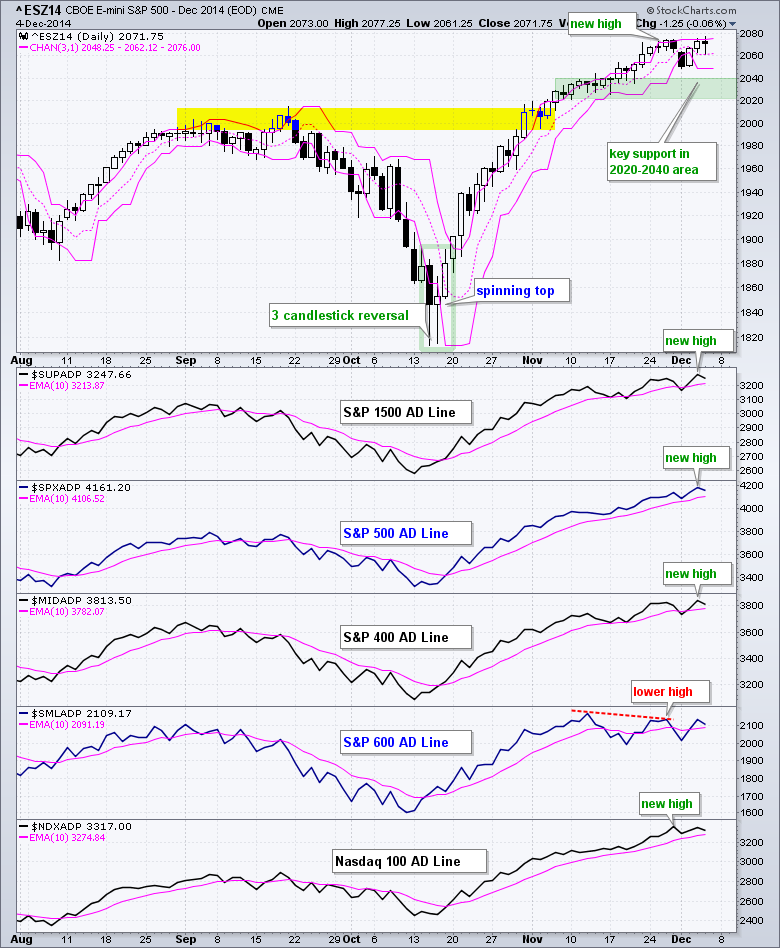
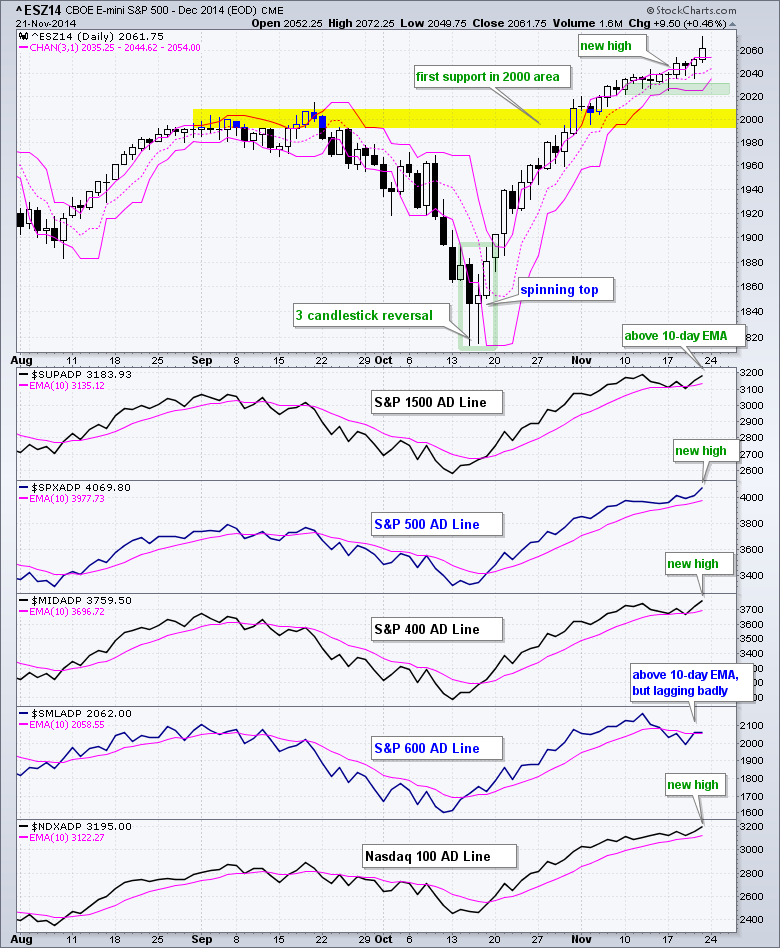
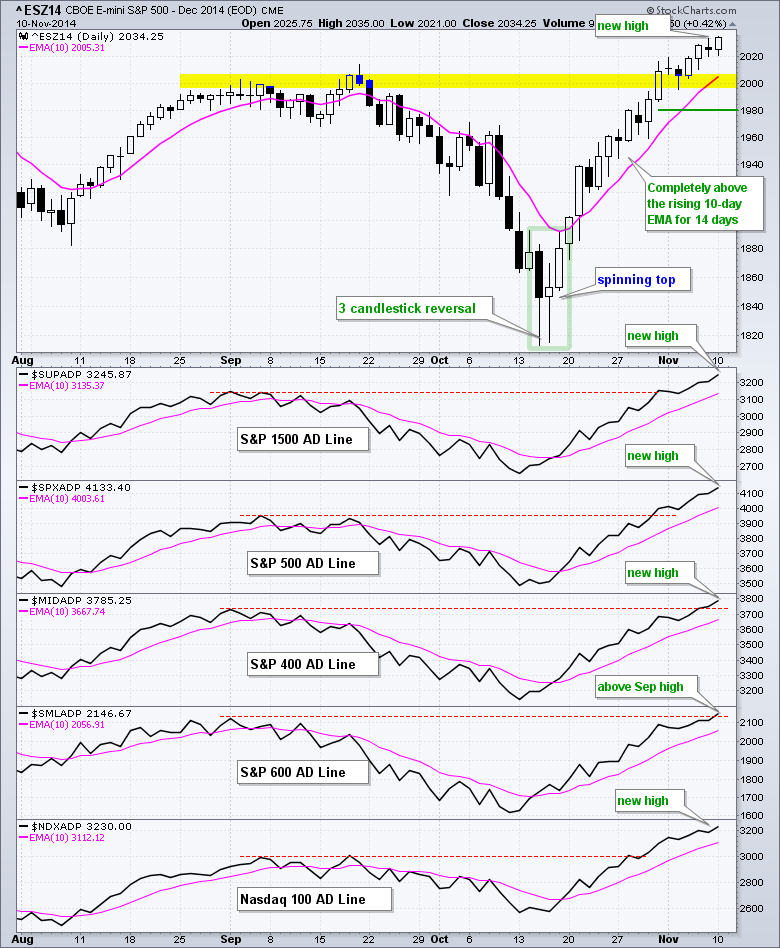
Stocks continued higher on Wednesday with small-caps leading for the second day running. Seven of nine sector SPDRs were higher with industrials, energy and materials leading. Energy is getting an oversold bounce, while industrials are showing some leadership as XLI nears a 52-week high. Tech stocks were helped...
READ MORE
MEMBERS ONLY
Small-Caps Bounce as Bonds Fall - UUP Hits New High
by Arthur Hill,
Chief Technical Strategist, TrendInvestorPro.com
Stocks rebounded with small-caps leading the way. SPY and QQQ finished with modest gains, while IWM jumped 1.2%. Despite one day of relative strength, small-caps still lag their large-cap brethren over the last few weeks. All nine sector SPDRs were up with finance, energy and healthcare...
READ MORE
MEMBERS ONLY
Broker-Dealer iShares Forms Classic Continuation Pattern
by Arthur Hill,
Chief Technical Strategist, TrendInvestorPro.com
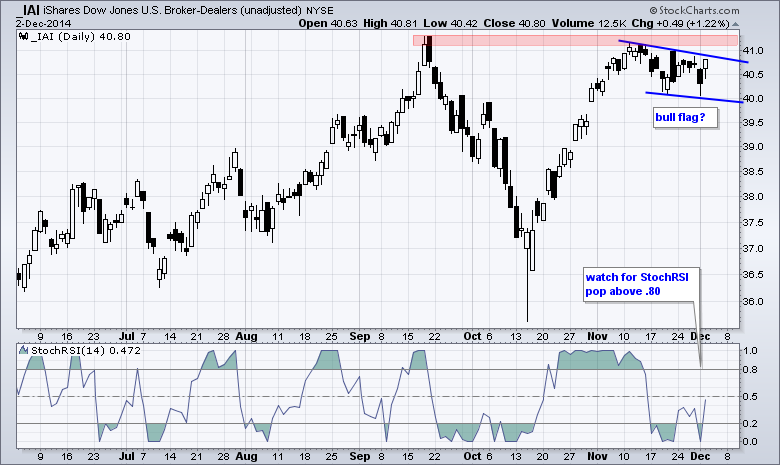
The Broker-Dealer iShares (IAI) surged to the September high and then stalled with a three week consolidation. With a downward slope, this consolidation looks like a falling flag, which is a bullish continuation pattern. A breakout at 41 would signal a continuation higher and project a move to new...
READ MORE
MEMBERS ONLY
Small-Caps Lead Pullback - Plus GILD and TMUS
by Arthur Hill,
Chief Technical Strategist, TrendInvestorPro.com
Stocks were mostly lower on Monday with small-caps and mid-caps leading the decline. Large-caps held up relatively well with SPY losing just .69% on the day. Retail stocks suffered a black Friday hangover as the Retail SPDR (XRT) fell over 2%. The ETF, however, was up some...
READ MORE
MEMBERS ONLY
Solar ETF Triggers Bearish Continuation Signal
by Arthur Hill,
Chief Technical Strategist, TrendInvestorPro.com
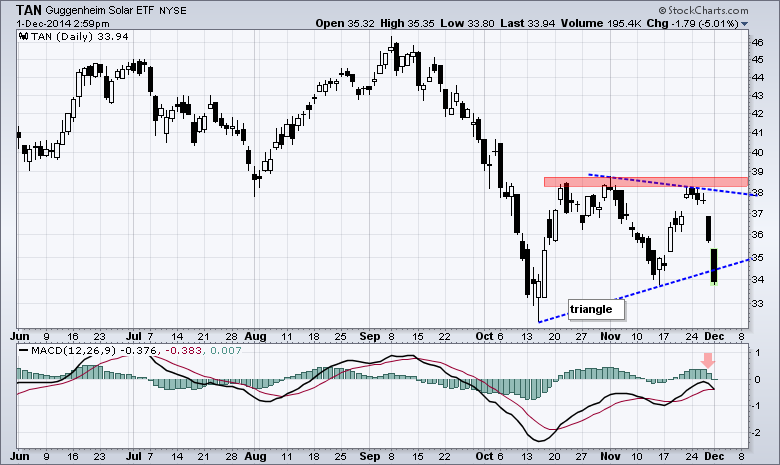
Lower energy prices may be making solar less competitive and putting pressure on solar-related stocks. The chart shows the Solar Energy ETF (TAN) breaking down in Sep-Oct, consolidating with a triangle and breaking triangle support with a sharp two-day decline. This break signals a continuation of the...
READ MORE
MEMBERS ONLY
An AD Line Diverges and Three Risk Indicators Turn Negative
by Arthur Hill,
Chief Technical Strategist, TrendInvestorPro.com
Stocks were hit with some selling pressure on Friday, but SPY ended the week with a small gain and QQQ ended the week at a new high. The gains continue to be incremental and the advance is slowing, but it is still an advance and selling pressure remains subdued in...
READ MORE
MEMBERS ONLY
XME Fails at Resistance and Lags Market
by Arthur Hill,
Chief Technical Strategist, TrendInvestorPro.com
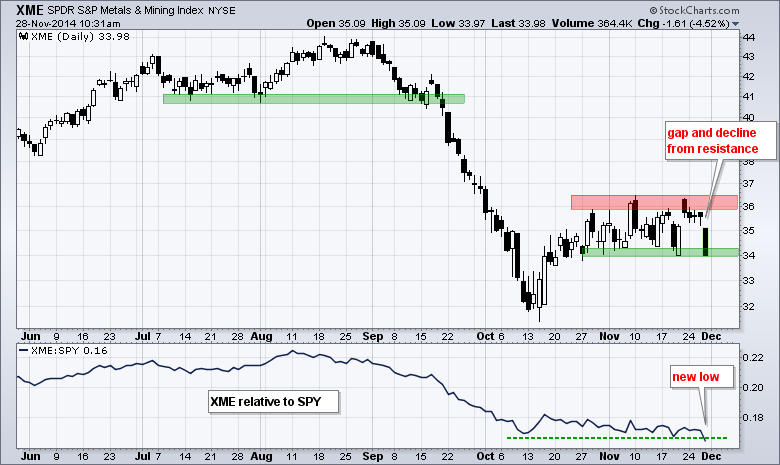
The Metals & Mining SPDR (XME) got a bounce with the stock market in the second half of October, but struggled in November with a trading range between 34 and 36.5. This struggle turned to weakness as the ETF gapped down on Friday and fell sharply. A follow through...
READ MORE
MEMBERS ONLY
The Noose Narrows on the Oil & Gas Equip & Services SPDR
by Arthur Hill,
Chief Technical Strategist, TrendInvestorPro.com
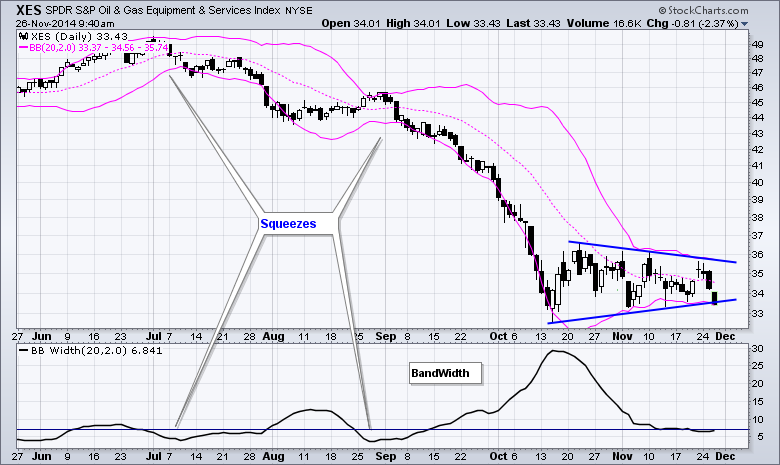
Oil remains weak overall and so do the energy related ETFs (XLE, XOP, XES). The chart below shows the Oil & Gas Equip & Services SPDR (XES) hitting a new low in October and then consolidating with a triangle. The pink lines show the Bollinger Bands narrowing like a noose...
READ MORE
MEMBERS ONLY
Fastenal Follows Through on Big Island Reversal
by Arthur Hill,
Chief Technical Strategist, TrendInvestorPro.com
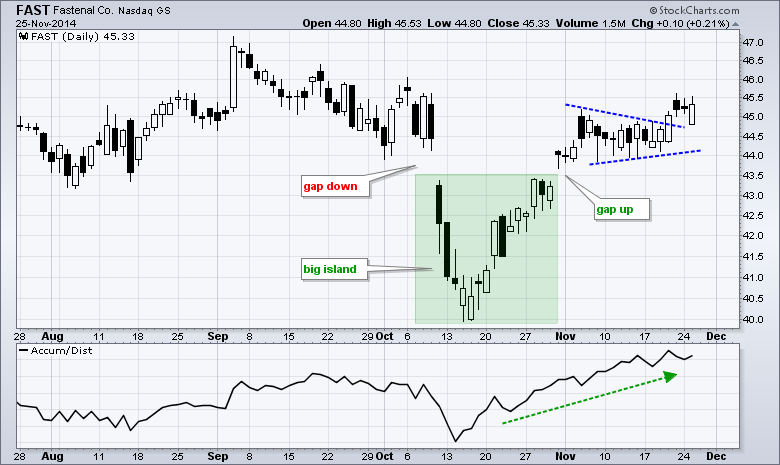
Fastenal continues to improve on the chart with two bullish patterns and signs of accumulation. First, a big island reversal formed at the stock gapped below 43.5 in early October and gapped back above this level in late October. Second, the stock broke pennant resistance with a move above...
READ MORE
MEMBERS ONLY
Three of Five Offensive Sectors Lead within Small Caps
by Arthur Hill,
Chief Technical Strategist, TrendInvestorPro.com
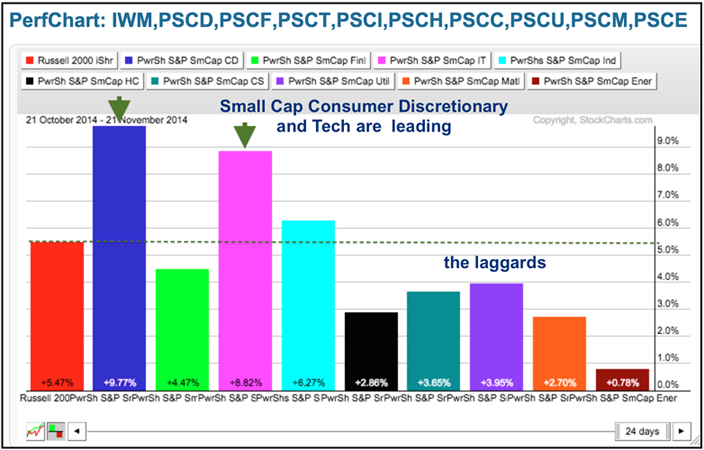
The PerfChart below shows the nine small-cap sector ETFs and the Russell 2000 iShares (IWM). Notice that the SmallCap Consumer Discretionary ETF (PSCD) and the SmallCap Technology ETF (PSCT) led over the last five days with bigger gains. Throw in the SmallCap Industrials ETF (PSCI) and three of the...
READ MORE
MEMBERS ONLY
Large-caps Rule, TLT Makes Breakout Bid and UUP Exits the Flag
by Arthur Hill,
Chief Technical Strategist, TrendInvestorPro.com
Stocks surged out of the gate on Friday, but fell back in the afternoon and closed off their highs. The action was mostly positive, but small-caps again underperformed as the S&P SmallCap iShares (IJR) closed fractionally lower. Large-caps still rule the rally. All sectors were up...
READ MORE
MEMBERS ONLY
Baby Steps, New Highs and Bullish Evidence
by Arthur Hill,
Chief Technical Strategist, TrendInvestorPro.com
Stocks continued to take baby steps higher with the S&P 500 and Dow Industrials closing at all time (closing) highs. Even though the Russell 2000 and S&P Small-Cap 600 remain below their prior highs, they are less than 4% from these highs and both formed...
READ MORE
MEMBERS ONLY
Big Blue Stays Red on the Relative Rotation Graph
by Arthur Hill,
Chief Technical Strategist, TrendInvestorPro.com
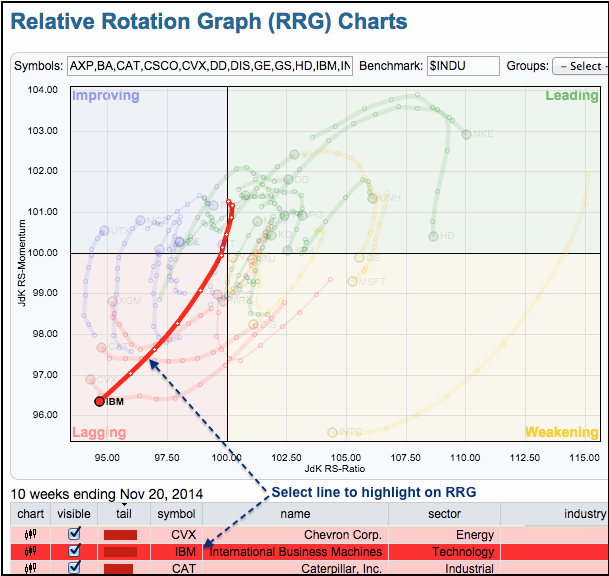
The S&P 500 is up over 7% the last five weeks, but IBM is down and flirting with new lows. The chart below shows the Relative Rotation Graph (RRG) with all thirty Dow stocks. With the Dow Industrials as the benchmark, we are seeing the relative performance rotations...
READ MORE
MEMBERS ONLY
Small-caps Continue to Underperform - Plus C, CAT, FAST, FB, IBM, X
by Arthur Hill,
Chief Technical Strategist, TrendInvestorPro.com
Small-caps weighed on the stock market again as IWM fell over 1%. Techs were also a bit weak with QQQ falling a half percent and SPY held up the best with a fractional loss. Despite a mixed and overbought stock market, there were some positive takeaways on Wednesday. The...
READ MORE
MEMBERS ONLY
Natural Gas and Coffee Lead ETF SCTRs with Big Moves
by Arthur Hill,
Chief Technical Strategist, TrendInvestorPro.com
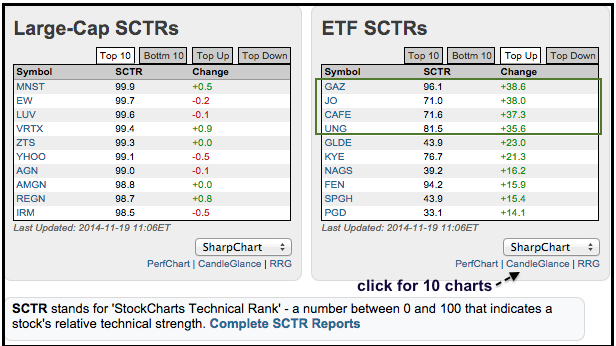
There is a little gem in the middle of the home page that shows the biggest moves for the StockCharts Technical Rank (SCTR). Clicking "Top Up" will show the biggest relative performance gainers, while clicking "Top Down" will show the biggest relative performance losers. Today we...
READ MORE
MEMBERS ONLY
Incremental Gains Continue - Bulk of Evidence Remains Bullish
by Arthur Hill,
Chief Technical Strategist, TrendInvestorPro.com
Stocks moved higher on Tuesday with the major index ETFs posting modest gains. Incremental gains are the hallmark of this advance since late October. SPY is up ten of the last twelve days and the total advance is around 2%. Sure, upside momentum is slowing and buying pressure is waning,...
READ MORE
MEMBERS ONLY
SPY Stalls, IWM Corrects and TLT Consolidates - Plus FAST, EXPR, UHS
by Arthur Hill,
Chief Technical Strategist, TrendInvestorPro.com
Stocks meandered again in mixed trading. Small-caps were weak as IWM fell .83%, but large-caps held firm as SPY and DIA closed with fractional gains. If you are looking for that small correction, look no further than small-caps because IWM is down around 2% in the last...
READ MORE
MEMBERS ONLY
One Stock in the Energy Sector Hit a New High This Month
by Arthur Hill,
Chief Technical Strategist, TrendInvestorPro.com
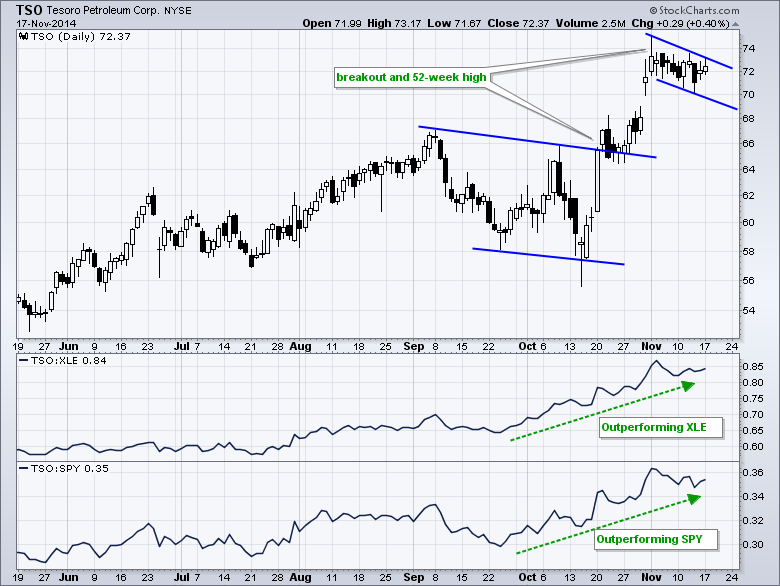
The Energy SPDR (XLE) is by far the weakest sector in the market right now. Most of its 43 components are in downtrends and well below the summer-autumn highs. One stock, however, stands out from this crowd. The chart below shows Tesoro (TSO) breaking out to new highs in...
READ MORE
MEMBERS ONLY
Signs of Weakness Creep into the Stock Market
by Arthur Hill,
Chief Technical Strategist, TrendInvestorPro.com
Stocks were mostly higher last week, but there were some pockets of weakness. QQQ led the broader market with a 1.59% gain and IWM lagged as the ETF fell a fraction (-.02%). The consumer discretionary and technology sectors gained and showed relative strength last week. The finance, energy and...
READ MORE
MEMBERS ONLY
Stock Indices may be Overbought, But They are by No Means Weak
by Arthur Hill,
Chief Technical Strategist, TrendInvestorPro.com
The stock market is in a clear uptrend, but is short-term overbought after a big run the last four weeks. I am assuming that the trend is up because the S&P 500, S&P 500 Equal-Weight Index, Dow Industrials, Dow Transports, Nasdaq 100 and Nasdaq...
READ MORE
MEMBERS ONLY
IWM and QQQ Hold Breakouts - GLD Forms Bearish Continuation Pattern
by Arthur Hill,
Chief Technical Strategist, TrendInvestorPro.com
Stocks finished very mixed on Thursday. DIA, QQQ and SPY finished with small gains, while IWM and IWC finished with modest losses. The Russell 2000 iShares (IWM) fell .85% and the Russell MicroCap iShares (IWC) was down 1.10%. Weakness in small-caps is the reason many breadth indicators were...
READ MORE
MEMBERS ONLY
The 20+ YR T-Bond ETF Gets the Squeeze
by Arthur Hill,
Chief Technical Strategist, TrendInvestorPro.com
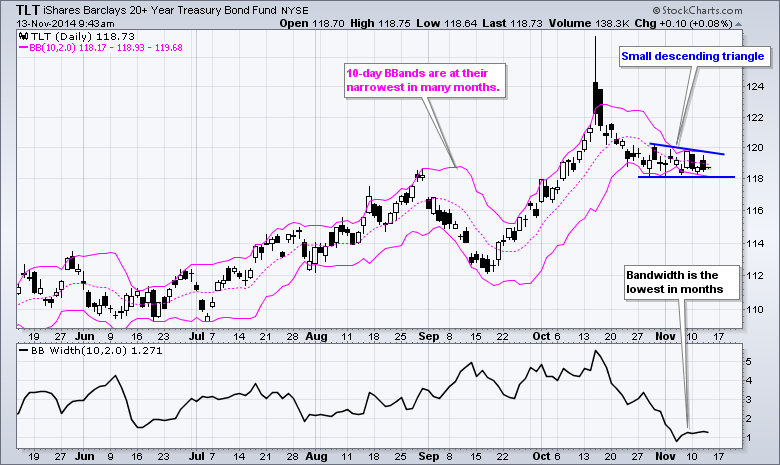
The 20+ YR T-Bond ETF (TLT) went ballistic in mid October with a surge above 125 and then sharply reversed with a close below 122 the next day. The ETF has since worked its way lower and volatility has seriously contracted. Notice that Bollinger BandWidth is at its lowest...
READ MORE
MEMBERS ONLY
Small-caps and Two Key Industry Group ETFs Take the Lead
by Arthur Hill,
Chief Technical Strategist, TrendInvestorPro.com
It was another lackluster day, but there were some notable pockets of strength. Small-caps perked up as the Russell 2000 iShares (+.45%) and S&P SmallCap iShares (+.68%) led the major index ETFs. The gains may be incremental, but they were gains and they were the leaders. The...
READ MORE
MEMBERS ONLY
Oil Citations and Sector Performance are Revealing
by Arthur Hill,
Chief Technical Strategist, TrendInvestorPro.com
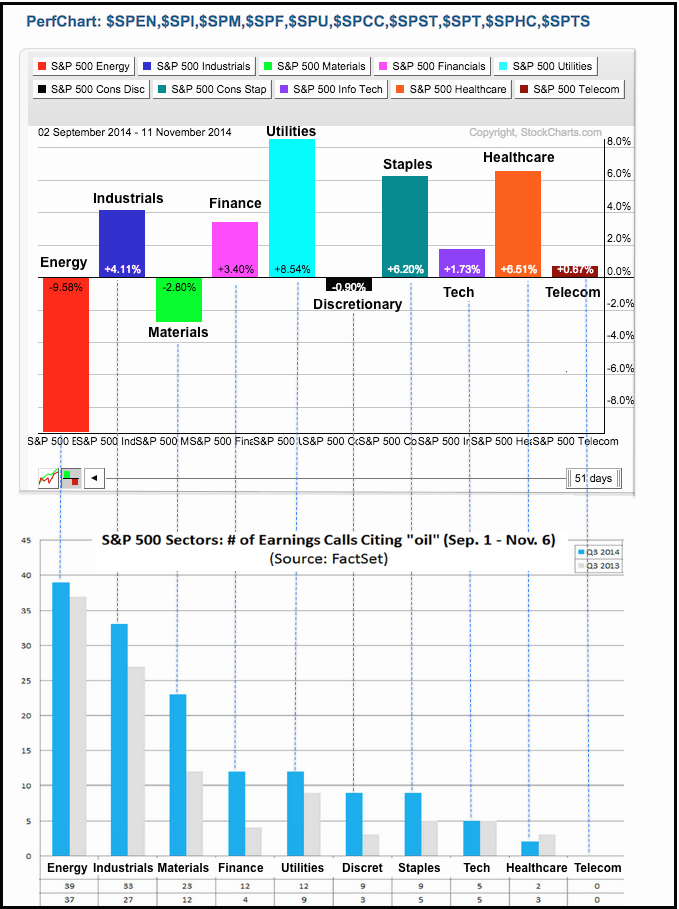
The top chart shows sector performance since the beginning of September. The bottom chart, from factset.com, shows the number of times companies in these sectors cited oil in their earnings calls (from 1-Sep to 6-Nov). Oil fell around 10% from mid June to late August and around...
READ MORE
MEMBERS ONLY
A Narrow Range Day Takes Shape - The Coil Tightens for TLT
by Arthur Hill,
Chief Technical Strategist, TrendInvestorPro.com
Trading was rather lackluster on Tuesday as the major index ETFs finished with fractional gains, and I do mean fractional. QQQ gained .31%, SPY rose .10% and IWM advanced .07%. Buying pressure is waning, but we have yet to see any significant selling pressure. Of note, the high-low range...
READ MORE
MEMBERS ONLY
Aroons Cross to Trigger a Signal in Tesla
by Arthur Hill,
Chief Technical Strategist, TrendInvestorPro.com
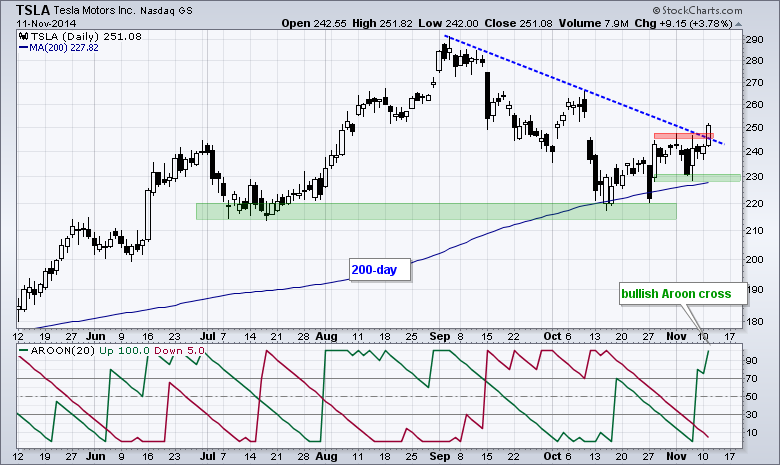
Tesla (TSLA) gapped down and fell sharply in early October, but ultimately held support from the July low and rising 200-day moving average. The stock moved higher the last four weeks and surged above the September trend line with a 3+ percent gain on Tuesday. Also notice that Aroon...
READ MORE
MEMBERS ONLY
Small-Cap AD Line Breaks Sep High - Plus COW, K, TSLA and UA
by Arthur Hill,
Chief Technical Strategist, TrendInvestorPro.com
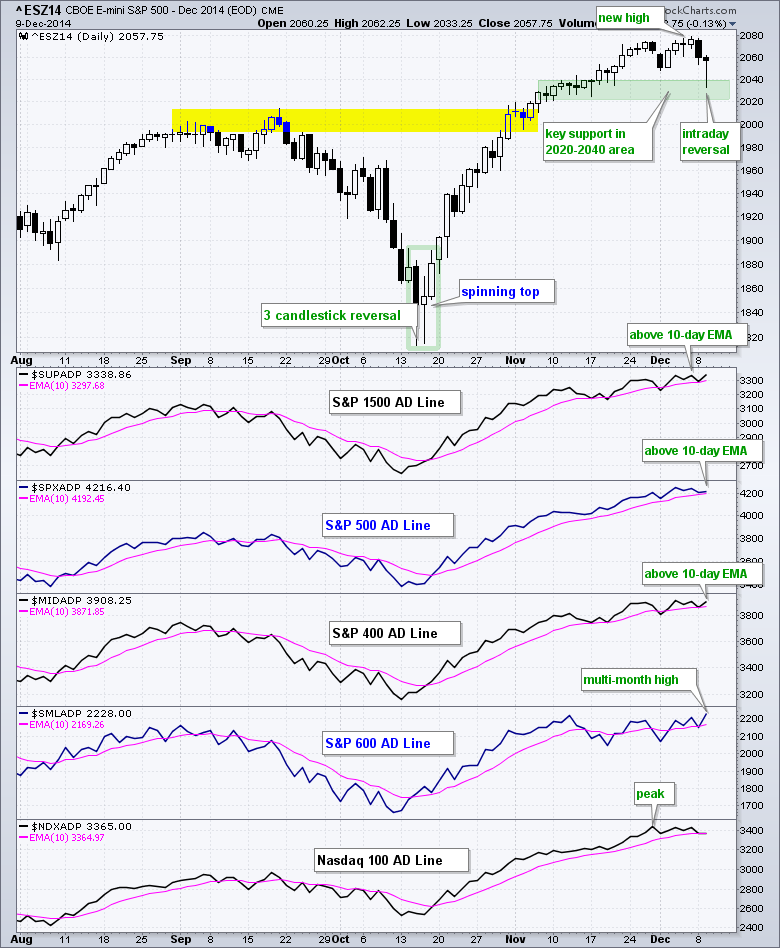
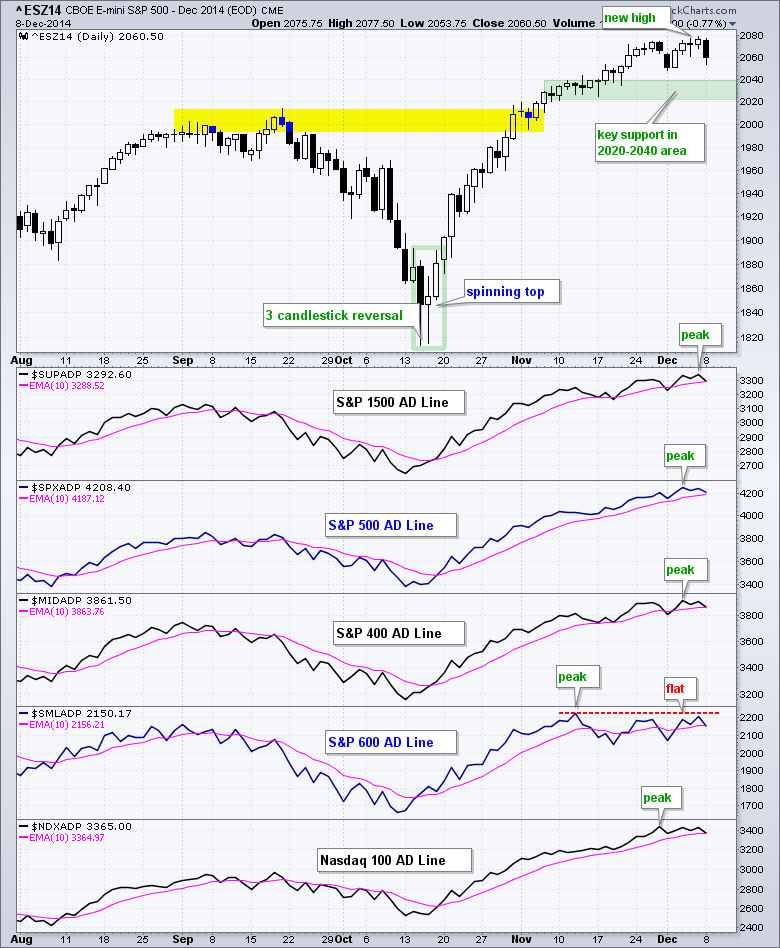
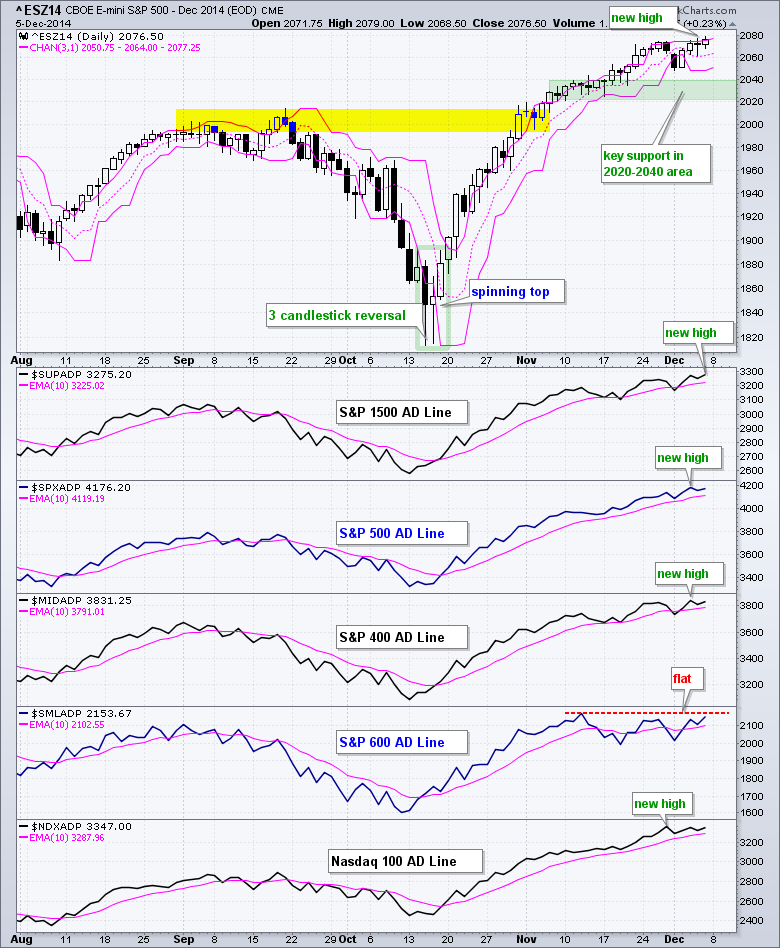
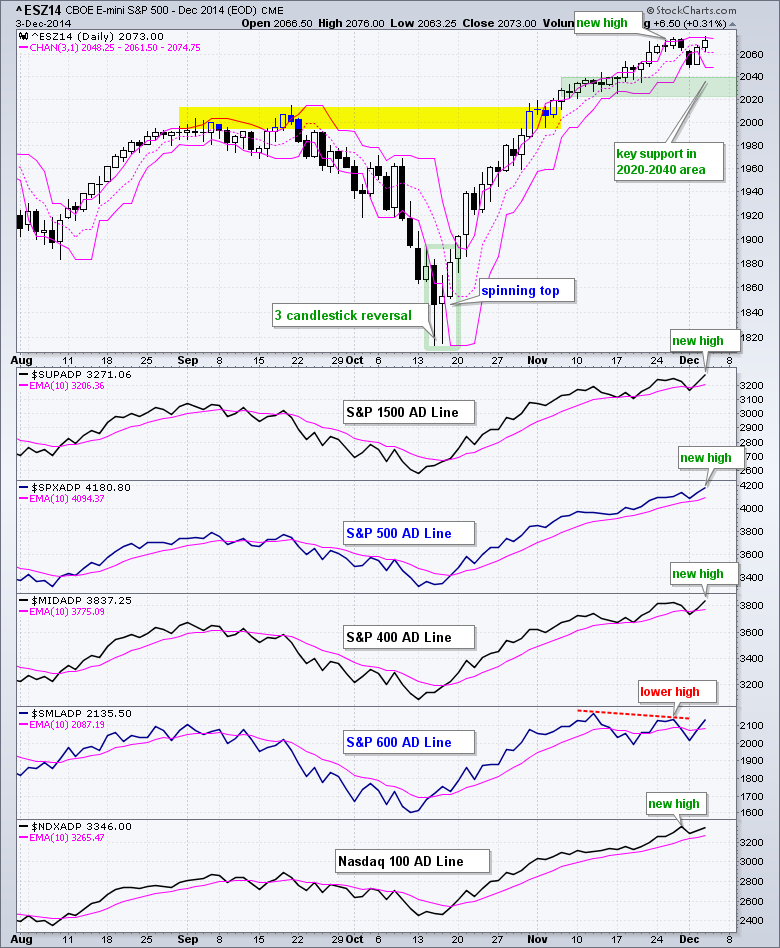
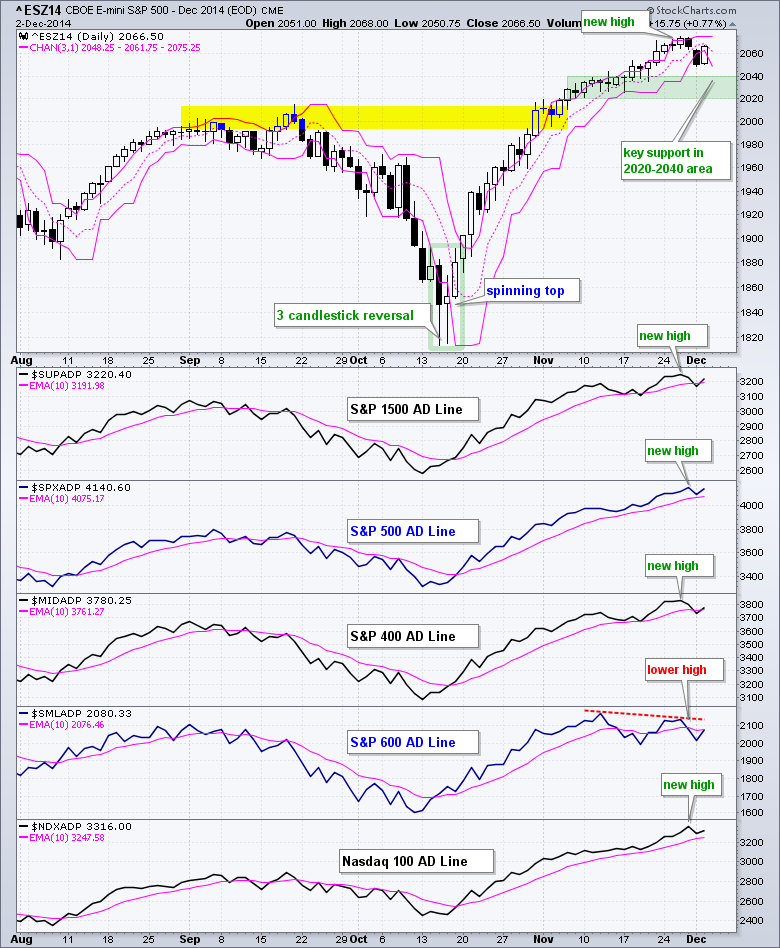
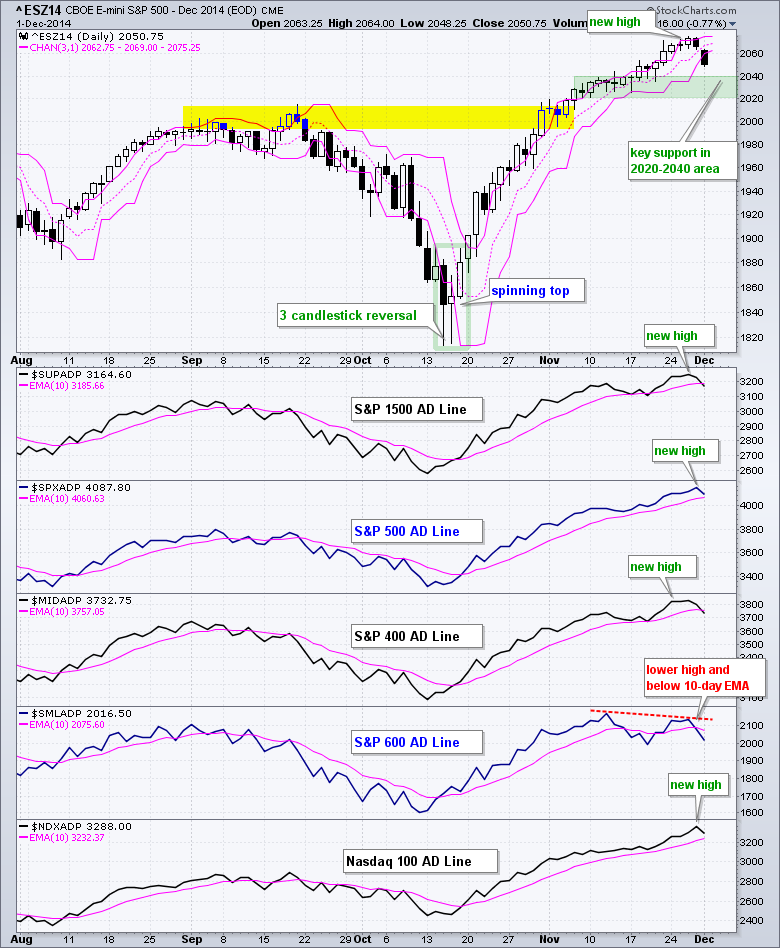
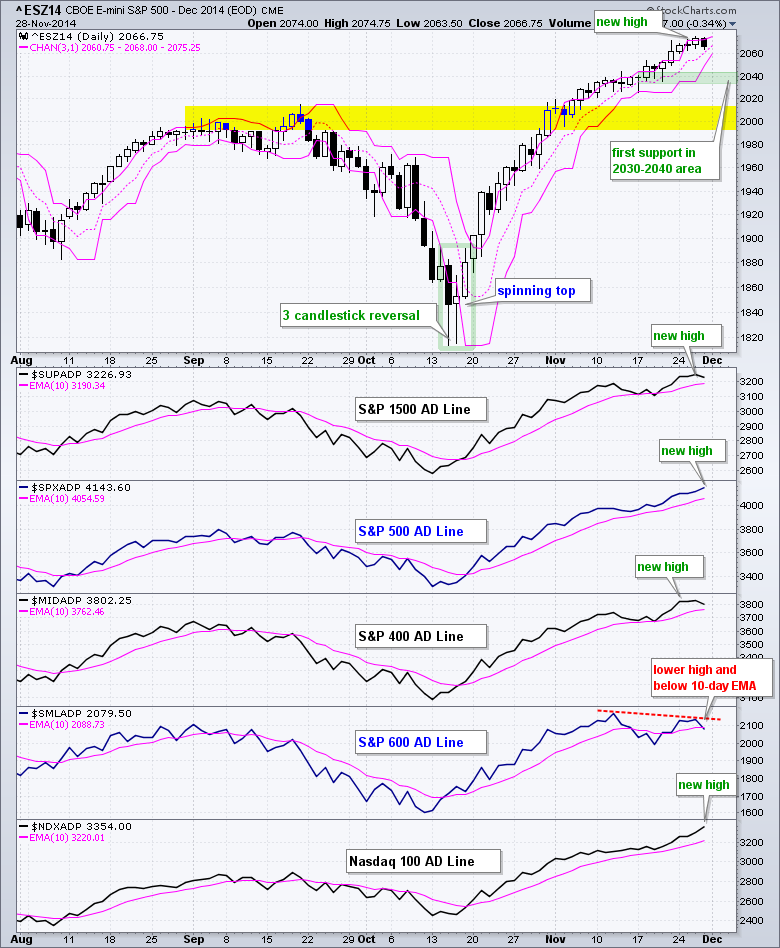
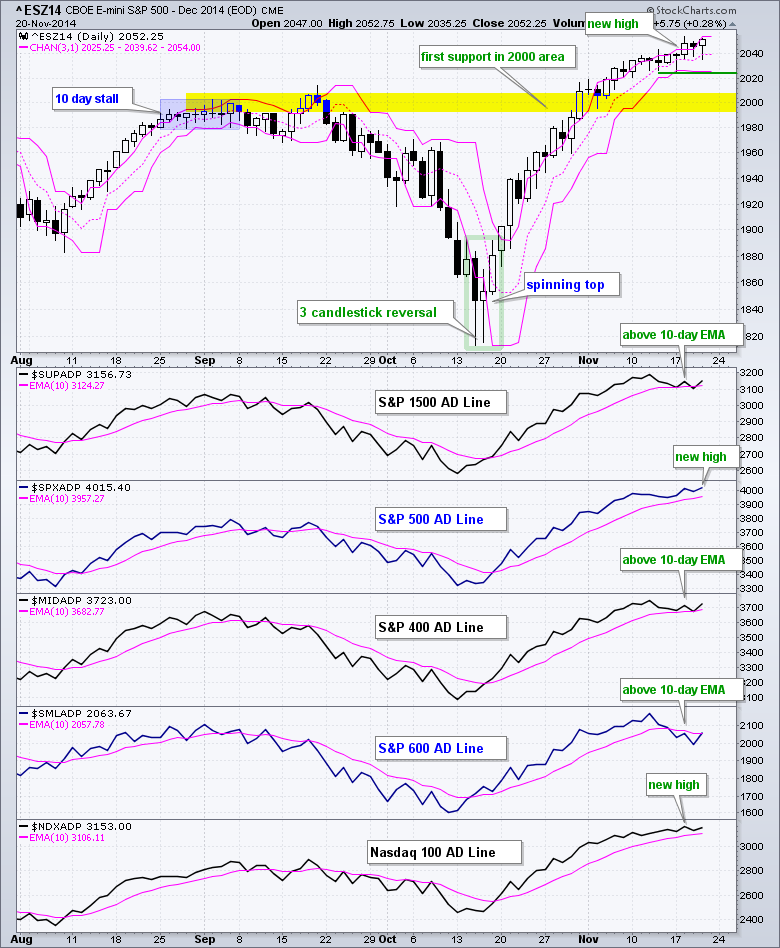
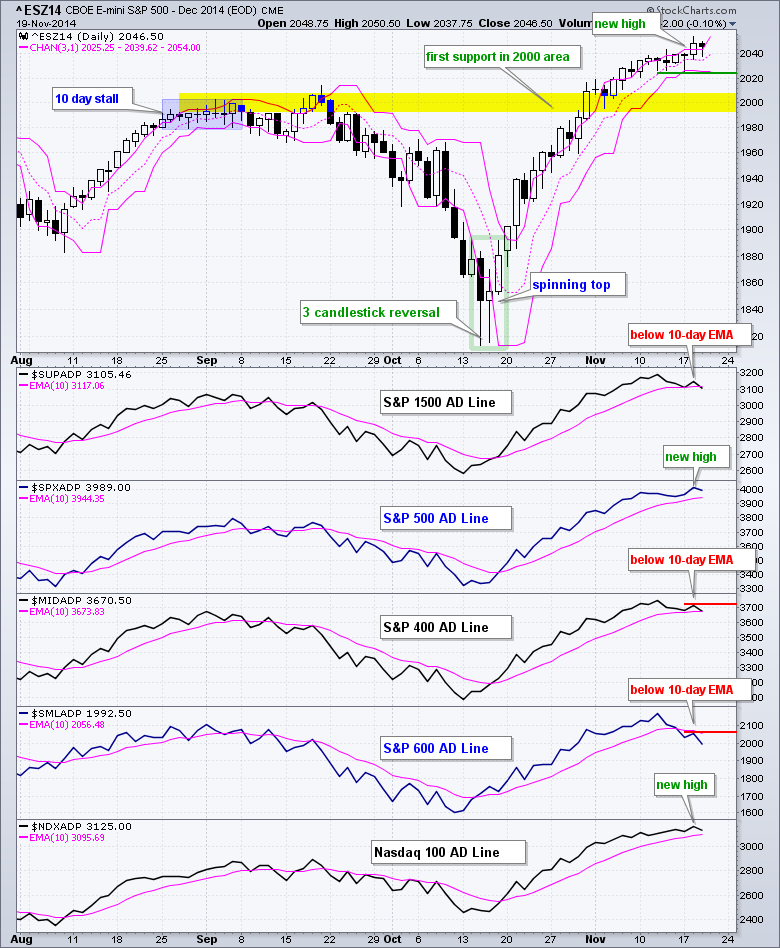
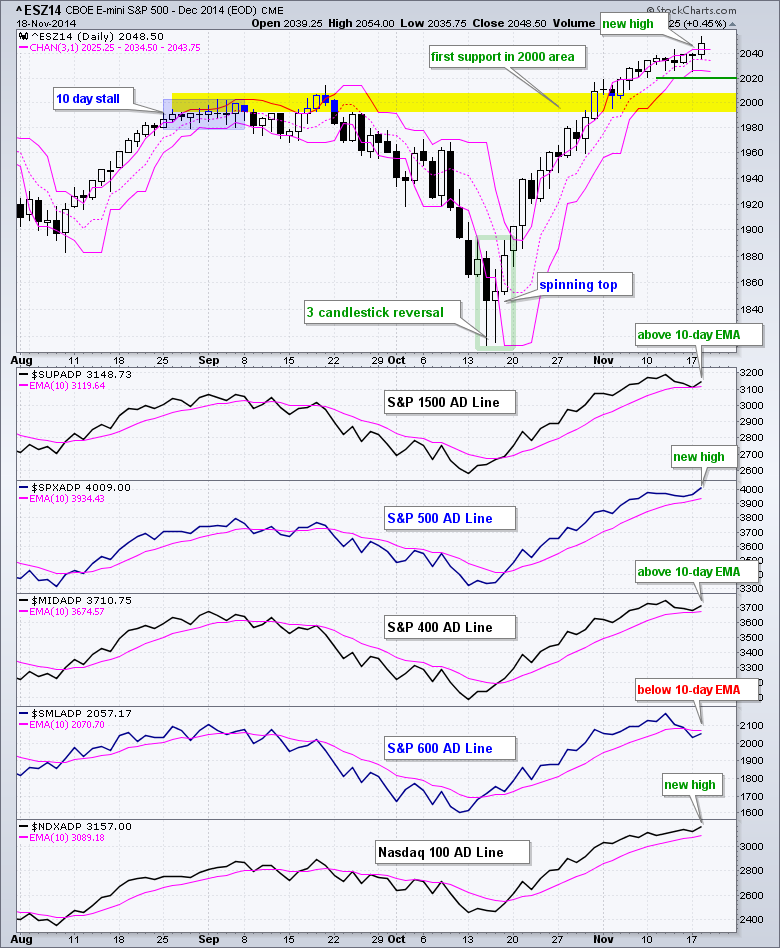
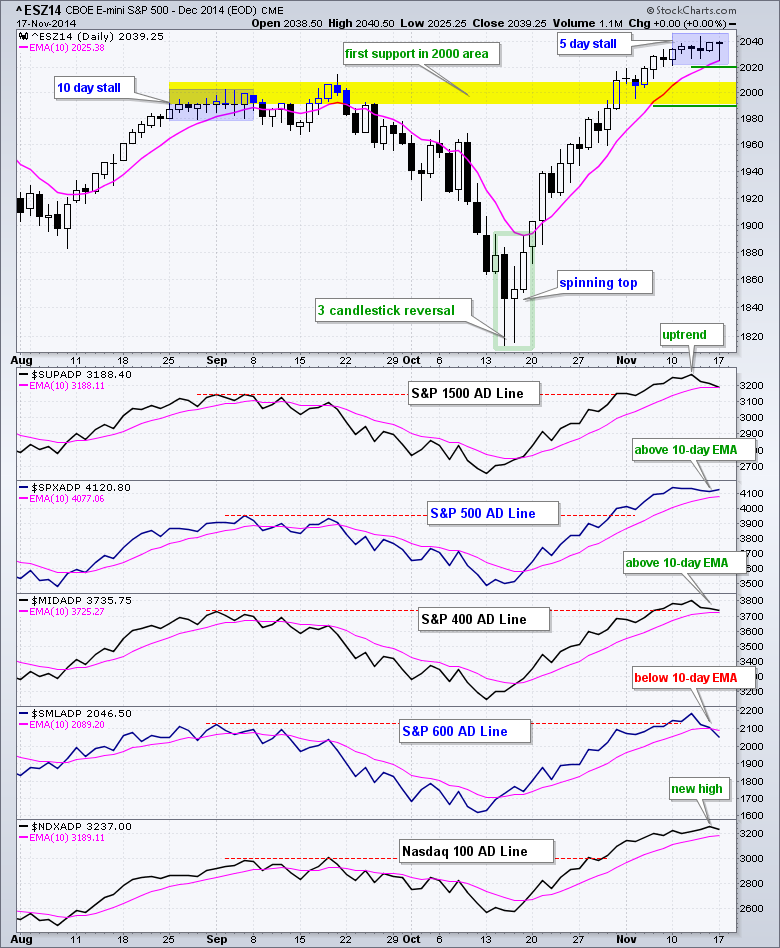
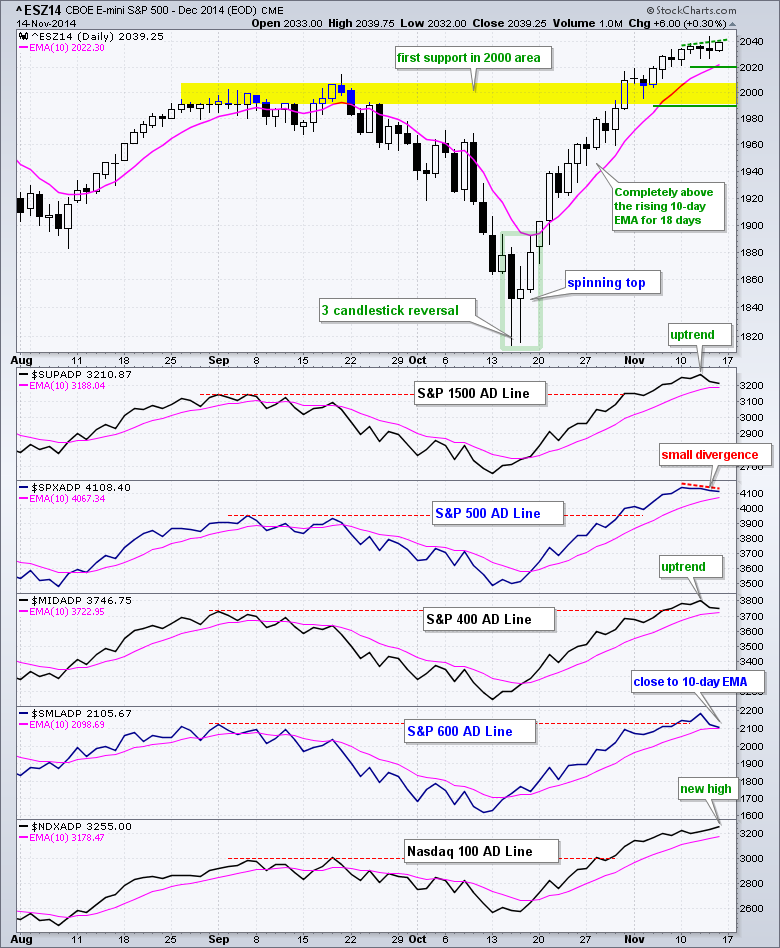
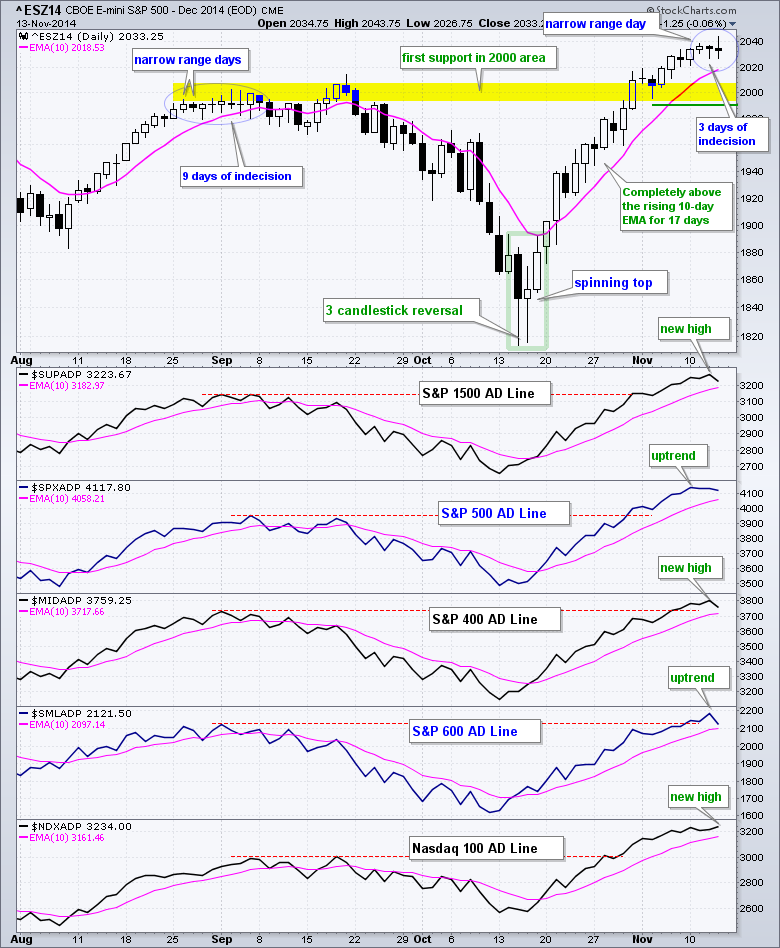
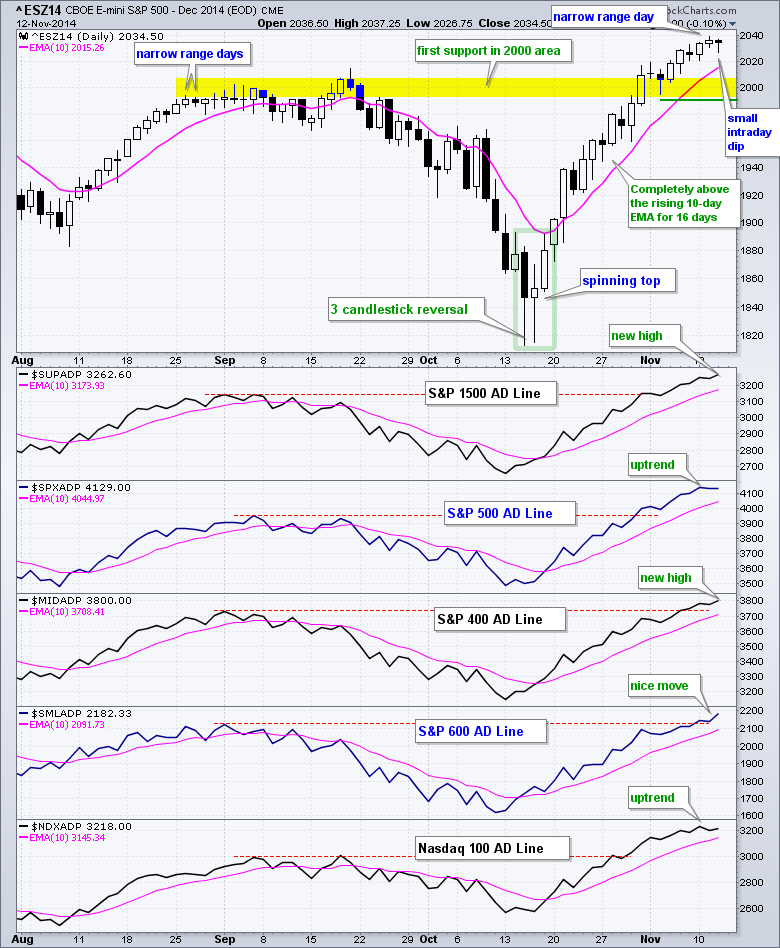
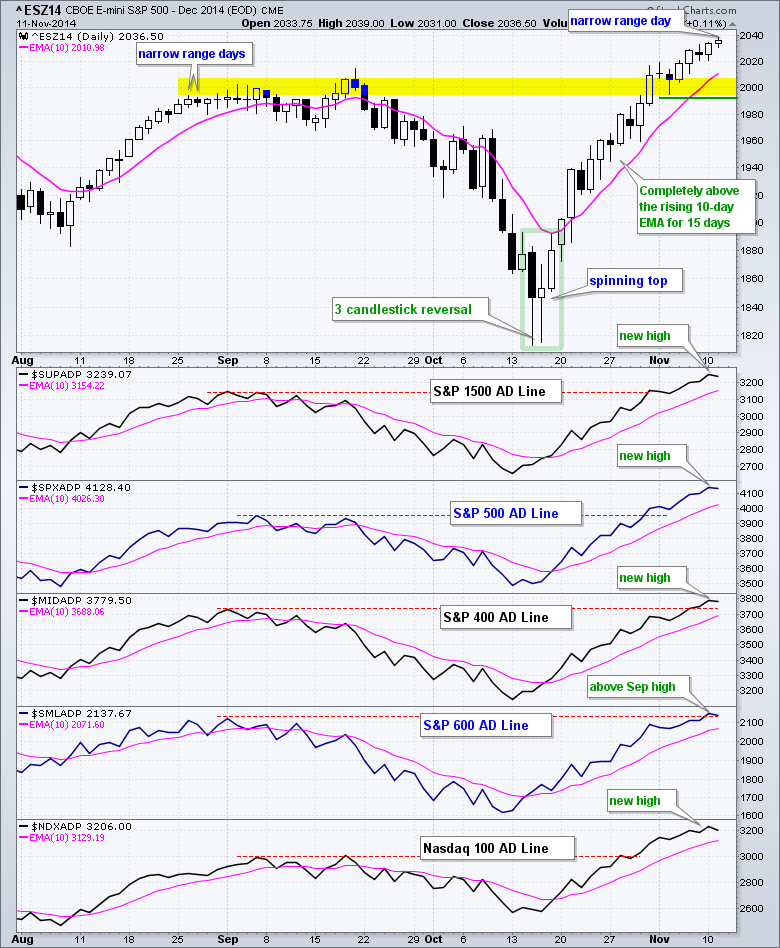
The December E-mini S&P 500 (^ESZ14) hit another new high with another incremental step. Since the close above 2000 at the end of October, the gains have been rather incremental and upside momentum has slowed. Is this bearish? Buying pressure may not be as strong as it...
READ MORE
MEMBERS ONLY
Industrials and Healthcare Lead the Big Recovery
by Arthur Hill,
Chief Technical Strategist, TrendInvestorPro.com
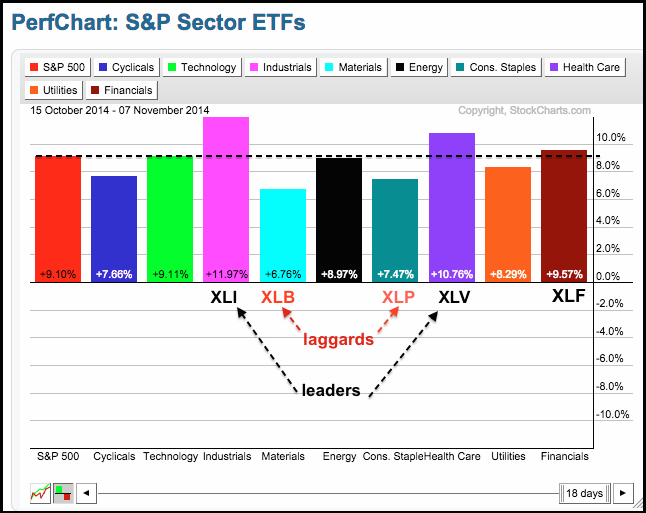
The stock market bottomed in mid October and then surged over the last 18 days. Chartists can find the leaders (and laggards) for this period by setting the PerfChart for 18 days. Simply double click the date tab and enter a number. The PerfChart below shows all nine sectors and...
READ MORE