MEMBERS ONLY
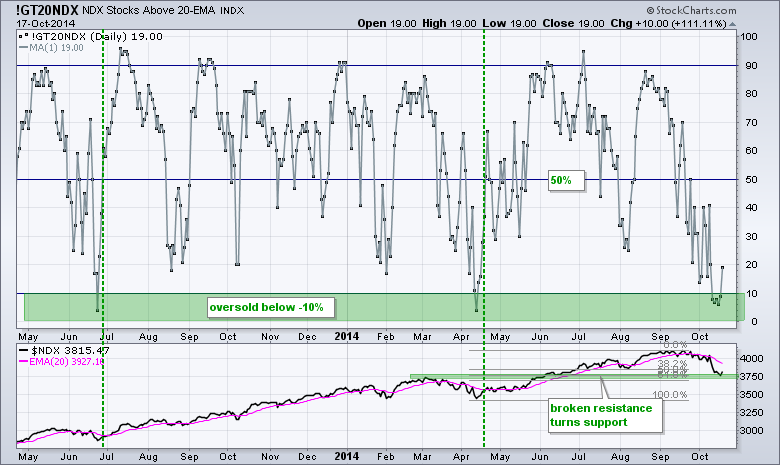
Stocks Gets an Oversold Bounce - NDX Breadth Improves
by Arthur Hill,
Chief Technical Strategist, TrendInvestorPro.com
Stocks followed up on Thursday's reversal day with a gap up on Friday. Afternoon selling pressure pushed small-caps and micro-caps into negative territory by the close, but the rest of the major index ETFs closed positive. All nine sector SPDRs closed higher with the Industrials SPDR leading the...
READ MORE
MEMBERS ONLY
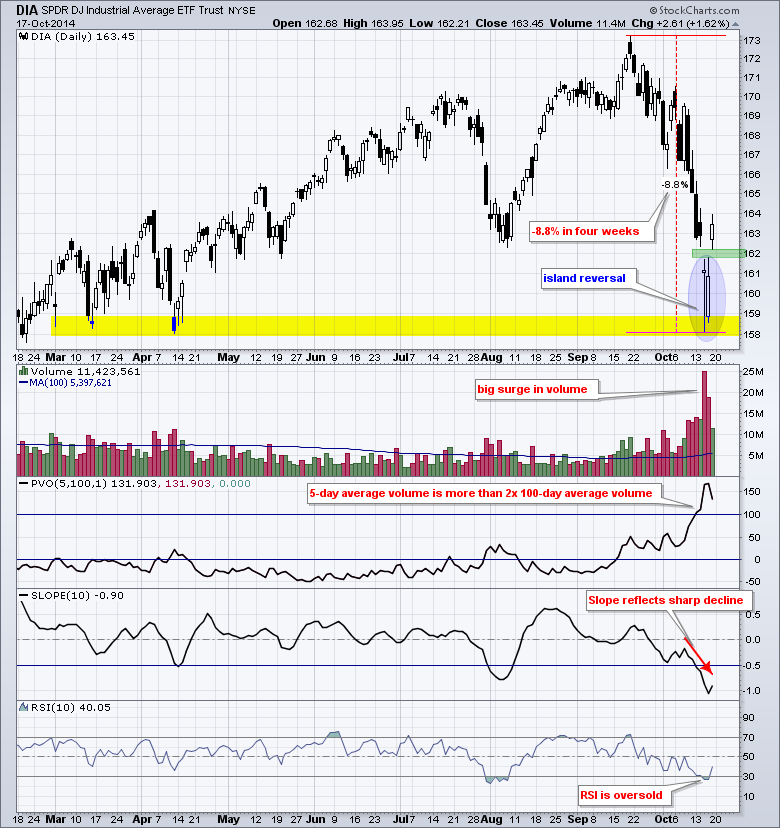
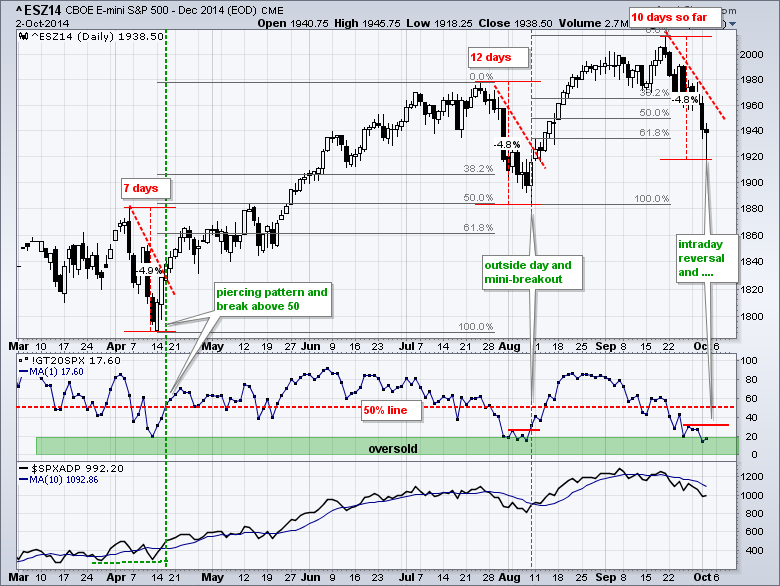
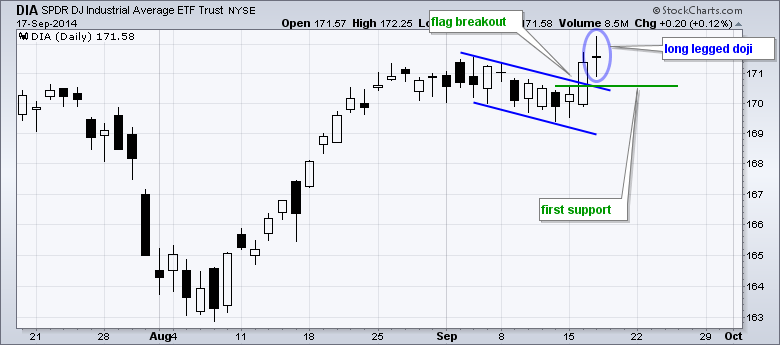
DIA Forges Island Reversal off Support Zone (video)
by Arthur Hill,
Chief Technical Strategist, TrendInvestorPro.com
The Dow Diamonds (DIA) showed signs of a selling climax last week and forged an island reversal to end the week. First, let's look at the indicators to suggest that we had a selling climax or capitulation of sorts. A selling climax involves a very sharp decline with...
READ MORE
MEMBERS ONLY
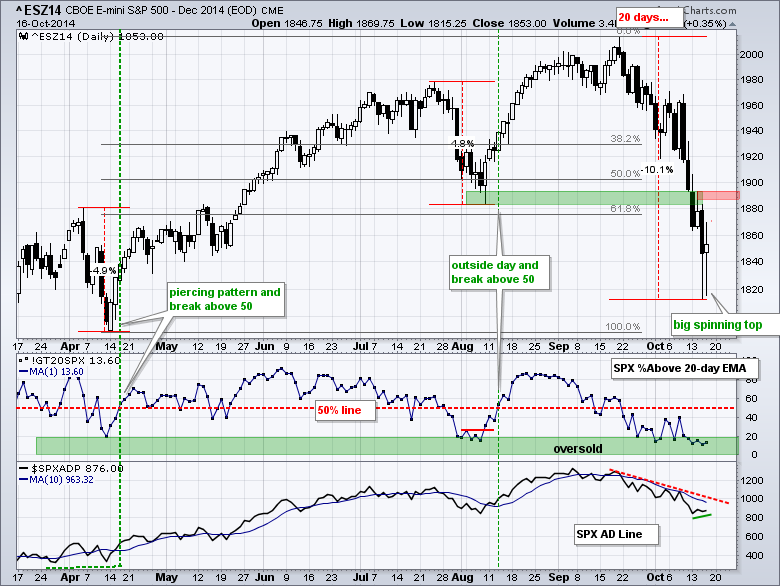
E-Mini Forms Big Spinning Top - Small-caps Continue to Outperform
by Arthur Hill,
Chief Technical Strategist, TrendInvestorPro.com
It was another volatile day for stocks and the major index ETFs finished mixed. Once again, the Russell 2000 iShares and Russell MicroCap iShares led the way higher with 1+ percent gains. Energy led the sectors higher and got a nice oversold bounce. Eight of the nine small-cap sectors were...
READ MORE
MEMBERS ONLY
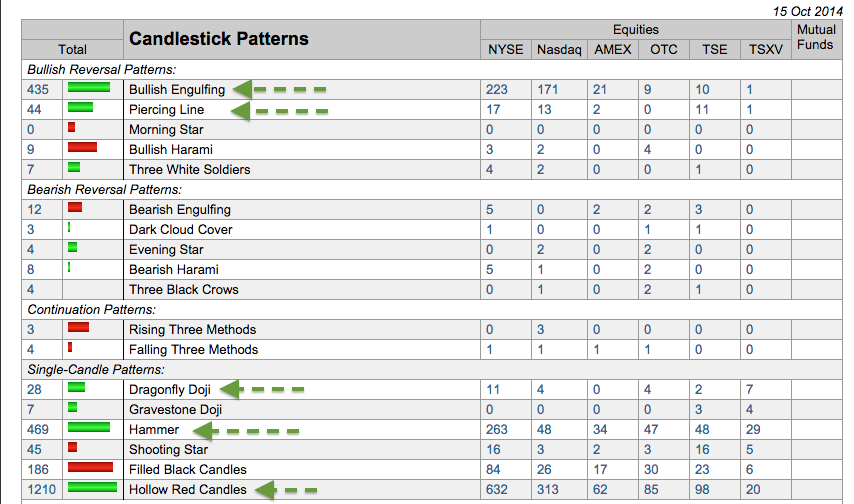
Hammers, Hollow Reds and Dragonflies Hit the Predefined Scans
by Arthur Hill,
Chief Technical Strategist, TrendInvestorPro.com
With weakness in early trading and a strong close, a number of bullish candlestick patterns formed on Wednesday. These include hammers and dragonfly doji. There were also hundreds of hollow red candlesticks. These form when the close is above the open, but the close is still below the prior close....
READ MORE
MEMBERS ONLY
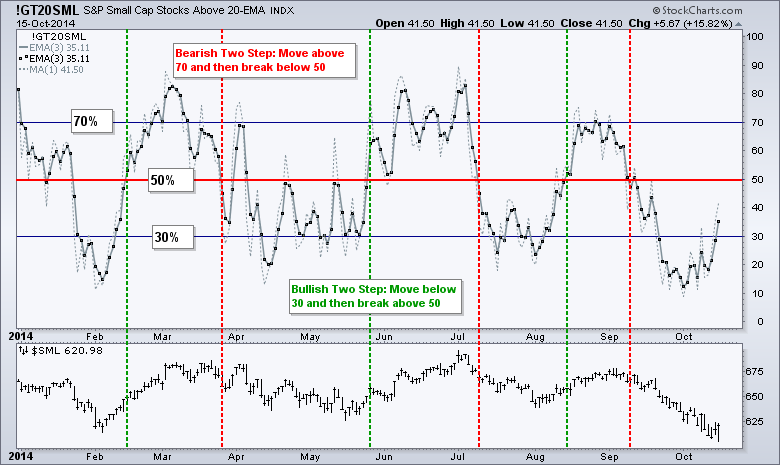
Small-Cap Breadth Improves - A Blow off Top fo TLT?
by Arthur Hill,
Chief Technical Strategist, TrendInvestorPro.com
Stocks plunged in early trading and then bounced in the afternoon. After a whole lot of volatility, stocks finished mixed overall. The Russell 2000 iShares and the Russell MicroCap iShares gained over 1% and led the rebound. The S&P 500 SPDR and Nasdaq 100 ETF closed lower on...
READ MORE
MEMBERS ONLY
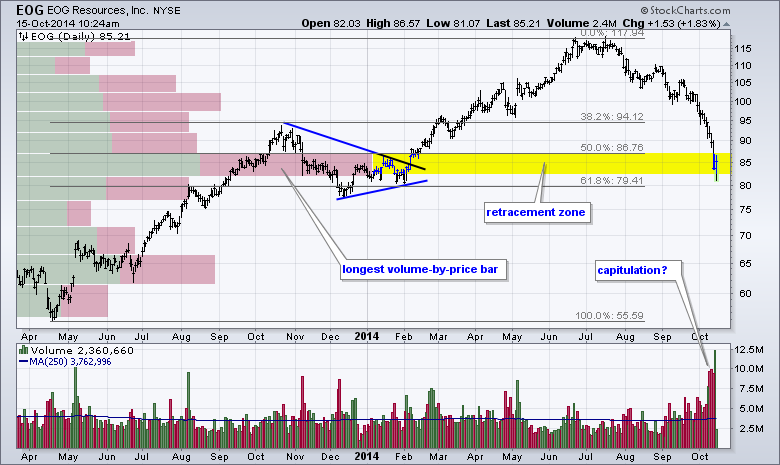
EOG hits Big Volume-by-price Bar
by Arthur Hill,
Chief Technical Strategist, TrendInvestorPro.com
Most energy stocks have been in a free fall this month and EOG resources is no exception. The stock plunged over 25% from its summer highs and retraced 50-62% of the prior advance (Apr-2013 to July-2014). The stock shows signs of capitulation as downside volume surged for three days and...
READ MORE
MEMBERS ONLY
Small-Caps Perk Up, but Risk Off Remains in Play
by Arthur Hill,
Chief Technical Strategist, TrendInvestorPro.com
Stocks attempted to bounce in early trading, but selling pressure took hold and the major index ETFs fell back in the afternoon. The S&P 500 SPDR (SPY) finished with a small gain (.54%) and the S&P 100 ETF (OEF) ended with a small loss (.09%). Small-caps...
READ MORE
MEMBERS ONLY
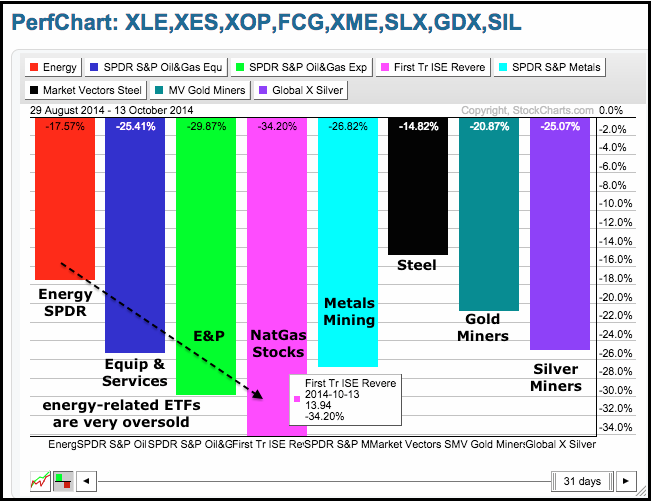
Energy-related ETFs Hit Historical Extremes
by Arthur Hill,
Chief Technical Strategist, TrendInvestorPro.com
By most metrics, the energy related ETFs have hit oversold extremes with big declines over the last 31 days. The Oil & Gas Equip & Services SPDR (XES) is down around 25%, the Oil & Gas E&P SPDR (XOP) is down almost 30% and the FirstTrust Natural Gas...
READ MORE
MEMBERS ONLY
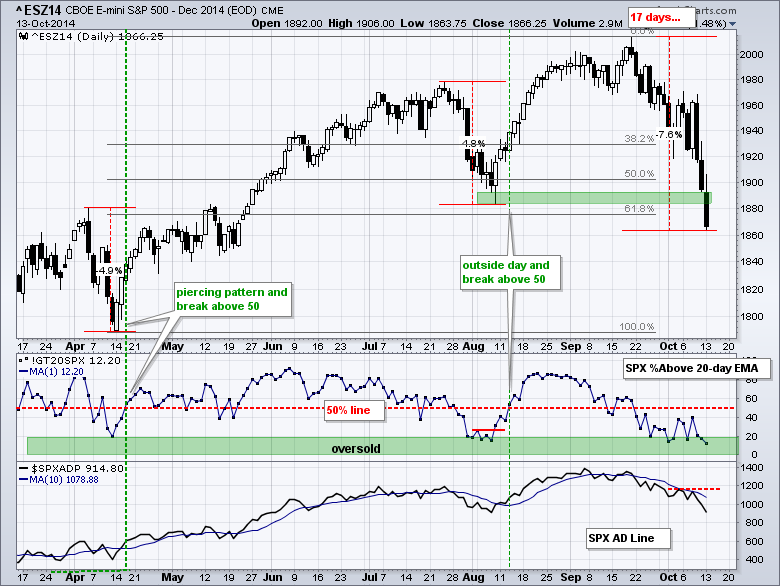
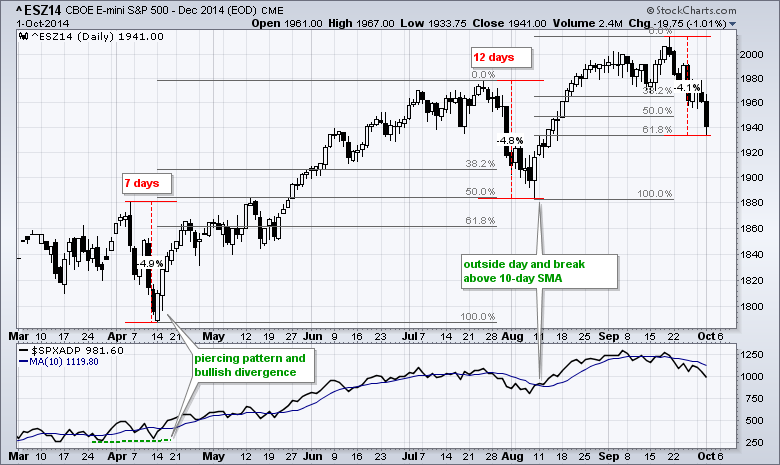
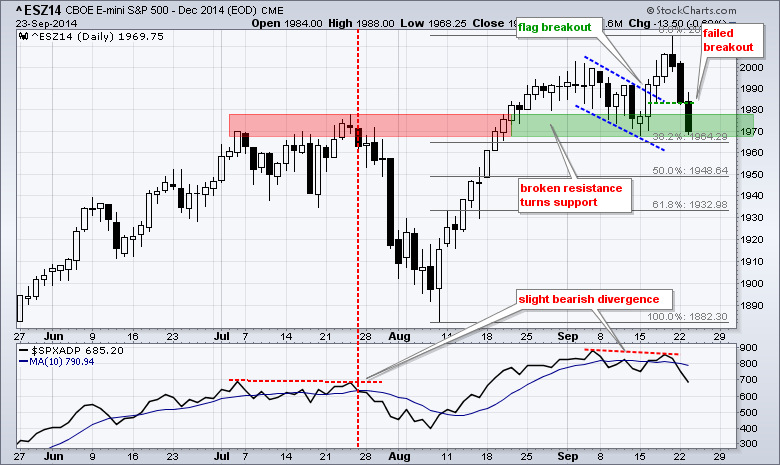
E-Mini Breaks August Low as SPY Hits Targets
by Arthur Hill,
Chief Technical Strategist, TrendInvestorPro.com
Stocks took it on the chin again as broad selling pressure hit most areas. Most of the major index ETFs declined around 1.5% on the day. The Russell 2000 iShares held up relatively well with a .40% decline and the Russell MicroCap iShares finished with a small gain. The...
READ MORE
MEMBERS ONLY
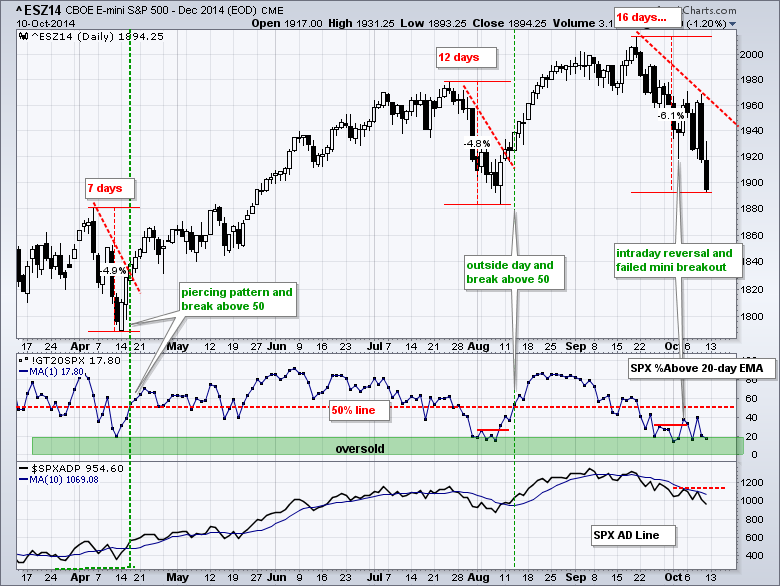
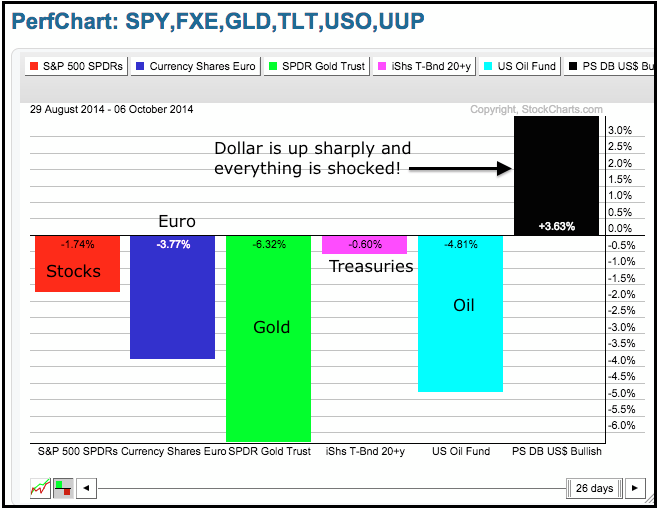
Sector Rotations, Treasuries, Dollar and Oil Favor Risk Off
by Arthur Hill,
Chief Technical Strategist, TrendInvestorPro.com
Stocks surged on Wednesday, but this surge failed miserably as the major index ETFs plunged to new lows for the month on Friday. The S&P 500 opened at 1961 on Thursday, closed of 1894 on Friday and fell 3.4% in two days. The index is once again...
READ MORE
MEMBERS ONLY
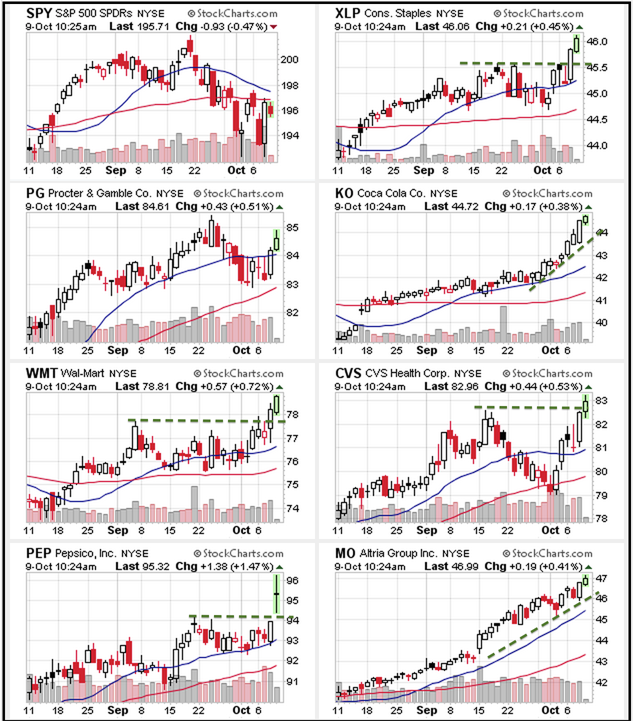
Consumer Staples Stocks Lead the Market
by Arthur Hill,
Chief Technical Strategist, TrendInvestorPro.com
The Consumer Staples SPDR (XLP) shows more "chart" strength than the S&P 500 SPDR (SPY) because it broke out to new highs this week. SPY, on the other hand, remains well below its September high. The CandleGlance chart below shows six leading consumer staples stocks. Five...
READ MORE
MEMBERS ONLY
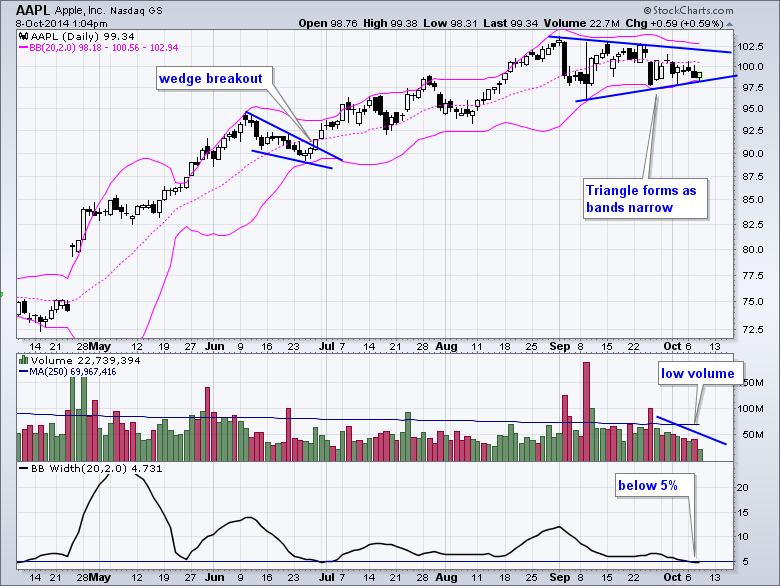
The Noose Tightens on Apple
by Arthur Hill,
Chief Technical Strategist, TrendInvestorPro.com
After a big advance from April to August, Apple (AAPL) turned dull as a tight consolidation takes shape. Notice that the Bollinger Bands are narrowing and a triangle is taking shape. The indicator window shows BandWidth below 5% for the first time since early July. This volatility contraction suggests that...
READ MORE
MEMBERS ONLY
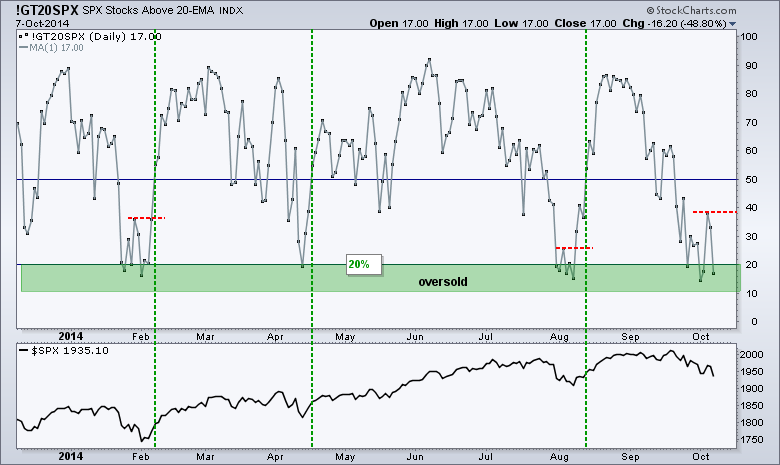
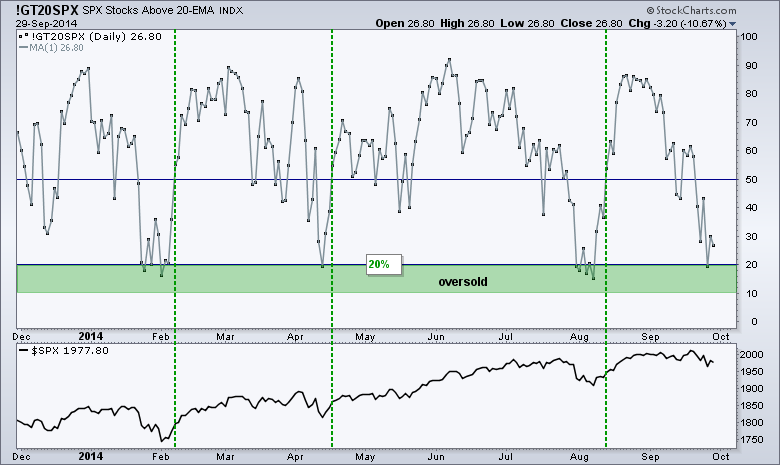
SPY Breadth Indicator Remains Oversold - Risk off Rules
by Arthur Hill,
Chief Technical Strategist, TrendInvestorPro.com
Stocks were hit with broad-based selling pressure on Tuesday. The major index ETFs lost around 1.5% each. All nine sectors were down with the Industrials SPDR (XLI) leading the way (-2.43%). The consumer staples and utilities sectors held up the best (smallest losses). Overall, the markets remain in...
READ MORE
MEMBERS ONLY
Small-Caps Return to Lagging Ways - Plus AXP, GOGO, LNKD, SSTK, TYC and WIT
by Arthur Hill,
Chief Technical Strategist, TrendInvestorPro.com
Stocks face several headwinds over the next few weeks and this could make for choppy trading, or even further weakness. First, midterm elections are four weeks away and this could create uncertainty. Second, earnings season kicks off with Alcoa on October 8th and runs until the end of the month....
READ MORE
MEMBERS ONLY
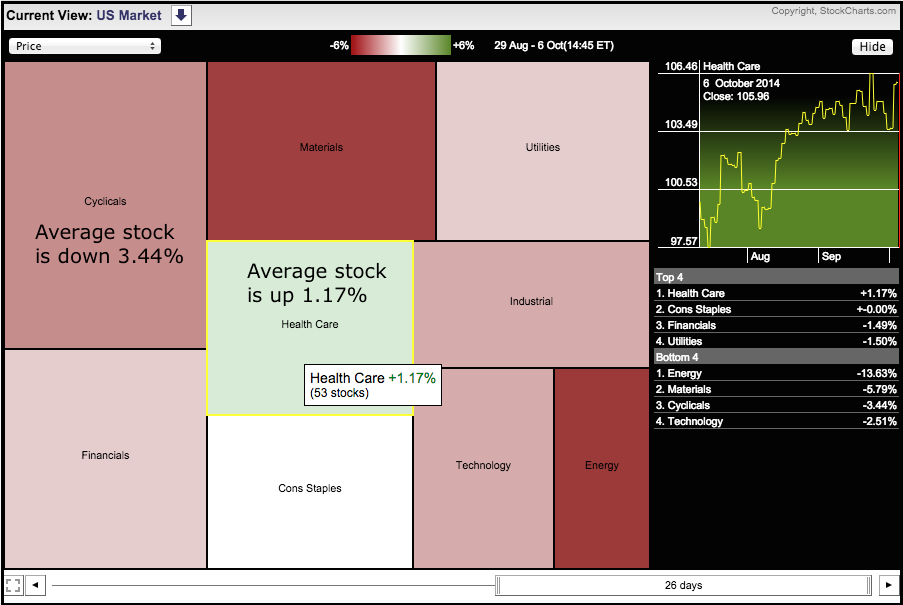
Healthcare is the Healthiest Sector
by Arthur Hill,
Chief Technical Strategist, TrendInvestorPro.com
It has been a rough ride for stocks since September began. The market carpet below shows performance for the sectors as a whole. The average healthcare stock is up 1.17% since 29-Aug and the average consumer staples stock is flat. The average stock for the other seven sectors is...
READ MORE
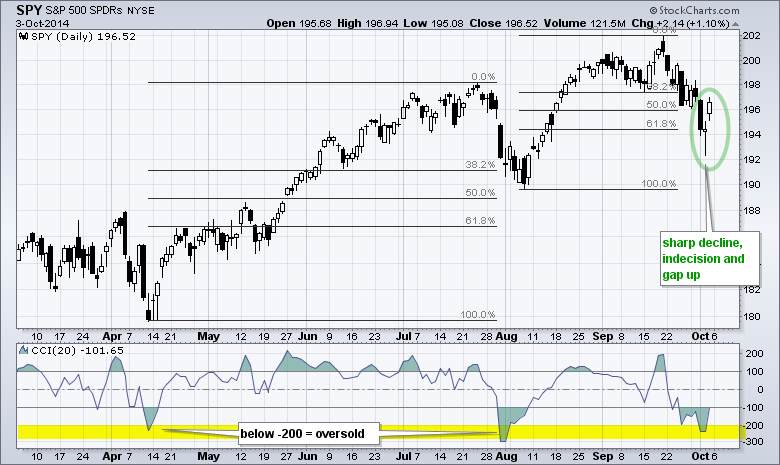
MEMBERS ONLY
SPY Follows Up on Reversal Day - Watching Breadth Closely
by Arthur Hill,
Chief Technical Strategist, TrendInvestorPro.com
Stocks reversed course intraday on Thursday and followed this reversal with a gap-surge on Friday. The gains for the day were modest as the S&P 500 SPDR added 1.10% and the Russell 2000 iShares gained .75% on the day. Eight of the nine sector SPDRs were higher...
READ MORE
MEMBERS ONLY
SPY Forges 3-Stick Reversal at Key Retracement (video)
by Arthur Hill,
Chief Technical Strategist, TrendInvestorPro.com
The S&P 500 SPDR (SPY) appears to be putting in another higher low that could signal the resumption of the long-term uptrend. First and foremost the long-term trend is up because SPY recorded a 52-week high less than three weeks ago. In addition, the charts shows a clear...
READ MORE
MEMBERS ONLY
Small-caps Lead Intraday Reversal
by Arthur Hill,
Chief Technical Strategist, TrendInvestorPro.com
Stocks were hit with selling pressure in early trading, firmed at midday and then rallied in the afternoon. Small-caps and micro-caps led the way with the Russell 2000 iShares gaining 1% and the Russell MicroCap iShares surging 1.43%. Six of the nine sector SPDRs closed lower, but eight of...
READ MORE
MEMBERS ONLY
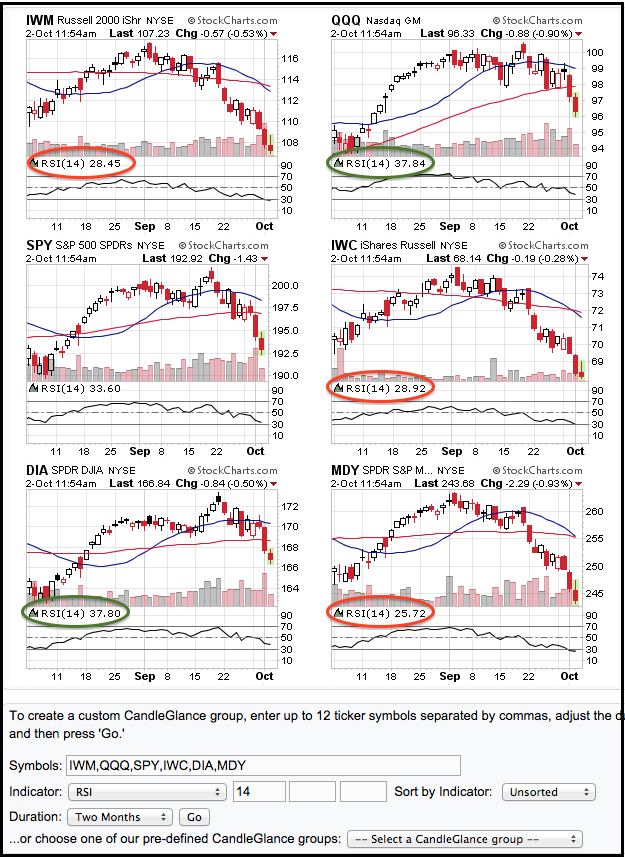
And the Winner for Most Oversold Is.....
by Arthur Hill,
Chief Technical Strategist, TrendInvestorPro.com
The CandleGlance chart below shows six broad-market ETFs with 14-day RSI. Notice that RSI is below 30 for the Russell 2000 iShares, the Russell MicroCap iShares and the S&P MidCap SPDR. With an RSI below 26, the S&P MidCap SPDR is the most oversold of the...
READ MORE
MEMBERS ONLY
SPY Hits Key Retracement - Plus ALXN, KKD, MXIM, SYK
by Arthur Hill,
Chief Technical Strategist, TrendInvestorPro.com
Stocks moved sharply lower on Wednesday with the major index ETFs falling over 1%. The Russell MicroCap iShares (IWC) led the way lower with a 1.71% decline. The materials and energy sectors led the way lower. The utilities provided the only gain. Most industry group ETFs were down. The...
READ MORE
MEMBERS ONLY
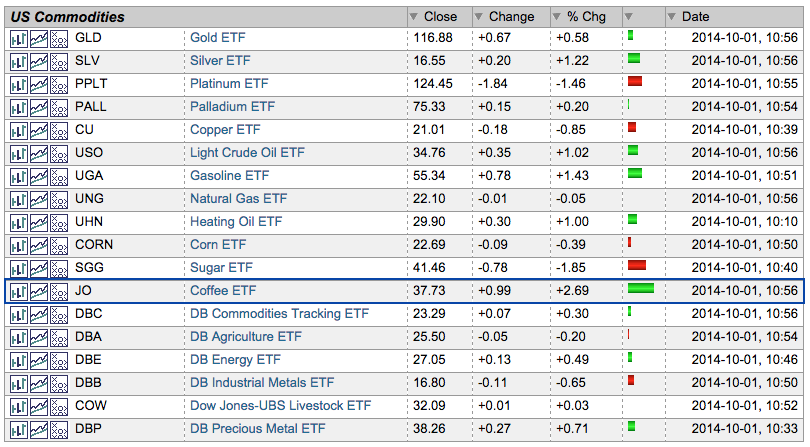
JO Leads the Commodity ETFs
by Arthur Hill,
Chief Technical Strategist, TrendInvestorPro.com
Commodities have been slammed over the last few weeks, but the Coffee ETF (JO) is holding up quite well. JO is up over 20% from its July low and showing relative strength again today. The image below comes from the Market Summary (ETF version), which is a great place to...
READ MORE
MEMBERS ONLY
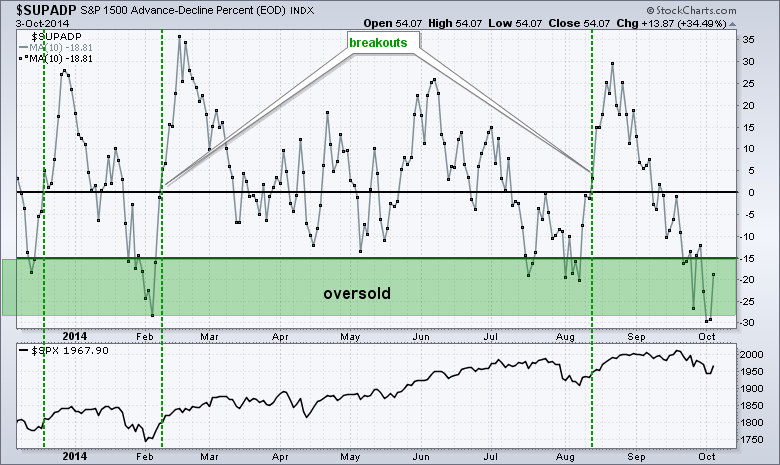
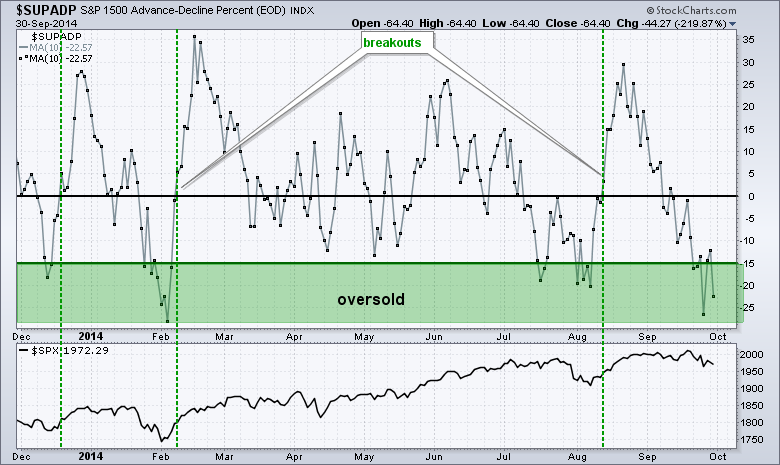
Correction Extends as Oversold becomes more Oversold
by Arthur Hill,
Chief Technical Strategist, TrendInvestorPro.com
The song remains the same. Market performance deteriorated as we moved down in market cap on Tuesday. The S&P 500 SPDR (SPY) declined .26%, the S&P MidCap SPDR (MDY) fell .89% and the Russell 2000 iShares (IWM) lost 1.51%. Large-caps are the only bastion of...
READ MORE
MEMBERS ONLY
Key Breadth Indicator Becomes Oversold - Plus AWAY, GOOGL, N, USNA
by Arthur Hill,
Chief Technical Strategist, TrendInvestorPro.com
Stocks opened with selling pressure, but buyers stepped in after the first ten minutes and pushed stocks off their lows. Trading was then choppy the rest of the day. The major index ETFs finished with fractional losses. The Russell 2000 Growth iShares (IWO) actually closed with a gain and showed...
READ MORE
MEMBERS ONLY
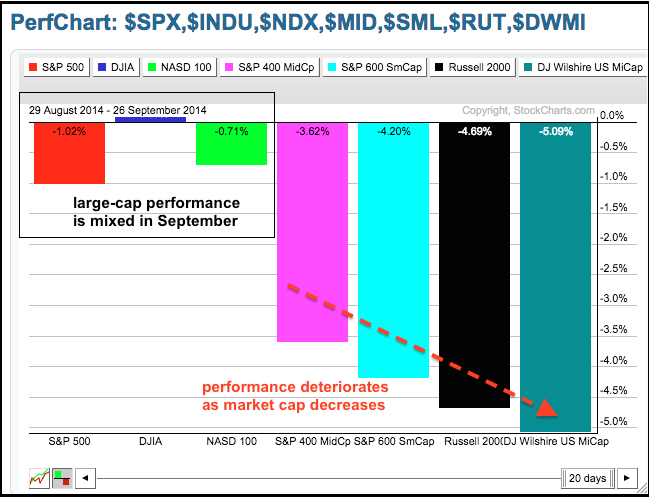
The Smaller They are, the Harder They Fall
by Arthur Hill,
Chief Technical Strategist, TrendInvestorPro.com
September is been rather unkind to mid-caps, small-caps and micro-caps, but large-caps and large-cap techs are holding up ok. The PerfChart below shows the Dow Industrials with a small gain this month, the S&P 500 with a 1% loss and the Nasdaq 100 with a .71% loss. The...
READ MORE
MEMBERS ONLY
Correction is Limited, but Markets Remain in Risk Off Mode
by Arthur Hill,
Chief Technical Strategist, TrendInvestorPro.com
Stocks remain bifurcated with performance deteriorating as we move down the market-cap scale. The S&P 500 is down 1% this month, the Nasdaq 100 is down .71% and the Dow Industrials is up a fraction. A 1% decline hardly qualifies as a correction. Mid-caps and small-caps have corrected...
READ MORE
MEMBERS ONLY
SPY and QQQ Break Down as TLT Breaks Out
by Arthur Hill,
Chief Technical Strategist, TrendInvestorPro.com
Stocks were hit with broad selling pressure with the Nasdaq 100 ETF. leading the major index ETFs lower. The Technology SPDR led the sectors lower with a 2+ percent loss. Almost all industry group ETFs were down. The Gold Miners ETF managed a modest gain and gold got a bounce....
READ MORE
MEMBERS ONLY
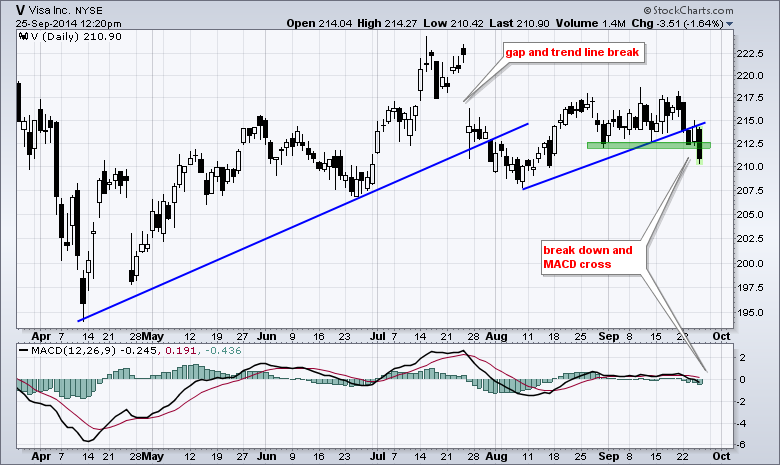
Highest Priced Dow Stock Weighs with a Breakdown
by Arthur Hill,
Chief Technical Strategist, TrendInvestorPro.com
The Dow Jones Industrial Average is a price-weighted average and this means the stocks with the highest prices carry the most weight. Visa (V) is the highest priced Dow stock and it was down around 1.5% at midday, thus weighing on the Dow today. The chart below shows Visa...
READ MORE
MEMBERS ONLY
SPY Bounces off Support - QQQ Holds Support - Plus JO, MRVL, YUM, UA
by Arthur Hill,
Chief Technical Strategist, TrendInvestorPro.com
Stocks got an oversold bounce on Wednesday with QQQ leading the way (+1.07%). The bounces were relatively modest, but QQQ and SPY managed to hold some important short-term support levels. Materials, healthcare and consumer discretionary led the sector SPDRs higher. The consumer discretionary got a big boost from the...
READ MORE
MEMBERS ONLY
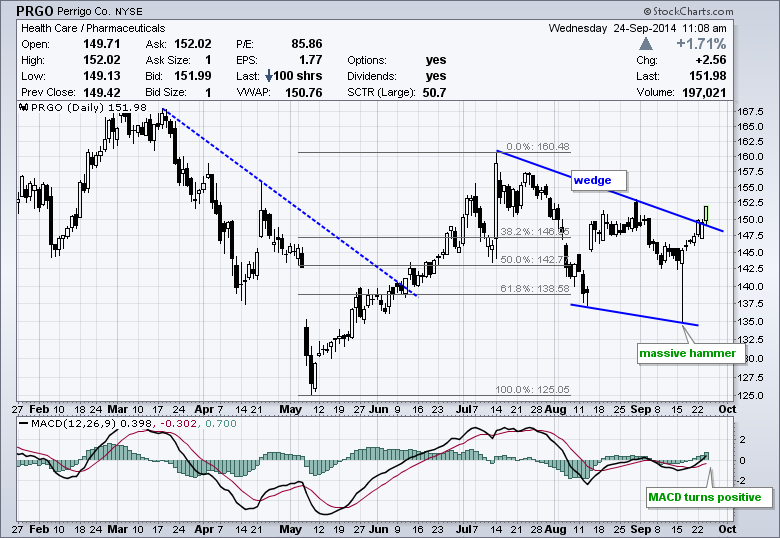
Perrigo Follows Up on Massive Hammer
by Arthur Hill,
Chief Technical Strategist, TrendInvestorPro.com
Perrigo (PRGO), which is part of the healthcare sector, formed a massive hammer in mid September and followed up on this candlestick reversal with a break above the wedge trend line. Also notice that MACD moved above its signal line and turned positive.
Click this image for a live chart...
READ MORE
MEMBERS ONLY
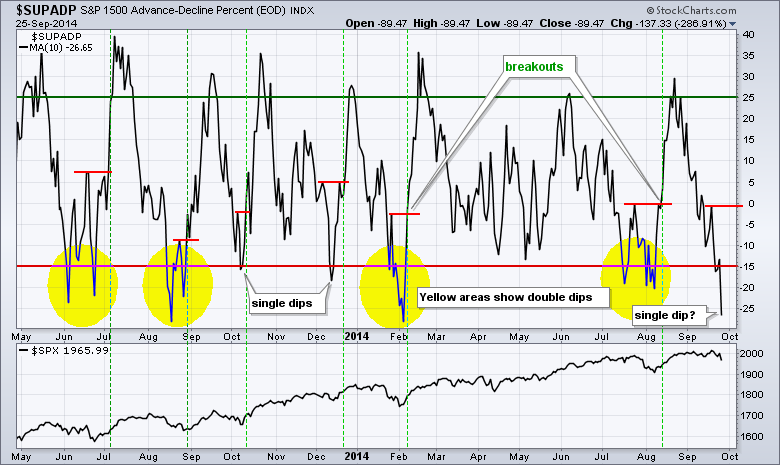
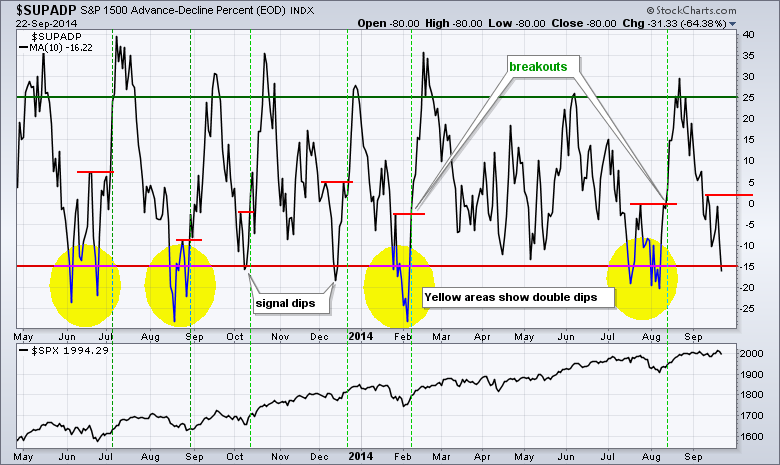
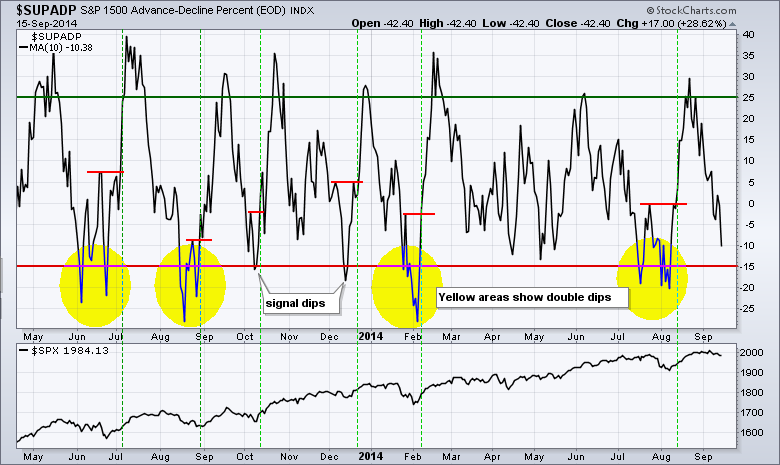
Small Divergence forms in Key Breadth Indicator
by Arthur Hill,
Chief Technical Strategist, TrendInvestorPro.com
Stocks remained under selling pressure on Tuesday with the major index ETFs recording modest losses. All sectors were down with the consumer staples, consumer discretionary and industrials sectors leading lower. Retailers weighed on the consumer discretionary as the Retail SPDR fell 1%. Gold got an oversold bounce and this lifted...
READ MORE
MEMBERS ONLY
Breadth Indicator Hits Oversold - Plus BZH, COH, HD, QLYS and TRIP
by Arthur Hill,
Chief Technical Strategist, TrendInvestorPro.com
Stocks were hit with selling pressure on Monday with small-caps leading the way lower. Small-caps have been weak all month and simply continued this trend on Monday. All sector SPDRs were down with the consumer staples holding up the best. The consumer discretionary and energy sectors were hit hard. Weakness...
READ MORE
MEMBERS ONLY
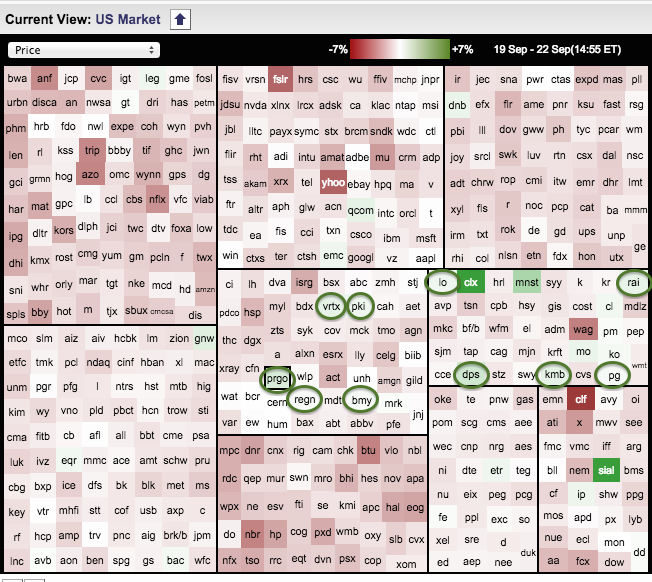
Finding Some Green in a Sea of Red
by Arthur Hill,
Chief Technical Strategist, TrendInvestorPro.com
Stocks are down pretty much across the board on Monday, but there are some pockets of green and chartists can find these stocks using the Sector Market Carpet. The image below highlights ten stocks that are bucking the selling pressure and showing relative strength in a down market. Notice the...
READ MORE
MEMBERS ONLY
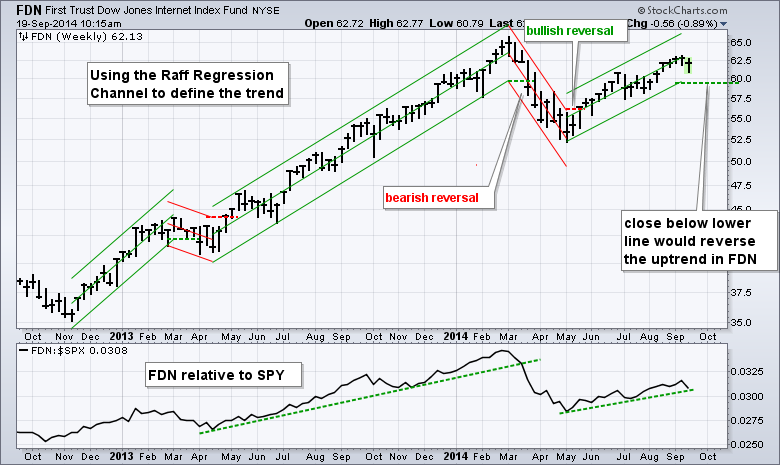
Using the Raff Regression Channel to Identify Trend Reversals in FDN
by Arthur Hill,
Chief Technical Strategist, TrendInvestorPro.com
Today's article will show how the use the Raff Regression Channel to define the trend and identify reversals using the Internet ETF (FDN). I am particularly interested in FDN because internet stocks represent the appetite for risk. An uptrend in FDN signals a strong appetite for risk and...
READ MORE
MEMBERS ONLY
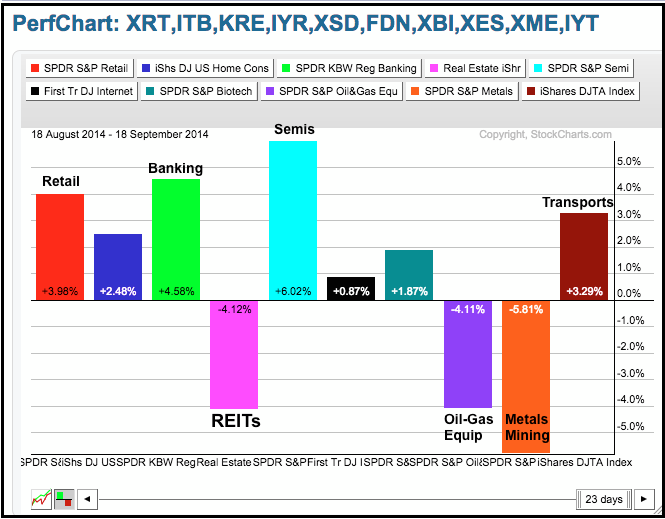
Retail, Banks, Semis and Transports Power Rally
by Arthur Hill,
Chief Technical Strategist, TrendInvestorPro.com
Stocks keep chugging higher as the major index ETFs closed with modest gains. The Nasdaq 100 ETF (QQQ) led the way with a .75% gain. Among the sectors, the Finance SPDR (XLF) surged 1% and the HealthCare SPDR (XLV) advanced .74%. Both recorded new highs. The Broker-Dealer iShares (IAI) and...
READ MORE
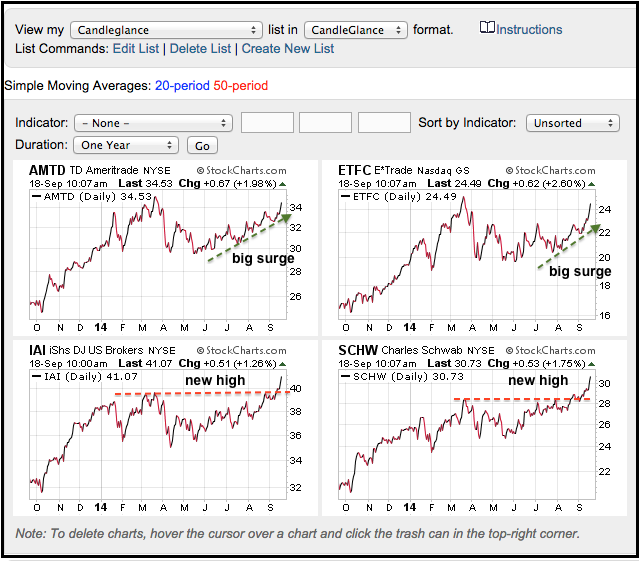
MEMBERS ONLY
Schwab Leads Broker-Dealer iShares to New High
by Arthur Hill,
Chief Technical Strategist, TrendInvestorPro.com
The Broker-Dealer iShares (IAI) is showing leadership over the last few weeks with a surge above its March highs. Notice that the ETF is up around 10% from its early August low. Within the group, Charles Schwab (SCHW) is leading with a new high in late August and further strength...
READ MORE
MEMBERS ONLY
SPY and QQQ Hold Breakouts - IWM Lags - Six Setups
by Arthur Hill,
Chief Technical Strategist, TrendInvestorPro.com
The Fed has come and gone, and the major index ETFs managed to hold on to small gains. Finance, industrials and materials led the sector SPDRs higher, but their gains were modest (.39% to .60%). Energy was weak as oil fell again. Gold miners were hammered again as gold fell...
READ MORE
MEMBERS ONLY
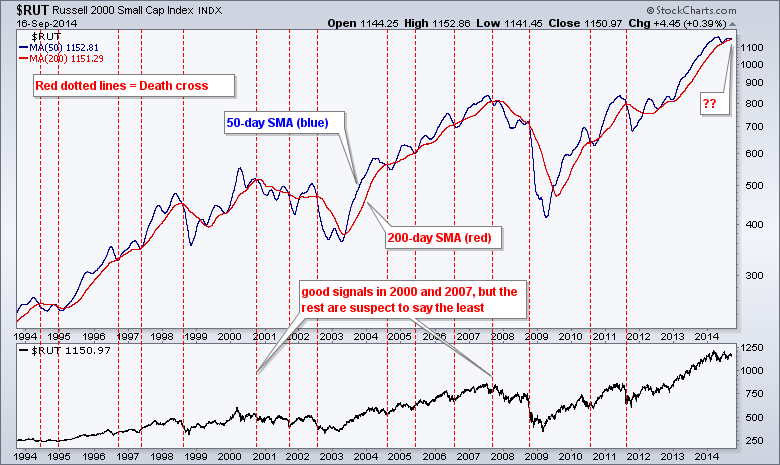
Would a Russell 2000 Death Cross Really be Bad?
by Arthur Hill,
Chief Technical Strategist, TrendInvestorPro.com
There is a lot of talk of an "impending" death cross for the Russell 2000. This event occurs when the 50-day simple moving average crosses below the 200-day SMA. While this event has triggered a couple of good signals over the last 20 years, the majority of signals...
READ MORE
MEMBERS ONLY
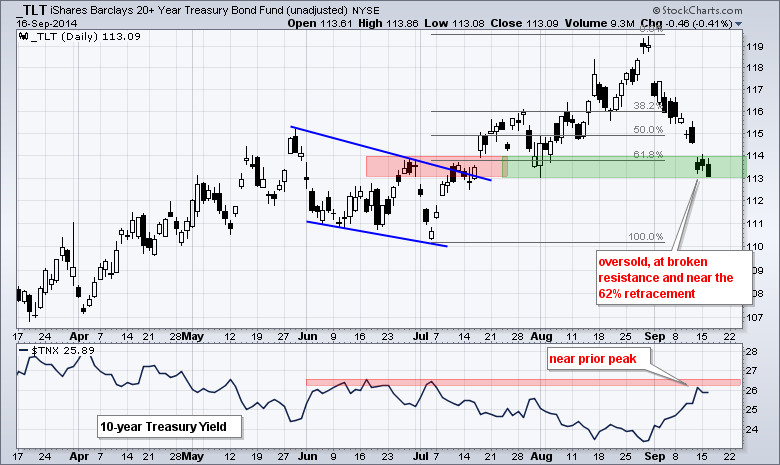
TLT Hits Key Level as Fed Looms
by Arthur Hill,
Chief Technical Strategist, TrendInvestorPro.com
Fed day is here and the markets will hang on every word from the Fed. Sometimes the markets even hang are words that don't appear in the Fed statement. Truth be told, I do not know what the Fed will say or do, and I do not know...
READ MORE
MEMBERS ONLY
Using Breadth to Define Oversold - Plus CF, FOSL, LLTC, XLNX
by Arthur Hill,
Chief Technical Strategist, TrendInvestorPro.com
Stocks started the day weak and finished weak, except for some large-caps. The Russell 2000 iShares and Nasdaq 100 ETF led the market lower with 1% declines. The Dow Diamonds and S&P 100 ETF bucked the selling pressure to finish with fractional gains. The sector SPDRs were mixed...
READ MORE
MEMBERS ONLY
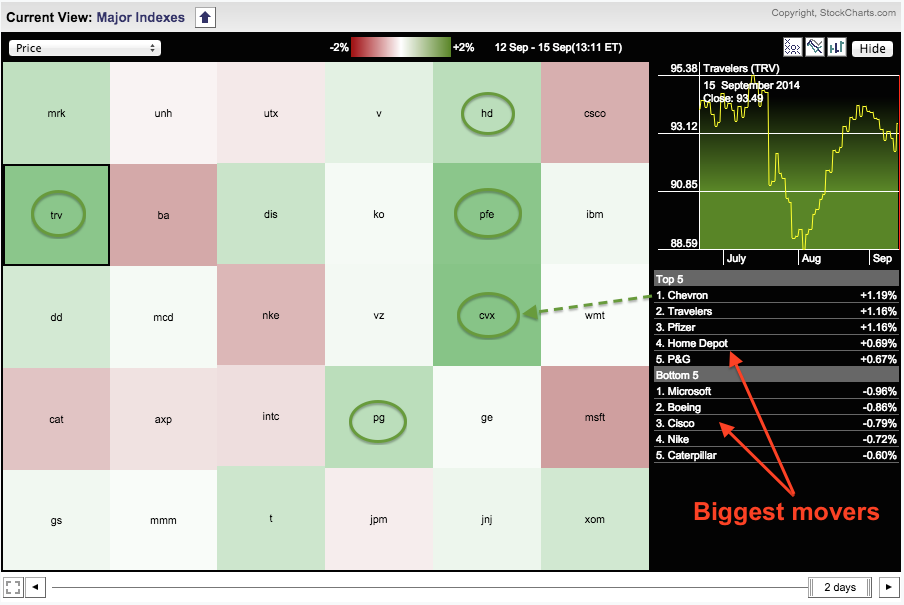
Energy and Pharma Stocks Lift the Dow
by Arthur Hill,
Chief Technical Strategist, TrendInvestorPro.com
The Dow Industrials is bucking the selling pressure with strength in Chevron, Pfizer, Travellers, Procter & Gamble and Home Depot (among others). Chartists can easily spot the winners and losers on a Market Carpet. The chart below shows at least ten green squares, which means these ten are up. There...
READ MORE