MEMBERS ONLY
XLF Shows Relative Strength - Flags form in SPY and IWM
by Arthur Hill,
Chief Technical Strategist, TrendInvestorPro.com
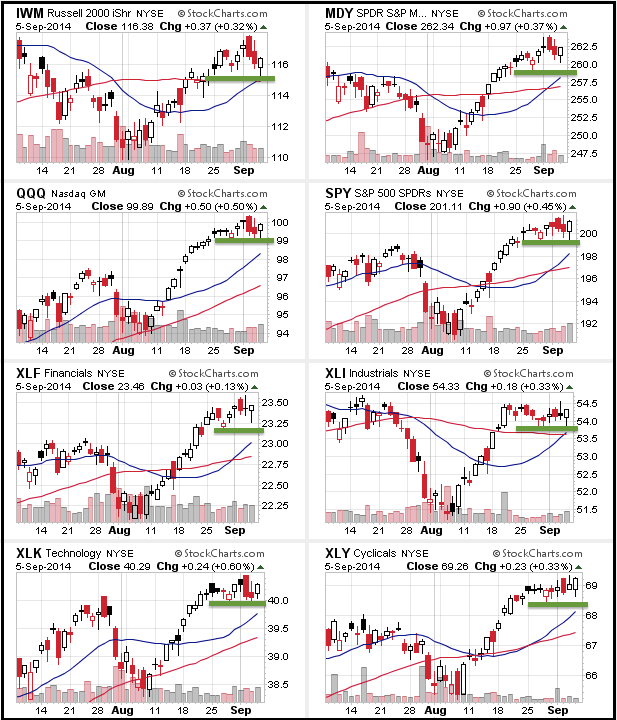
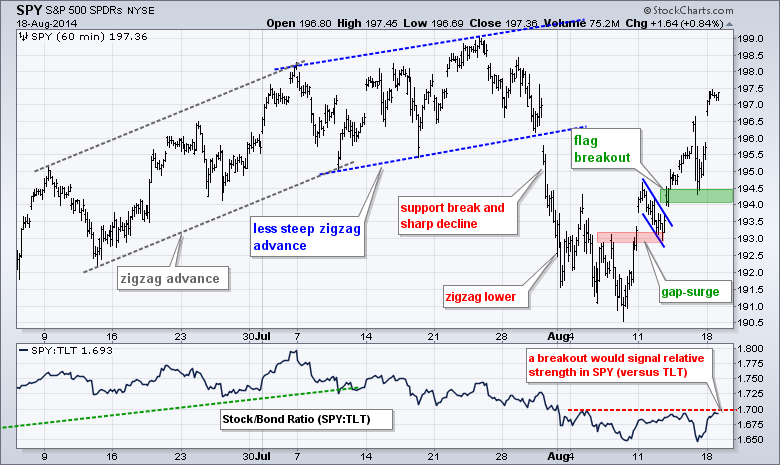
It is Fed week and stocks are in corrective mode. IWM and SPY edged lower this month, while QQQ has traded flat since late August. The patterns for SPY and IWM look like falling flags, which are bullish continuation patterns. Breakouts in both would be quite bullish for the market...
READ MORE
MEMBERS ONLY
Financial Services Lead Small-cap Rebound
by Arthur Hill,
Chief Technical Strategist, TrendInvestorPro.com
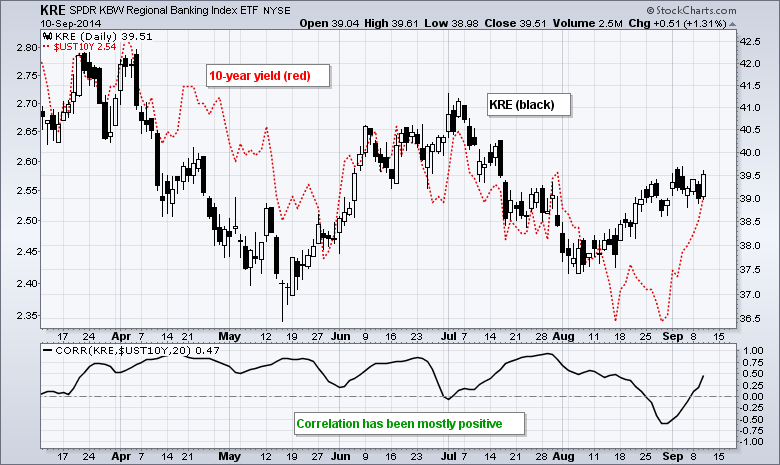
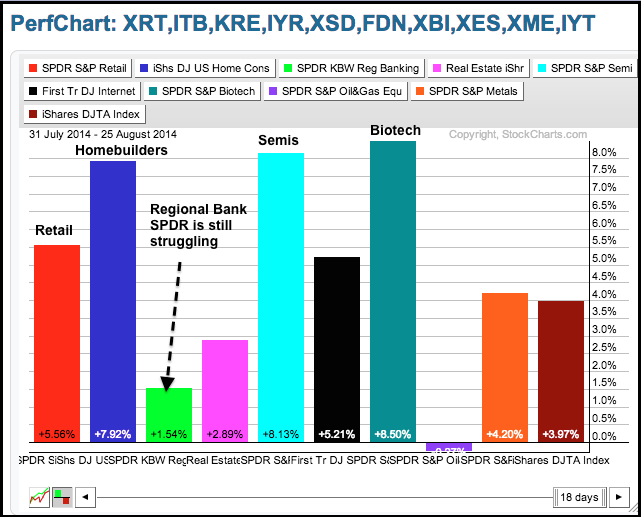
Stocks were mixed on Thursday with the Russell 2000 iShares (IWM) moving higher and the Dow Diamonds (DIA) edging lower. Strength in financial services helped the Russell 2000 gain. The Regional Bank SPDR (KRE) gained .81% as the 10-YR Treasury Yield ($TNX) continued higher. The Retail SPDR (XRT) also showed...
READ MORE
MEMBERS ONLY
General Electric Gets a Squeeze
by Arthur Hill,
Chief Technical Strategist, TrendInvestorPro.com
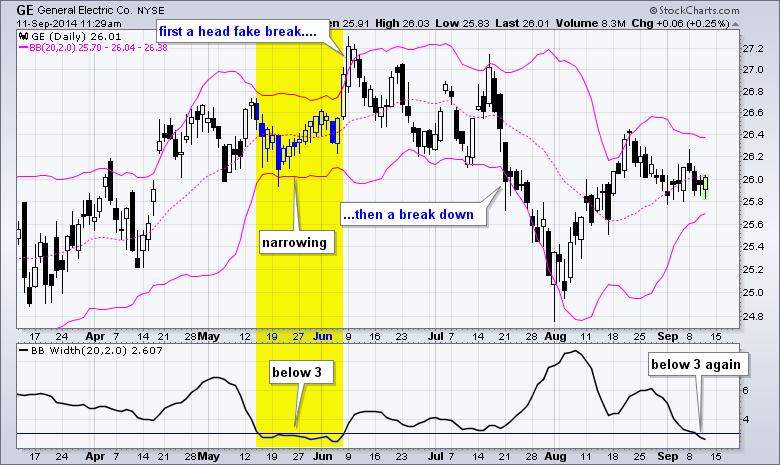
Trading in General Electric (GE) has slowed over the last two weeks and the Bollinger Bands have contracted to their narrowest since early July. The indicator window confirms this volatility contraction as BandWidth dipped below 3 again. Chartists should now prepare for a volatility expansion and a decisive break. Watch...
READ MORE
MEMBERS ONLY
QQQ Holds Support - Plus ADSK, AMZN, AN, CSCO, KRE
by Arthur Hill,
Chief Technical Strategist, TrendInvestorPro.com
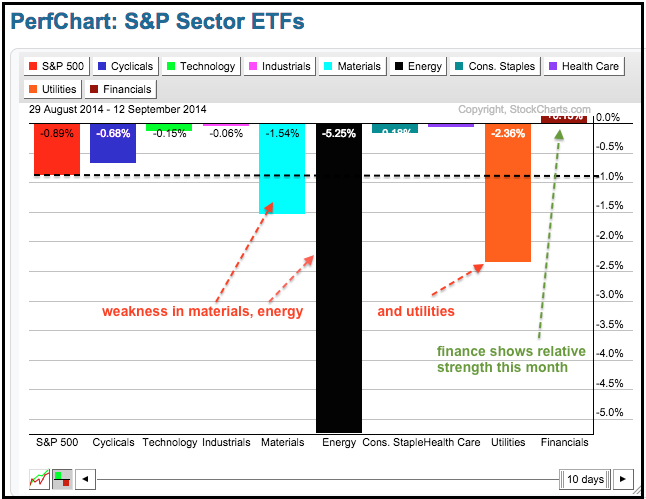
Stocks were slightly higher on Tuesday with the Nasdaq 100 ETF (QQQ) leading the way (+.83%). The sectors were mixed with weakness coming from energy and utilities. Energy stocks were lower as oil hit another new low for the move. Utilities were lower because the 10-YR Treasury Yield ($UST10Y) closed...
READ MORE
MEMBERS ONLY
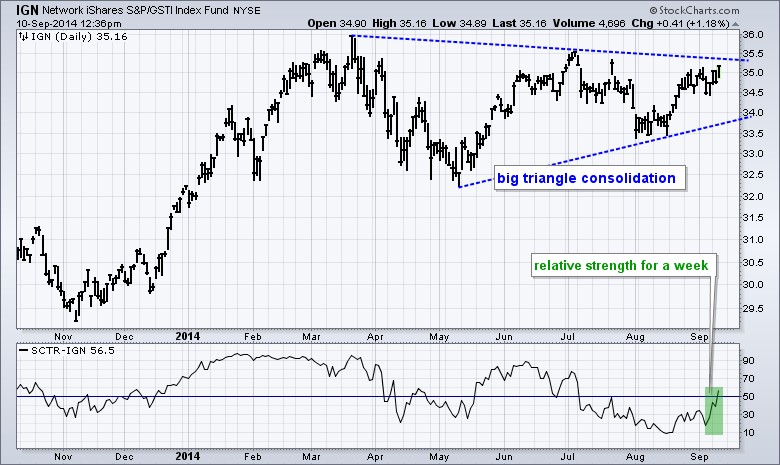
SCTR Surges for the Networking iShares
by Arthur Hill,
Chief Technical Strategist, TrendInvestorPro.com
The Networking iShares (IGN) is making a move over the last few weeks and the StockCharts Technical Rank (SCTR) surged above 50 this week. The chart shows IGN with a big triangle forming since March. A break above triangle resistance would signal a continuation of the prior advance, which was...
READ MORE
MEMBERS ONLY
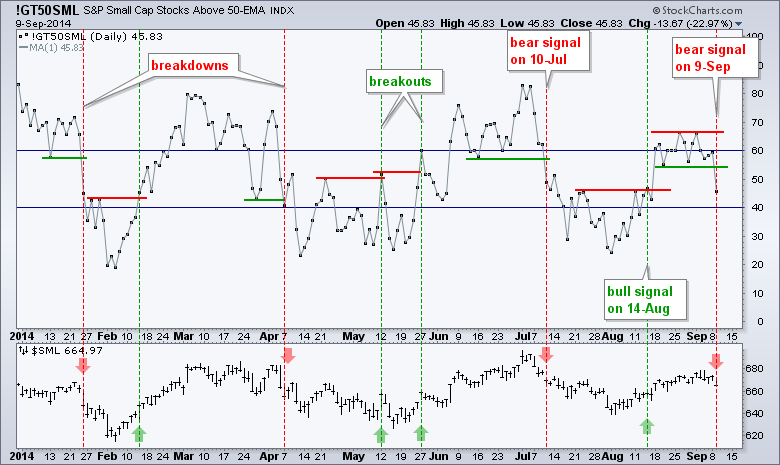
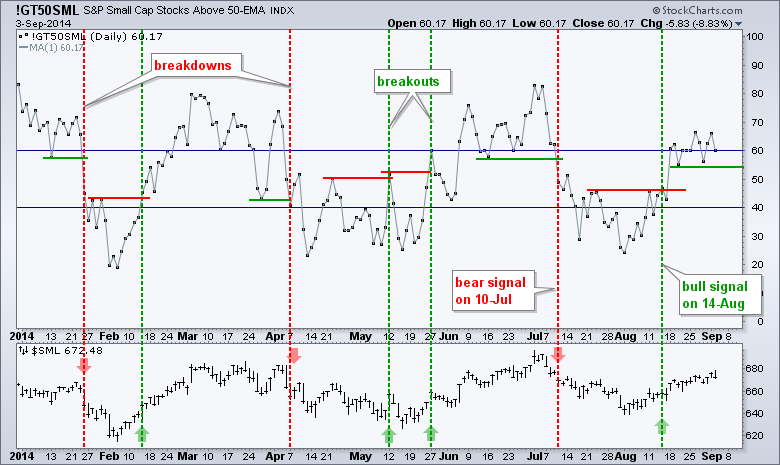
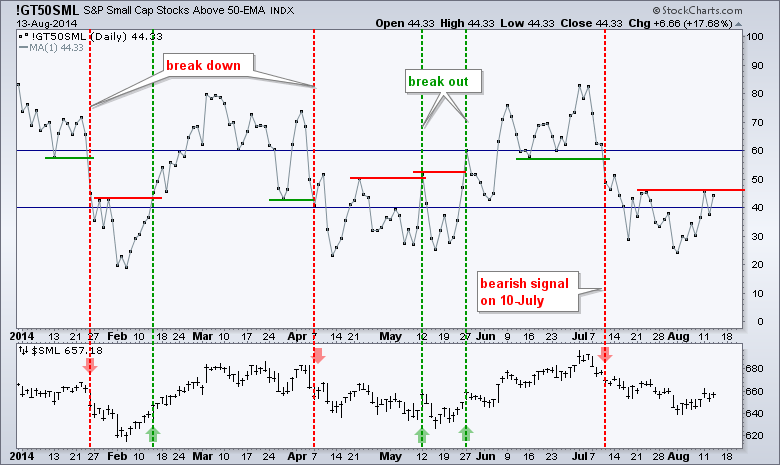
A Breadth Indicator Breaks Down - Setting a Near Term Apple Target
by Arthur Hill,
Chief Technical Strategist, TrendInvestorPro.com
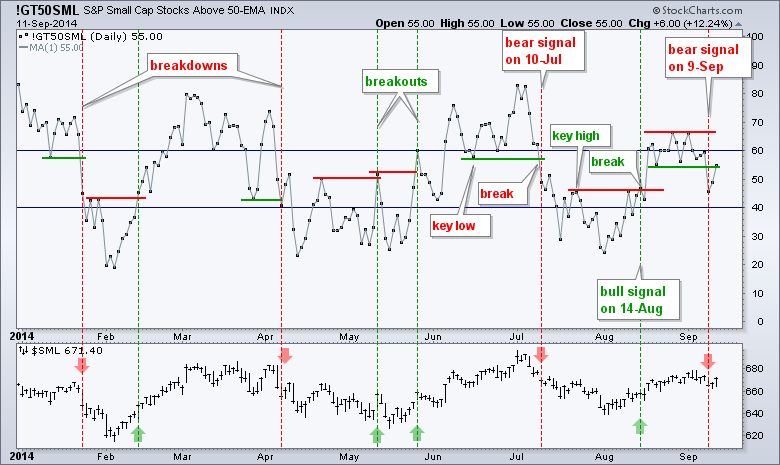
Stocks started the day weak and remained under selling pressure most of the day. Even though the overall declines were modest, price action was not positive and we could see more weakness. Also note that the Small-Cap Percent Above 50-day EMA (!GT50SML) broke down and triggered a bearish signal. In...
READ MORE
MEMBERS ONLY
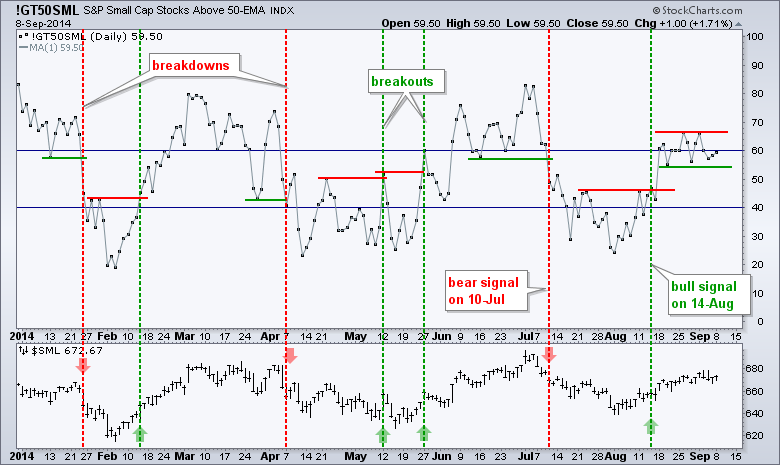
Breadth Indicator Hits Moment-of-Truth - Plus BAC, CSTE, CY, MYL
by Arthur Hill,
Chief Technical Strategist, TrendInvestorPro.com
It was a mixed day on Wall Street. The Nasdaq 100 ETF (QQQ) edged higher, while the S&P 500 SPDR (SPY) and Russell 2000 iShares (IWM) edged lower. The gains and losses were fractional. The Energy SPDR (XLE) was high hard as Spot Light Crude ($WTIC) fell to...
READ MORE
MEMBERS ONLY
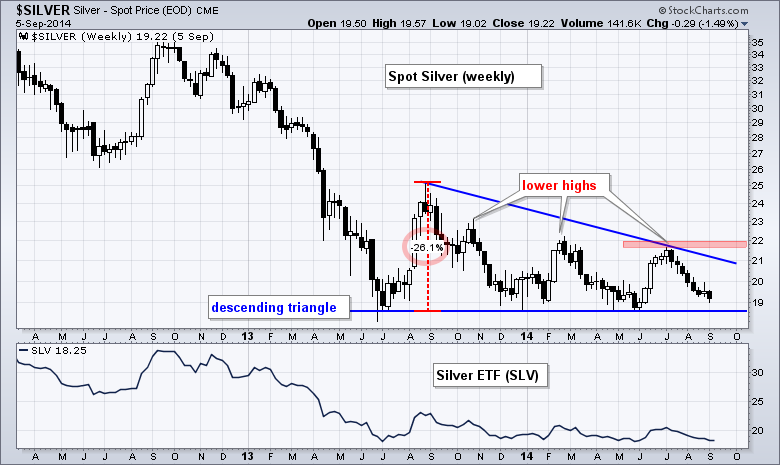
Spot Silver Forms Large Continuation Pattern
by Arthur Hill,
Chief Technical Strategist, TrendInvestorPro.com
The chart below shows Spot Silver ($SILVER) consolidating after a sharp decline. Notice that the metal fell from 35 to 19 and then traded flat from June 2013 until now. With lower highs taking shape, a descending triangle has formed and this is a bearish continuation pattern. A break below...
READ MORE
MEMBERS ONLY
Short-Term Analysis for Stocks, Key Sectors, Gold, Oil, Treasuries and the Dollar
by Arthur Hill,
Chief Technical Strategist, TrendInvestorPro.com
Stocks finished the week on a strong note with modest gains on Friday. Despite this strong finish, the major index ETFs have been in trading ranges the last two weeks. A trading range or consolidation within an uptrend is typically bullish and favors a continuation higher. The CandleGlance charts below...
READ MORE
MEMBERS ONLY
Key Breadth Indicators Affirm Long-term Uptrend
by Arthur Hill,
Chief Technical Strategist, TrendInvestorPro.com
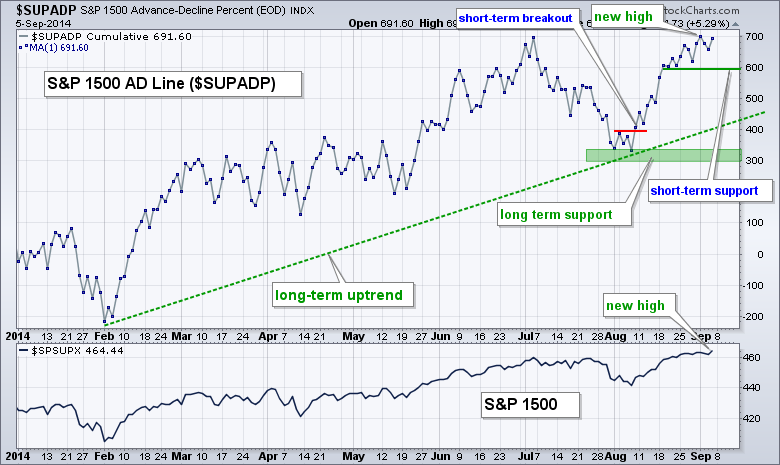
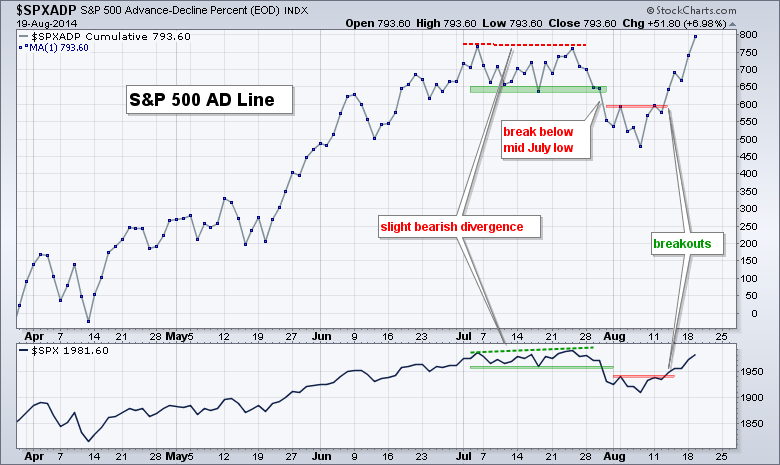
The S&P 1500 AD Line ($SUPADP) and the S&P 1500 AD Volume Line ($SUPUDP) hit new highs to confirm the overall uptrend. This is significant for two reasons. First, a bearish divergence is not possible. A bearish divergence forms when the indicators fail to confirm a...
READ MORE
MEMBERS ONLY
Euro, Gold and Oil Plunge - Stocks Await Non-Farm Payrolls
by Arthur Hill,
Chief Technical Strategist, TrendInvestorPro.com
And now for the employment report... There is nothing to do but wait for the market's reaction to non-farm payrolls on Friday morning. Given recent data, I would expect non-farm payrolls to meet or exceed expectations. On Thursday, the ISM Services Index hit 59.5, which is very...
READ MORE
MEMBERS ONLY
Technical Ranks Jump for Southern Peru Copper and the Base Metals ETF
by Arthur Hill,
Chief Technical Strategist, TrendInvestorPro.com
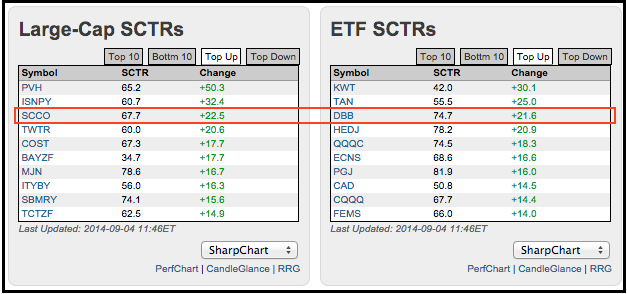
StockCharts users can find the market movers and shakers by checking the SCTR tables on our home page. Click the top up or top down tabs to see securities that show the biggest gains or losses in relative strength. As the table below shows, the StockCharts Technical Ranks (SCTR) for...
READ MORE
MEMBERS ONLY
Small-Cap Breadth Indicator Stalls - Plus GE, PAYX and TM
by Arthur Hill,
Chief Technical Strategist, TrendInvestorPro.com
Stocks started the month overbought and traded flat the last few days. The major index ETFs were again mixed on Wednesday with the Equal-Weight S&P 500 ETF (RSP) edging higher and the S&P 500 SPDR (SPY) edging lower. The sectors were mixed with five up and...
READ MORE
MEMBERS ONLY
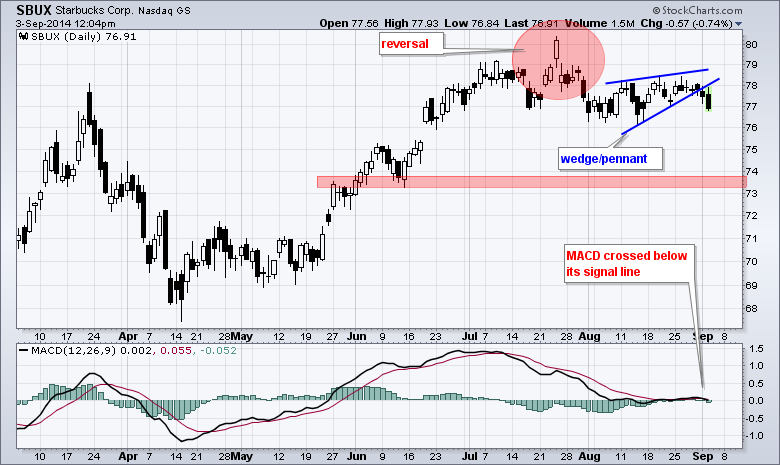
Starbucks Shows Relative and Absolute Weakness
by Arthur Hill,
Chief Technical Strategist, TrendInvestorPro.com
The S&P 500 is up around over 4 percent the last four weeks, but Starbucks is underperforming and is barely positive over the same timeframe. In fact, SBUX is well below its July high and recently broke wedge support. The indicator window shows momentum deteriorating as MACD moves...
READ MORE
MEMBERS ONLY
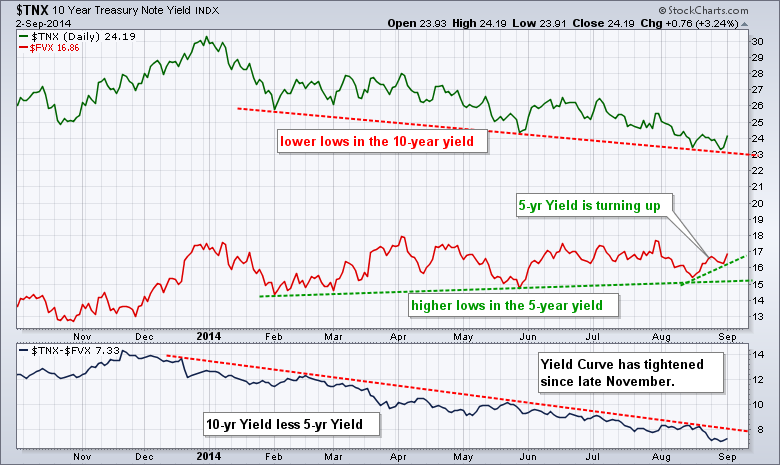
Five Year Yield Surges and Small-caps Start to Lead
by Arthur Hill,
Chief Technical Strategist, TrendInvestorPro.com
It was a mixed day overall, but small-caps and regional banks showed some strength. DIA and SPY edged lower, while IWM and QQQ closely slightly higher. Five of the nine sectors were up with the Finance SPDR (XLF) leading the gainers. The Energy SPDR (XLE) got hammered as Spot Light...
READ MORE
MEMBERS ONLY
GLD Forms Bearish Pattern - Plus BSX, BX, IACI and IP
by Arthur Hill,
Chief Technical Strategist, TrendInvestorPro.com
Stocks remain strong. Period. Even though IWM is underperforming SPY, it is trending higher the last four weeks and participating in the broad market advance. Note that QQQ continues to lead with a new high last week. SPY also hit a new high on Tuesday and Friday's close...
READ MORE
MEMBERS ONLY
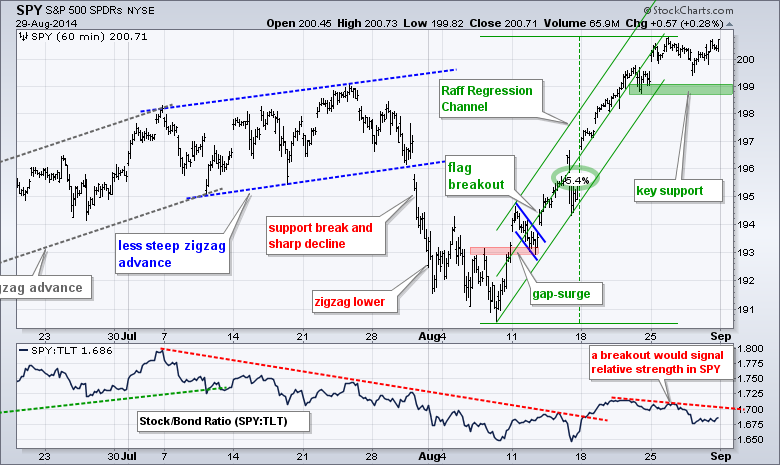
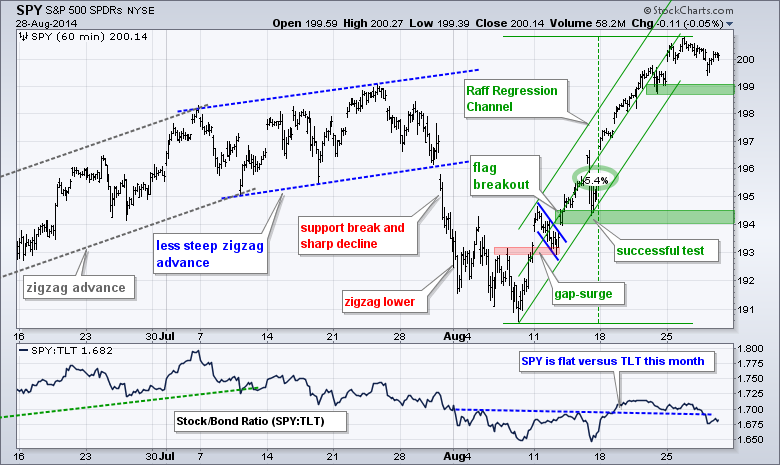
SPY Stalls within Uptrend - TLT Hits New High
by Arthur Hill,
Chief Technical Strategist, TrendInvestorPro.com
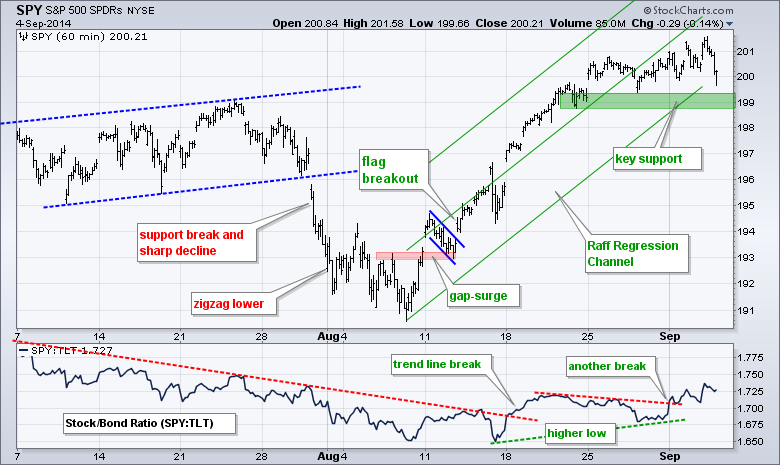
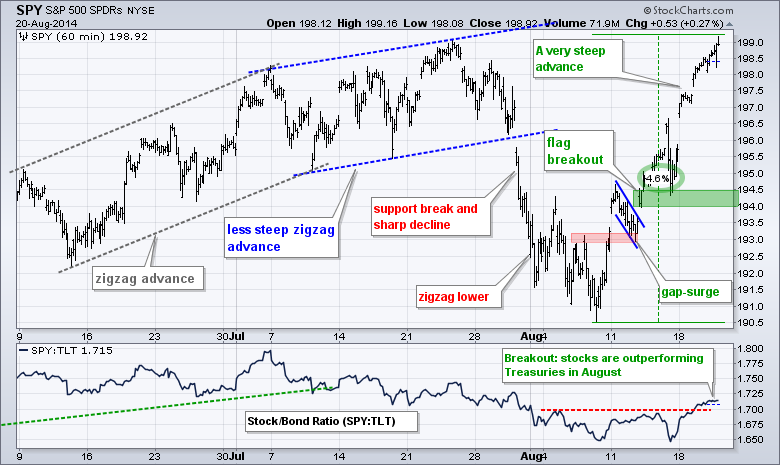
Stocks stalled over the last few days, but the short-term uptrends have yet to reverse. In fact, the existing trends for TLT (up), UUP (up), USO (down) and GLD (down) also remain unchanged. SPY is up around 5% since August 7th. This is a very steep advance and the ETF...
READ MORE
MEMBERS ONLY
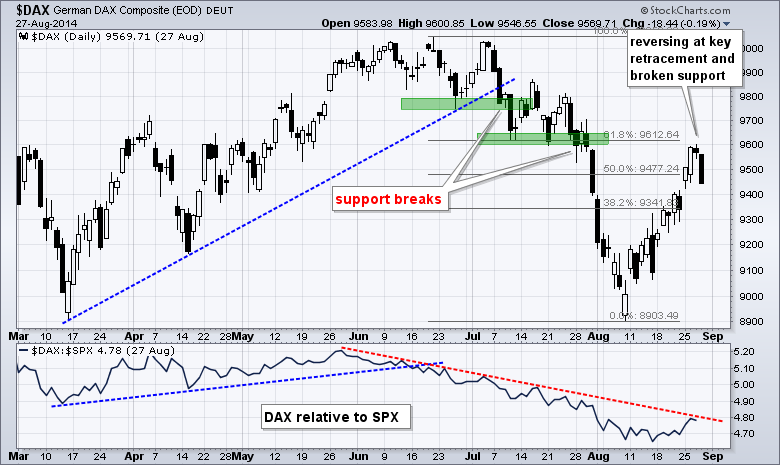
German DAX Reverses Near Key Retracement
by Arthur Hill,
Chief Technical Strategist, TrendInvestorPro.com
The German DAX Index ($DAX) is at an interesting juncture because it broke down in July and then retraced 62% of the prior decline with a bounce in August. Notice that broken support turns into resistance in the 9600 area as well. The index stalled on Wednesday and was trading...
READ MORE
MEMBERS ONLY
TLT Challenges Prior High - Five Chart Setups
by Arthur Hill,
Chief Technical Strategist, TrendInvestorPro.com
Stocks turned mixed on Wednesday with fractional gains and losses in the major index ETFs. The sectors were also mixed, but the Utilities SPDR (XLU) caught a bid and surged 1.09%. Networking stocks weighed on the tech sector as the Networking iShares (IGN) fell .69%. Regional banks weighed on...
READ MORE
MEMBERS ONLY
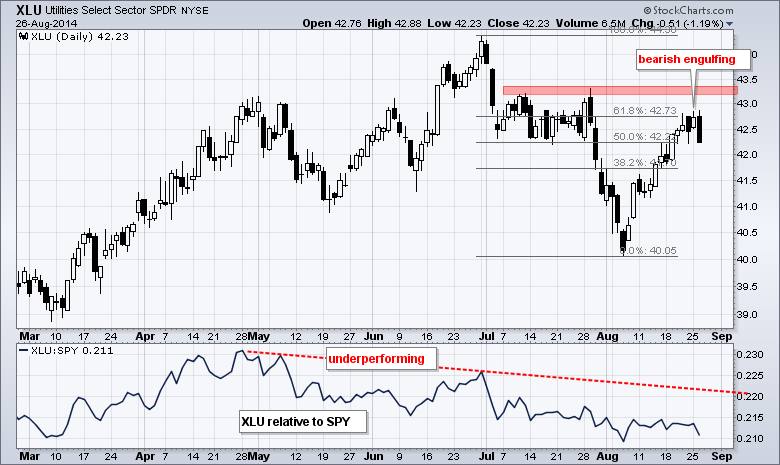
Watching the TLT Channel - XLU Forms Bearish Candle at Key Retracement
by Arthur Hill,
Chief Technical Strategist, TrendInvestorPro.com
Stocks edged higher again with the Russell 2000 iShares (IWM) leading the way, though the gain was just .65%. Eight of the nine sectors were higher with the Energy SPDR (XLE) and Finance SPDR (XLF) leading. The Utilities SPDR (XLU) was the lone loser. As the chart below shows, XLU...
READ MORE
MEMBERS ONLY
IWM Holds Rising Channel - Plus Four Chart Setups
by Arthur Hill,
Chief Technical Strategist, TrendInvestorPro.com
Stocks opened strong and then traded flat the rest of the day. The major index ETFs closed with small gains as the opening surge held. All nine sectors were higher with the Finance SPDR (XLF) and Energy SPDR (XLE) leading the way. Energy is getting an oversold bounce and money...
READ MORE
MEMBERS ONLY
Consumer and Capital Spending Sectors Lead in August
by Arthur Hill,
Chief Technical Strategist, TrendInvestorPro.com
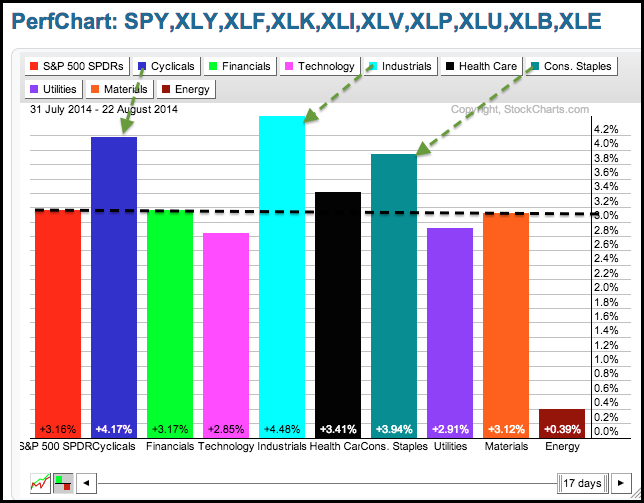
Contrary to seasonal tendencies, August has been a strong month for the stock market. The Sector PerfChart shows the S&P 500 SPDR (SPY) up just over 3% since July 31st. Of the nine sectors, the Industrials SPDR (XLI) and the Consumer Discretionary SPDR (XLY) are up over 4%...
READ MORE
MEMBERS ONLY
Stocks Rally Picks Up Stream as Treasury Yields Diverge
by Arthur Hill,
Chief Technical Strategist, TrendInvestorPro.com
Stocks put in another strong performance last week with the Dow Diamonds (DIA) and S&P MidCap SPDR (MDY) gaining over 2%. All sectors were up with the consumer discretionary, technology, finance and industrials sectors gaining over 2%. It is hard to argue with broad strength in the four...
READ MORE
MEMBERS ONLY
Gold Miners Fail to Hold Breakout - TLT Bounces off Channel
by Arthur Hill,
Chief Technical Strategist, TrendInvestorPro.com
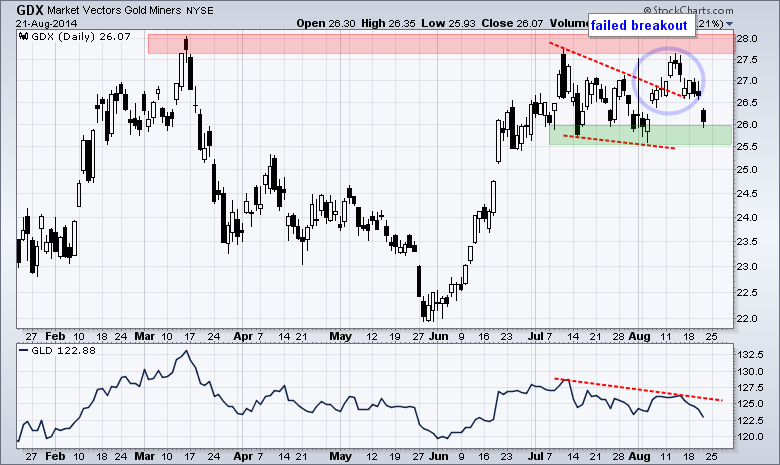
Stocks eked out some gains on Thursday to extend the run that started on August 8th. In particular, the Finance SPDR (XLF) led the way with a 1+ percent gain. Banks and brokers were also higher as the Regional Bank SPDR (KRE) advanced over 1%. Gold returned to its roots...
READ MORE
MEMBERS ONLY
Finance Sector Takes the Green on Sector Carpet
by Arthur Hill,
Chief Technical Strategist, TrendInvestorPro.com
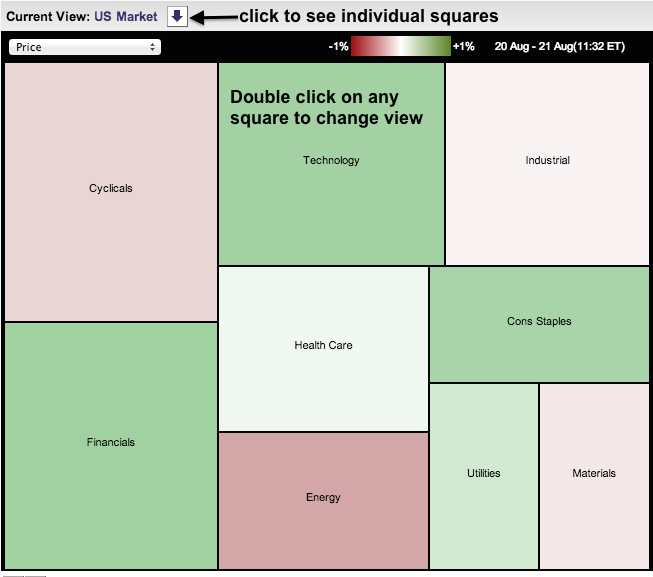
The finance sector is showing strength as the annual conference in Jackson Hole gets under way. Fed Chair Janet Yellen will speak tomorrow and this could move Treasury yields and further affect the group. The image below comes from the Sector Carpet and shows the finance sector leading with a...
READ MORE
MEMBERS ONLY
Three Bull Setups, A Bear and Two that Could Go Either Way
by Arthur Hill,
Chief Technical Strategist, TrendInvestorPro.com
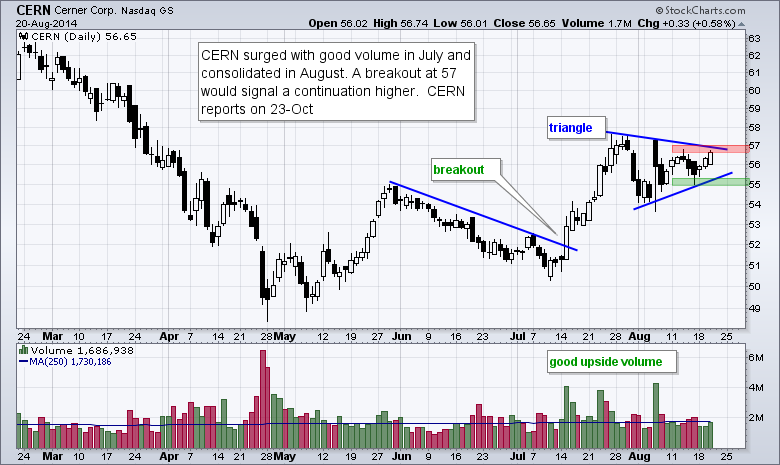
There are six setups today. First, we start with a healthcare stock forming a triangle after an advance. Second, there is a tech stock with a high volume breakout. Third, we have a regional bank reversing just above a support zone. Fourth, there is an internet stock that did not...
READ MORE
MEMBERS ONLY
TLT Tests Channel Support as SPY Challenges July High
by Arthur Hill,
Chief Technical Strategist, TrendInvestorPro.com
Stocks were mixed with the S&P 500 SPDR (SPY) edging higher and the Russell 2000 iShares (IWM) closing modestly lower. Relative weakness in small-caps is a small concern for two reasons. First, IWM represents a little less than 8% of total market cap for the US stock market....
READ MORE
MEMBERS ONLY
Breakouts Turn Support on S&P 500 P&F Chart
by Arthur Hill,
Chief Technical Strategist, TrendInvestorPro.com
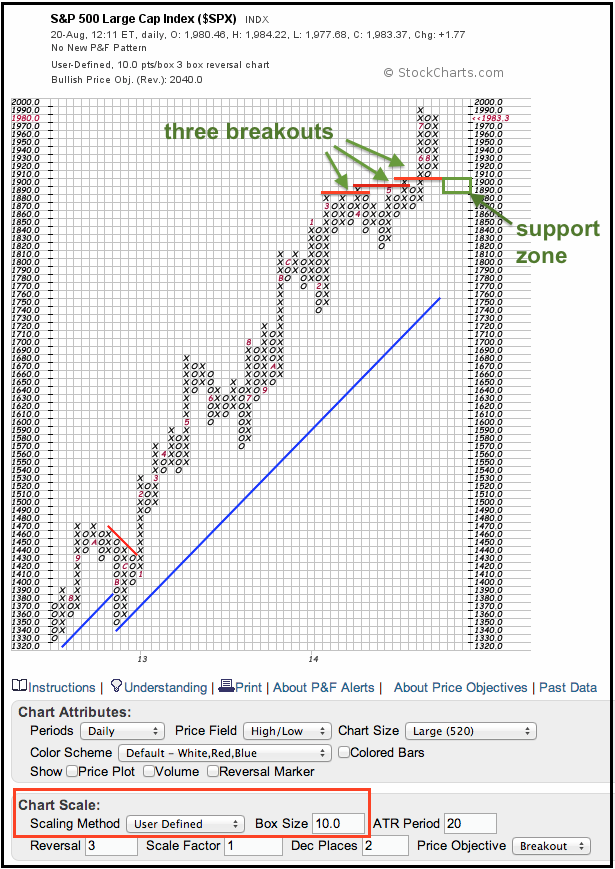
The Point & Figure chart below, which is based on 10 points per box, shows the S&P 500 with successive upside breakouts in April, May and June. A key tenet of technical analysis is that broken resistance turns into support. The green support box, therefore, is based on...
READ MORE
MEMBERS ONLY
SPX AD Line Hits New High as Stocks Surge
by Arthur Hill,
Chief Technical Strategist, TrendInvestorPro.com
Stocks opened strong and remained strong on Tuesday. SPY and IWM are up almost four percent over the last eight days. QQQ is up 4.75% and leading the pack. The advance is getting a little extended for the short-term, but overbought is a sign of strength, not weakness. Of...
READ MORE
MEMBERS ONLY
Small-Caps Take the Lead as Treasuries Trip
by Arthur Hill,
Chief Technical Strategist, TrendInvestorPro.com
Stocks opened strong and closed strong with small-caps leading the way. Eight of the nine sectors were higher with industrials and finance leading. The utilities sector lost ground. The Home Construction iShares (ITB) and the Retail SPDR (XRT) lifted the consumer discretionary sector. Strength in these two groups would be...
READ MORE
MEMBERS ONLY
A Big Internatioal Mining Stock Forming a Large Base
by Arthur Hill,
Chief Technical Strategist, TrendInvestorPro.com
There are five setups today. First, we have a mining and oil concern with a correction underway. Second, we have an auto parts maker firming within a key retracement zone. Third, there is a shipping stock with a triangle breakout. Fourth, we feature a solar energy stock with a high...
READ MORE
MEMBERS ONLY
Delta Flies Above Key Moving Average
by Arthur Hill,
Chief Technical Strategist, TrendInvestorPro.com
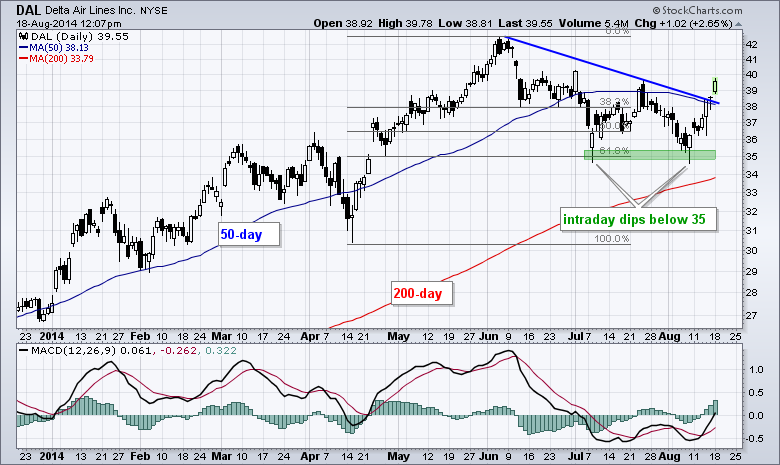
Delta Airlines (DAL) appears to be ending its two month correction with a surge back above the 50-day moving average. Notice how the stock successfully tested the 35 level twice and did not even test the rising 200-day. The recent move above the June trend line and 50-day moving average...
READ MORE
MEMBERS ONLY
Stocks Extend Uptrend as Gold Declines from Resistance
by Arthur Hill,
Chief Technical Strategist, TrendInvestorPro.com
If one follows the financial media, it seems as if Ukraine and Iraq are driving the markets these days. While these two regions are certainly a concern, I am not sure how much lasting influence they will have on the overall direction for US stocks. The German DAX Index ($DAX)...
READ MORE
MEMBERS ONLY
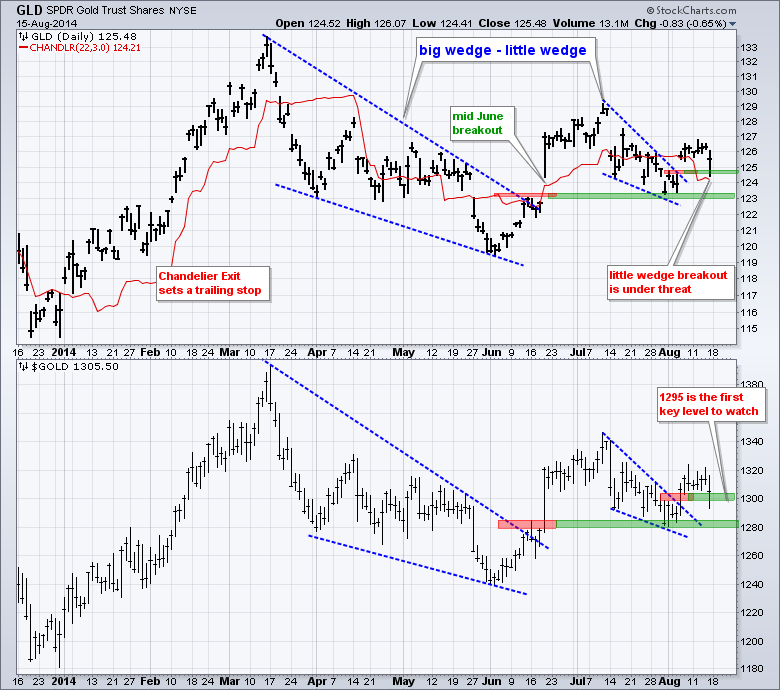
What to Watch on the Gold Breakout
by Arthur Hill,
Chief Technical Strategist, TrendInvestorPro.com
Gold broke out with a surge in early August, but stalled the last eight days and failed to follow through. Despite lack of follow through, the breakout is holding and has yet to be proven other wise. Let's see what it would take to prove this bullish signal...
READ MORE
MEMBERS ONLY
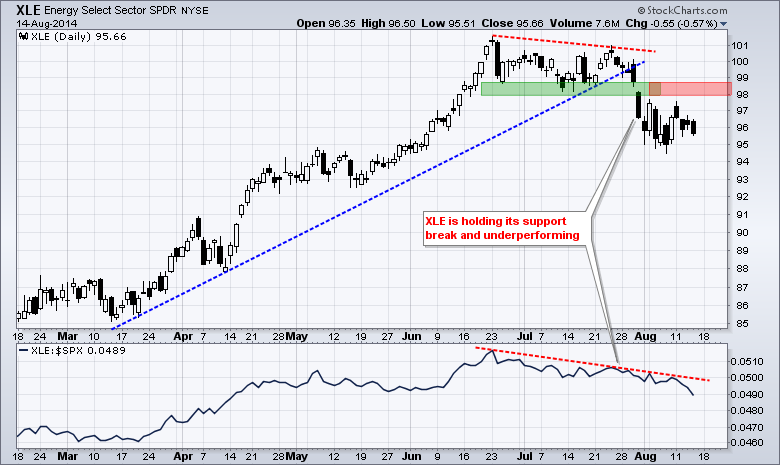
XLE Holds its Break Down - GLD Stalls at Resistance
by Arthur Hill,
Chief Technical Strategist, TrendInvestorPro.com
Stocks edged higher on Thursday with the major index ETFs scoring modest gains. The HealthCare SPDR (and the Utilities SPDR (XLU) led the sectors, while the Energy SPDR (XLE) lagged with a loss. Another break down in Spot Light Crude ($WTIC) weighed on the energy sector. The consumer discretionary sector...
READ MORE
MEMBERS ONLY
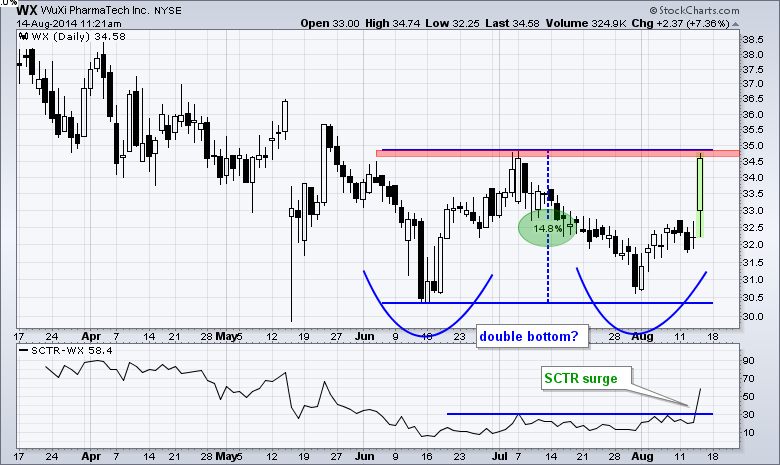
WuXi Surges to Form Bullish Reversal Pattern
by Arthur Hill,
Chief Technical Strategist, TrendInvestorPro.com
WuXi PharmaTech (WX) is a mid cap stock showing a big gain in its StockCharts Technical Rank (SCTR) on Thursday. Notice that the SCTR surged above 50 and to its highest level since May. On the price chart, the two lows in the 30.5 area form a possible double...
READ MORE
MEMBERS ONLY
SPY Breaks Flag Trend Line - Gold is on the Verge
by Arthur Hill,
Chief Technical Strategist, TrendInvestorPro.com
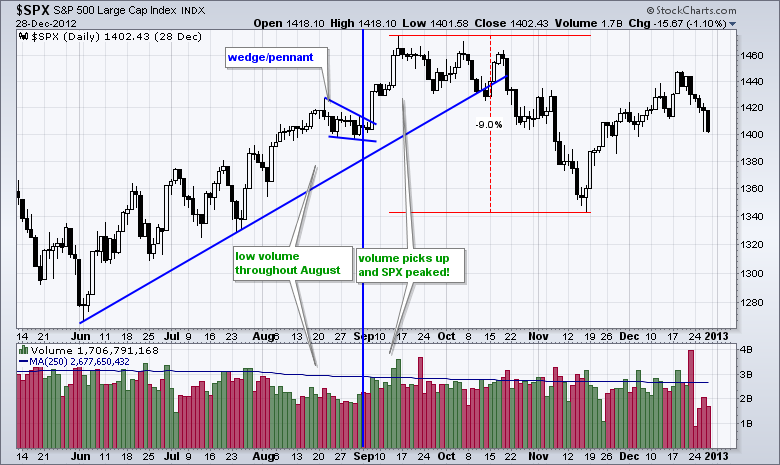
Stocks advanced on Wednesday with a fairly broad-based rally. Volume was low, but volume is supposed to be low in mid August so I would not read too much into this indicator right now. In addition, exchange volume has not been that great of an indicator for signs of accumulation...
READ MORE
MEMBERS ONLY
Four Bullish Setups and One Bearish Setup
by Arthur Hill,
Chief Technical Strategist, TrendInvestorPro.com
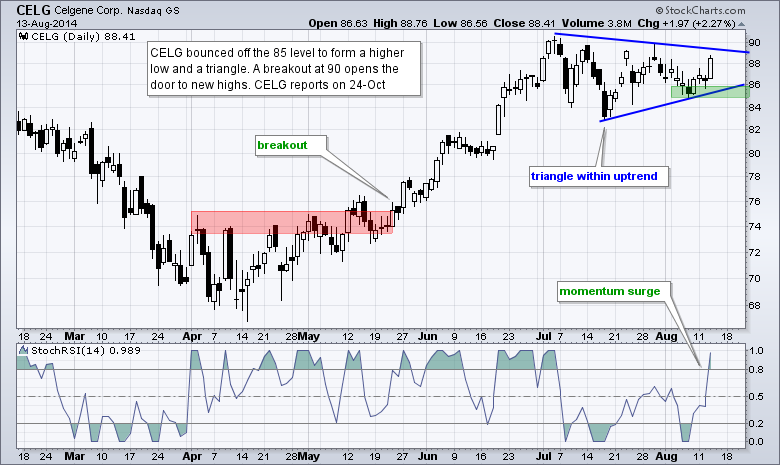
There are five setups today. First, we have a biotech forming a triangle in an uptrend. Second, there is an auto retailer with a bearish wedge. Third, we have a biotech services company with a triangle breakout. Fourth, there is a steel stock showing signs of accumulation. And finally, we...
READ MORE
MEMBERS ONLY
Major Index ETFs Pull Back with Bull Flags
by Arthur Hill,
Chief Technical Strategist, TrendInvestorPro.com
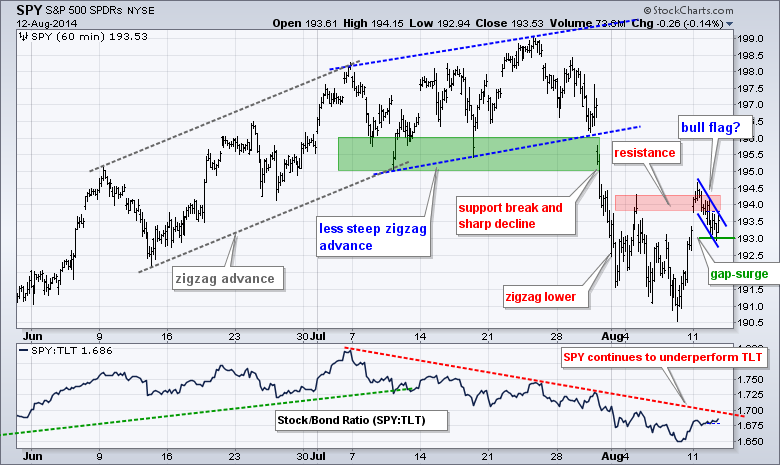
Stocks surge from early Friday to early Monday and then corrected from Monday afternoon to Tuesday. A four day chart reveals a pattern similar to a 1-2 day surge followed by a 1-2 day falling flag. In other words, this week's pullback may just be a mini correction...
READ MORE
MEMBERS ONLY
Five Stocks with Bullish Chart Patterns
by Arthur Hill,
Chief Technical Strategist, TrendInvestorPro.com
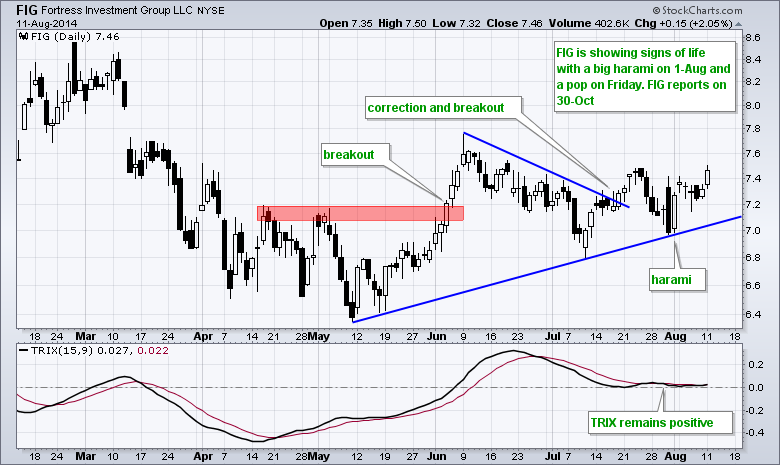
There are five setups today. First, we have an investment manager with follow through to a big harami. Second, there is an airline making a breakout. Third, we feature a volatile online real estate stock with a bullish consolidation. Fourth, there is a truck part manufacturer with a gap and...
READ MORE