MEMBERS ONLY
A Theme Emerges within a Bear Market
by Arthur Hill,
Chief Technical Strategist, TrendInvestorPro.com
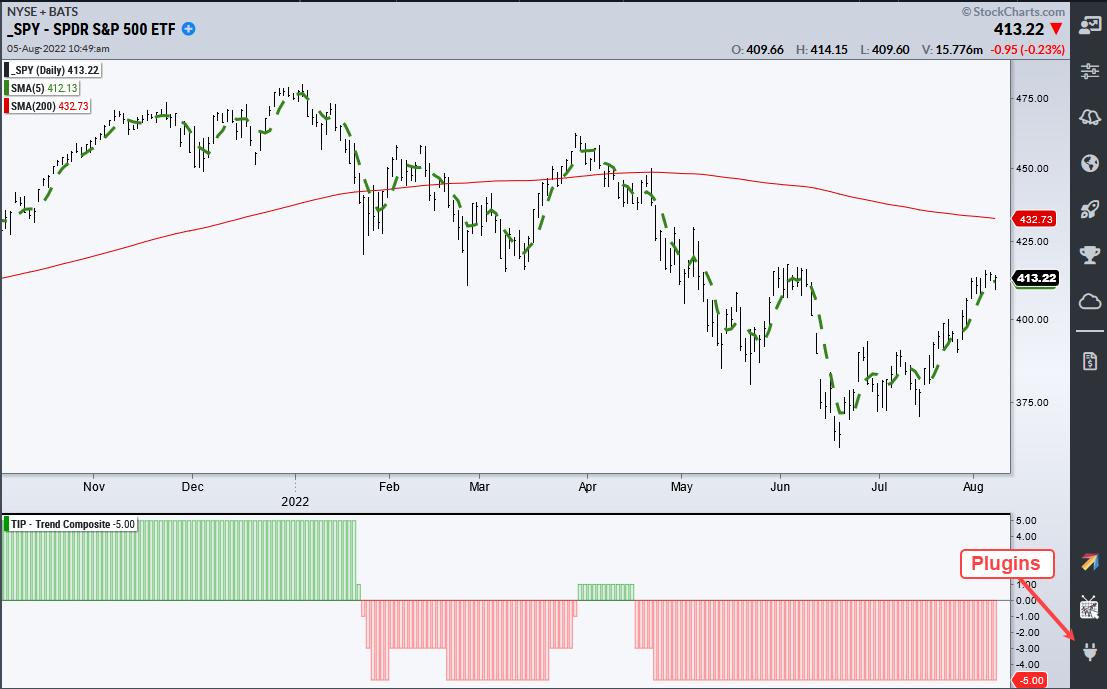
The Composite Breadth Model at TrendInvestorPro has been bearish since April 11th and remains bearish, which suggests that the current bounce in SPY is a counter-trend advance within a bigger downtrend. Also note that the 5-day SMA for SPY is below the falling 200-day SMA and the Trend Composite is...
READ MORE
MEMBERS ONLY
TAN Follows Trend Composite Signal with Breakout
by Arthur Hill,
Chief Technical Strategist, TrendInvestorPro.com
Led by its top two components, Enphase (ENPH) and Solar Edge (SEDG), the Solar Energy ETF (TAN) followed a bullish signal from the Trend Composite with a big breakout to confirm a large bullish reversal pattern.
Let's start with the Trend Composite, which aggregates trend signals in five...
READ MORE
MEMBERS ONLY
Trend Signals for the Big Sectors Tell the Story
by Arthur Hill,
Chief Technical Strategist, TrendInvestorPro.com
Last week I wrote about the downtrend in SPY and showed a resistance/reversal zone based on broken supports and the 50% retracement line. SPY failed at this zone and moved sharply lower this past week. This is hardly surprising because the Market Regime is bearish and bearish outcomes are...
READ MORE
MEMBERS ONLY
Bearish Market Regime and Downtrend Weigh on SPY
by Arthur Hill,
Chief Technical Strategist, TrendInvestorPro.com
The S&P 500 SPDR (SPY) is in a long-term downtrend and the Composite Breadth Model at TrendInvestorPro is bearish. A bearish Market Regime is a dangerous combination for stocks. The S&P 500 is the most important benchmark for US stocks, while the Composite Breadth Model measures...
READ MORE
MEMBERS ONLY
Palladium: A Trend Changing Event or Correction Overshoot?
by Arthur Hill,
Chief Technical Strategist, TrendInvestorPro.com
There are two commodity ETFs with falling wedge patterns working. One falling wedge resulted in a deep pullback and the other in a shallow pullback. Either way, I view these falling wedges as corrections within uptrends and am watching for breakouts. This article will look at the deep pullback in...
READ MORE
MEMBERS ONLY
Base Metals ETF Survives Onslaught and Makes a Turn
by Arthur Hill,
Chief Technical Strategist, TrendInvestorPro.com
The DB Base Metals ETF (DBB) is reversing its downswing after becoming oversold within an uptrend. This analysis will cover the long-term trend using the chart and Trend Composite, the oversold conditions using the Momentum Composite and the short-term breakout over the last few days.
DBB fell some 18% from...
READ MORE
MEMBERS ONLY
A Key Factor in the Trading Puzzle
by Arthur Hill,
Chief Technical Strategist, TrendInvestorPro.com
The bigger trend is one of the most important factors to consider when trading stocks or ETFs. We can use trend signals as part of a trend-following strategy or to dictate our trading bias. I look for bullish setups and pullback opportunities when the trend is up. When the trend...
READ MORE
MEMBERS ONLY
A Defensive Picture No Matter How you Slice It
by Arthur Hill,
Chief Technical Strategist, TrendInvestorPro.com
Sector PerfCharts provide clear performance snapshots of the market mood and the market mood is defensive. The PerfCharts below show the percentage change for the S&P 500 SPDR (SPY) and the eleven sectors. These sectors can be divided into three groups: offensive sectors, defensive sectors and other.
The...
READ MORE
MEMBERS ONLY
Using Sentiment to Measure Short-term Extremes
by Arthur Hill,
Chief Technical Strategist, TrendInvestorPro.com
After a big surge in the second half of March, stocks fell back this week as the S&P 500 declined around 2%. This modest decline is warranted after the March surge, but it was not enough to push sentiment to an extreme. The AAII Bears are back above...
READ MORE
MEMBERS ONLY
Wild Swings and a Classic Setup for Palladium
by Arthur Hill,
Chief Technical Strategist, TrendInvestorPro.com
Volatility is through the roof for many commodities and commodity-related ETFs, but this does not mean we have to abandon technical analysis and classic setups. High volatility does, however, imply higher risk and we probably need to give setups a little more wiggle room.
The Palladium ETF (PALL) surged over...
READ MORE
MEMBERS ONLY
Trading Themes to Watch Going Forward
by Arthur Hill,
Chief Technical Strategist, TrendInvestorPro.com
Several trading themes emerged over the past month and these themes could have legs. Russia invaded Ukraine a month ago and the broader market is significantly higher since the invasion. The Russell 2000 ETF is up 6.81%, the S&P 500 SPDR is 7.29% higher and the...
READ MORE
MEMBERS ONLY
SPY Gets its Biggest Surge since November 2020. Is it Enough?
by Arthur Hill,
Chief Technical Strategist, TrendInvestorPro.com
The S&P 500 SPDR (SPY) surged 5.77% from Tuesday to Thursday and this was the biggest 3-day surge since the 6.07% advance on November 5th, 2020. This early November surge led to a breakout and the advance extended until January 2022. The current surge also shows...
READ MORE
MEMBERS ONLY
The Damage is Done with the Expansion of New Lows
by Arthur Hill,
Chief Technical Strategist, TrendInvestorPro.com
The broad market environment is the single most important factor to consider when investing in stocks or stock-related ETFs. Are we in a bull market or a bear market? The recent expansion of new lows and the 5/200 cross in the S&P 500 suggest that we are...
READ MORE
MEMBERS ONLY
Silver Plays Catchup with the Other Commodities
by Arthur Hill,
Chief Technical Strategist, TrendInvestorPro.com
The pickings are rather slim in the market with just 61 of the 276 ETFs in the TrendInvestorPro Master List in uptrends. Unsurprisingly, most of the ETFs in uptrends are related to commodities (energy, metals, agriculture). Outside of commodities, we are seeing uptrends in ETFs related to consumer staples, utilities,...
READ MORE
MEMBERS ONLY
Charting a Future Possibility versus the Current Reality
by Arthur Hill,
Chief Technical Strategist, TrendInvestorPro.com
The chart below shows the Cybersecurity ETF (CIBR) with two sets of annotations: a future possibility and the current reality. The future possibility shows that a bullish reversal could be in the making as the ETF held the January low and surged late last week. The current reality, however, is...
READ MORE
MEMBERS ONLY
A Winner is Emerging in the Battle for the Large-cap Trend
by Arthur Hill,
Chief Technical Strategist, TrendInvestorPro.com
Buyers and sellers are slugging it out for control of the long-term trend for the S&P 500. This battle is raging near the 200-day SMA, which is perhaps the most widely followed long-term moving average. The S&P 500 is also the most widely followed benchmark for...
READ MORE
MEMBERS ONLY
Metals & Mining SPDR Goes for Relative and Absolute Breakouts
by Arthur Hill,
Chief Technical Strategist, TrendInvestorPro.com
It's been a rough year for much of the market, but the Metals & Mining SPDR (XME) is bucking the selling pressure as it challenges its 2021 highs and the price relative breaks out. There is also a big bullish continuation pattern at work. Note that 40% of...
READ MORE
MEMBERS ONLY
Reduce Whipsaws and Improve Performance with a Simple Filter
by Arthur Hill,
Chief Technical Strategist, TrendInvestorPro.com
The 200-day SMA is quite the battle zone when it comes to the S&P 500. In fact, the index has crossed this key moving average 165 times since 2000. That's a lot of crosses, and a lot of needless whipsaws. Chartists can reduce whipsaws and improve...
READ MORE
MEMBERS ONLY
An Indicator to Keep you on the Right Side of the Trend (QQQ)
by Arthur Hill,
Chief Technical Strategist, TrendInvestorPro.com
The Nasdaq 100 ETF (QQQ) reversed its uptrend signal from April 17th, 2020 as two trend-following indicators turned bearish this week. The chart below shows QQQ with the deepest decline from a high since the 10.9% decline in February-March 2021. Prior to that, the deepest decline was in September...
READ MORE
MEMBERS ONLY
Another Bullish Pattern for the Agriculture ETF
by Arthur Hill,
Chief Technical Strategist, TrendInvestorPro.com
The DB Agriculture ETF (DBA) was featured in ChartWatchers on October 1st as it formed a large cup-with-handle pattern, which is a bullish continuation pattern. The ETF battled its resistance zone the rest of the month and broke out to new highs in November. Flash forward to January and we...
READ MORE
MEMBERS ONLY
Realistic Expectations for Setups and Signals
by Arthur Hill,
Chief Technical Strategist, TrendInvestorPro.com
Setting expectations is part of a strategy and this includes expectations for the number of signals we can expect in any given year. Signal frequency, of course, depends on your strategy and timeframe. Short-term mean-reversion strategies generate more signals than swing strategies and swing strategies generate more signals than long-term...
READ MORE
MEMBERS ONLY
Networking Leads and this Stock Could be Next
by Arthur Hill,
Chief Technical Strategist, TrendInvestorPro.com
The Networking ETF (IGN) is leading the market with a solid uptrend and a new high this week. Diving into the group, I found a stock that recently broke out and formed a short-term bullish continuation pattern. The stock is also in an uptrend and I expect a breakout to...
READ MORE
MEMBERS ONLY
Oil & Gas Equipment & Services ETF Makes a Bid to End its Big Digestion
by Arthur Hill,
Chief Technical Strategist, TrendInvestorPro.com
The Oil & Gas Equipment & Services ETF (XES) was one of the leading industry group ETFs in the spring after it surged some 164% off its November low. This was clearly a massive gain and the ETF was entitled to a rest. Big meals require long digestive periods and...
READ MORE
MEMBERS ONLY
More Signs of Risk Aversion in the Financial Markets
by Arthur Hill,
Chief Technical Strategist, TrendInvestorPro.com
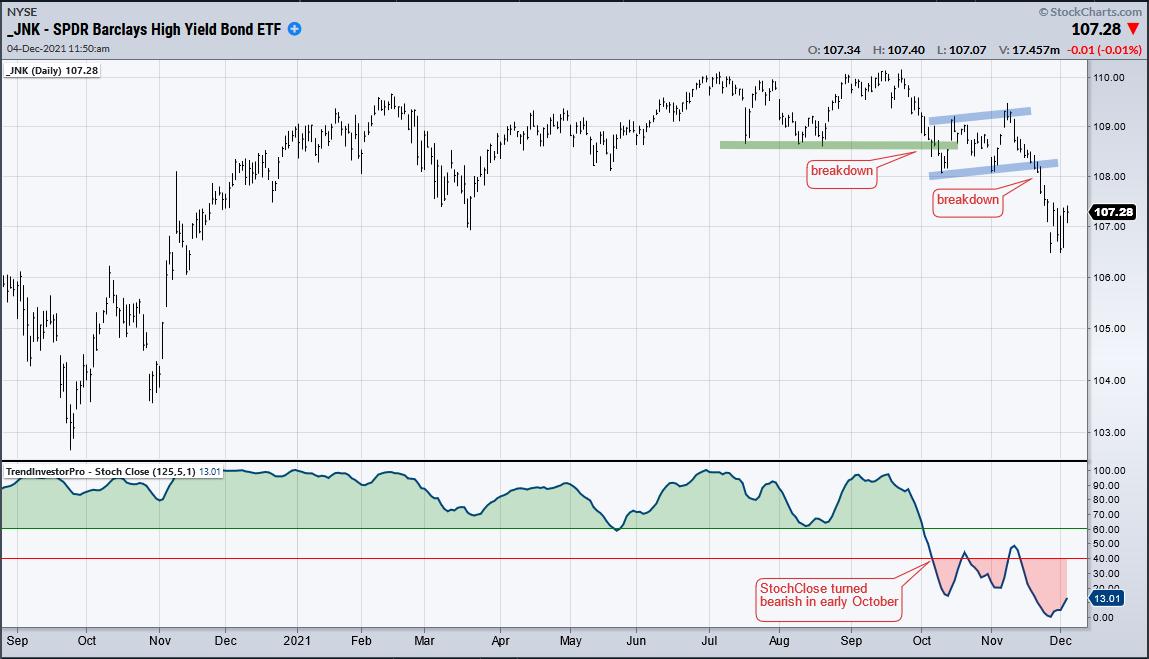
Signs of risk aversion are increasing in the financial markets. Risk aversion first appeared in the junk bond market in October and this week we are seeing money move into Treasury bonds, the ultimate safe-haven assets.
Junk bonds have the highest risk because they are the lowest-rated corporate bonds. As...
READ MORE
MEMBERS ONLY
Trend Monitoring and Setup Phases for SPY
by Arthur Hill,
Chief Technical Strategist, TrendInvestorPro.com
Note that this article has been revised to account for Friday's price action. Stocks were slammed on Black Friday with small-caps leading the way lower and stay-at-home stocks bouncing. The declines were big, but they should be put into perspective. First, Black Friday is pretty much a holiday...
READ MORE
MEMBERS ONLY
The 10-yr Treasury Yield and Relative Performance for Small-caps
by Arthur Hill,
Chief Technical Strategist, TrendInvestorPro.com
The surge in the 10-yr Treasury Yield is the talk of the town this week, and last week it was the breakout in the Russell 2000 ETF and relative strength in small-caps. Is there a correlation between small-cap relative performance and Treasury yields? Today's commentary will look at...
READ MORE
MEMBERS ONLY
Trend-Following: The Good, the Bad and the Ugly
by Arthur Hill,
Chief Technical Strategist, TrendInvestorPro.com
We have all heard of trend-following and many us employ trend indicators in our strategies. But how do these indicators actually perform over an extended period of time and in varying market conditions? Let's look at an example.
The chart below shows Alphabet (GOOGL) with two trend indicators:...
READ MORE
MEMBERS ONLY
Trend Indicator Turns Bullish for IWM: What should we Expect?
by Arthur Hill,
Chief Technical Strategist, TrendInvestorPro.com
Moving averages are classic trend-following indicators and the 200-day SMA is perhaps the most widely used long-term moving average. This article will put the 200-day to the test using the Russell 2000 ETF (IWM).
The ETF just came off its best "trend" trade ever using the 5/200...
READ MORE
MEMBERS ONLY
Get the Jump by Timing the Swing within the Pattern
by Arthur Hill,
Chief Technical Strategist, TrendInvestorPro.com
The Infrastructure ETF (IFRA) came to life here in October with a six percent surge that could signal the beginning of the end for a long correction. IFRA underperformed from May to mid September, but is now showing some relative strength. We will look at the long-term picture and show...
READ MORE
MEMBERS ONLY
Follow Through with A Big Participation Pop
by Arthur Hill,
Chief Technical Strategist, TrendInvestorPro.com
Stocks surged for the second Thursday in as many weeks, but this Thursday's surge was a lot different than the previous week. This week's surge featured a strong open and strong close as well as the strongest breadth in four months. What does it mean going...
READ MORE
MEMBERS ONLY
A Strong Uptrend and Bullish Continuation Pattern for this Agriculture ETF
by Arthur Hill,
Chief Technical Strategist, TrendInvestorPro.com
Chartists looking to trade in the direction of the bigger trend have two options. First, take trend signals and act when the trend turns up. Once an uptrend is underway, chartists must then rely on pullbacks, short-term oversold conditions and bullish continuation patterns to hitch a ride. Today's...
READ MORE
MEMBERS ONLY
Bonds Throw a Tantrum and Banks Cheer
by Arthur Hill,
Chief Technical Strategist, TrendInvestorPro.com
The 20+ Yr Treasury Bond ETF (TLT) threw a tantrum this week with the biggest two day decline since March 2020, which was a very chaotic month. With a sharp decline in bonds, the 10-yr Treasury Yield broke above its summer highs and the bulls stampeded into the Regional Bank...
READ MORE
MEMBERS ONLY
AAII Percent Bears Surges, but Excessive Sentiment is not a Two-Way Street
by Arthur Hill,
Chief Technical Strategist, TrendInvestorPro.com
The AAII indicators are making waves this week so I will cover two charts. AAII percent bears surged to 39.3% and percent bulls dropped to 22.40%. As a result, net bull-bear percentage plunged to -16.90%, the first negative reading since September 2020. Note that the remaining 38....
READ MORE
MEMBERS ONLY
New Trend Signals: Act Now or Wait for a Pullback?
by Arthur Hill,
Chief Technical Strategist, TrendInvestorPro.com
Chartists often face a conundrum when a new trend signal triggers because the stock or ETF is frequently extended when this signal triggers. After all, it takes strong buying pressure for a new uptrend to signal. Short-term overbought or extended conditions are long-term bullish, but these same conditions can lead...
READ MORE
MEMBERS ONLY
New Trend Signal for a Former High Flyer
by Arthur Hill,
Chief Technical Strategist, TrendInvestorPro.com
Today's commentary will start with price chart analysis for a clean energy ETF, which once led the market with triple digit gains. After a corrective period, it appears that this high flying ETF and a few of its brethren are turning up again with recent trend signals. We...
READ MORE
MEMBERS ONLY
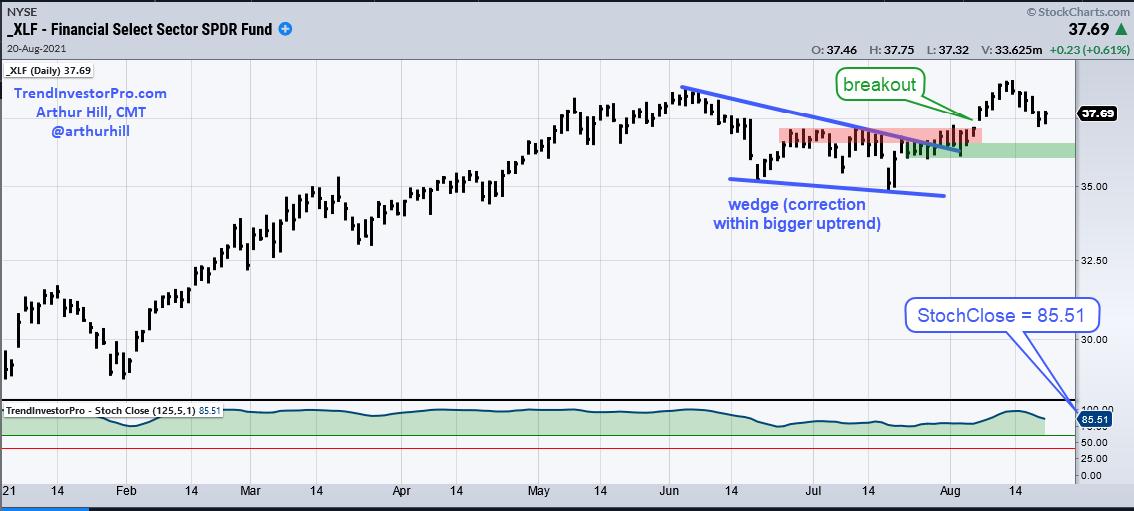
Finance Sector Holds Breakout and Establishes Line in the Sand
by Arthur Hill,
Chief Technical Strategist, TrendInvestorPro.com
The Finance SPDR (XLF) is one of the leading sectors and recently broke out of a falling wedge correction. There was a little throwback this week, but the breakout is holding and remains bullish until proven otherwise. Let's see what it would take to prove otherwise.
First and...
READ MORE
MEMBERS ONLY
Using RSI to Identify Trend Reversals - XOP Example with Short-term Bearish Setup
by Arthur Hill,
Chief Technical Strategist, TrendInvestorPro.com
RSI is a momentum oscillator that many chartists use to identify overbought and oversold levels. While RSI above 70 is typically considered an overbought condition, it is also a sign of strong upside momentum that can signal the start of an extended advance. Conversely, RSI below 30 is considered an...
READ MORE
MEMBERS ONLY
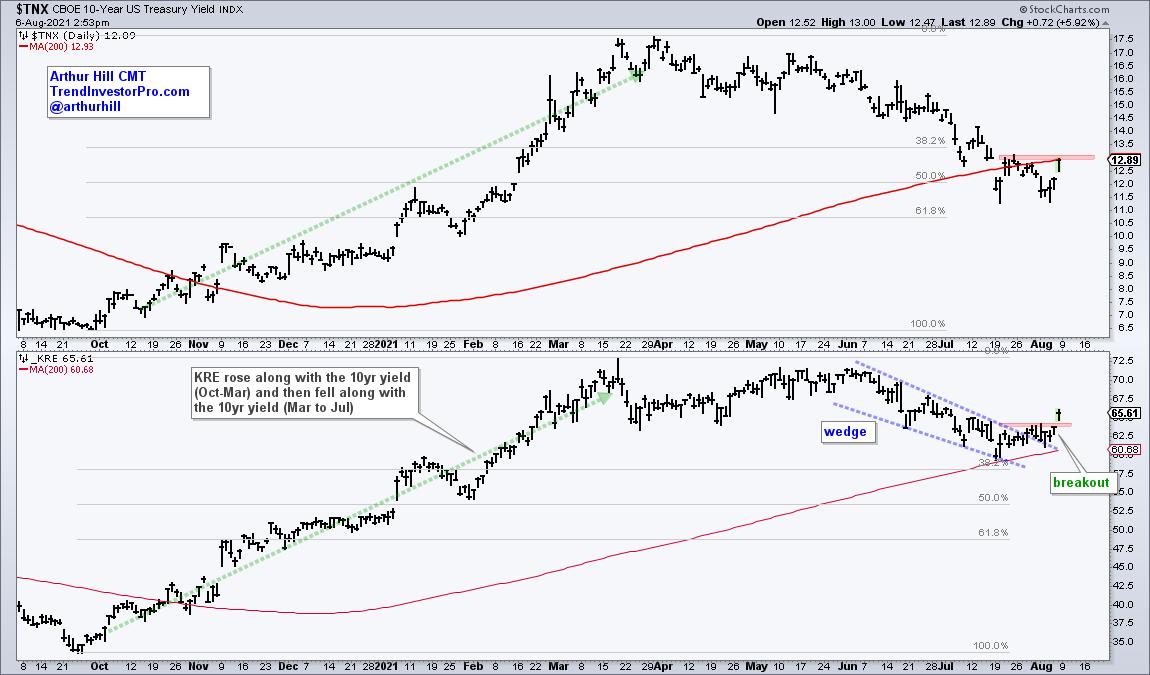
Regional Banks Take Their Cue from the 10-Year Yield
by Arthur Hill,
Chief Technical Strategist, TrendInvestorPro.com
The Regional Bank ETF (KRE) and the 10-yr Treasury Yield are positively correlated and the recent surge in the 10-yr yield led to a breakout in the Regional Bank ETF. More importantly, this breakout signals an end to a corrective period and a resumption of the bigger uptrend. As noted...
READ MORE
MEMBERS ONLY
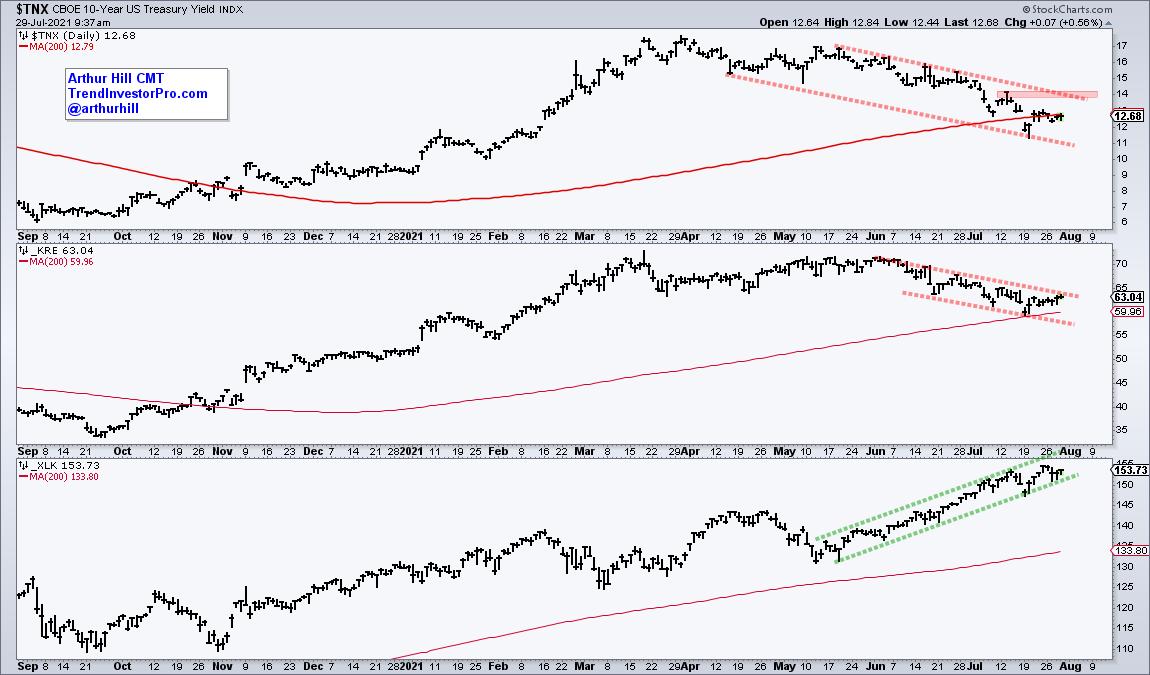
The 10-yr Yield, Banks, Techs and Rotation
by Arthur Hill,
Chief Technical Strategist, TrendInvestorPro.com
The decline in the 10-yr yield is not the only factor at work in the markets, but there is clearly a correlation at work recently, especially with banks. The chart below shows the 10-yr Yield ($TNX) and Regional Bank ETF (KRE) falling from mid May to July. Meanwhile, the Technology...
READ MORE
MEMBERS ONLY
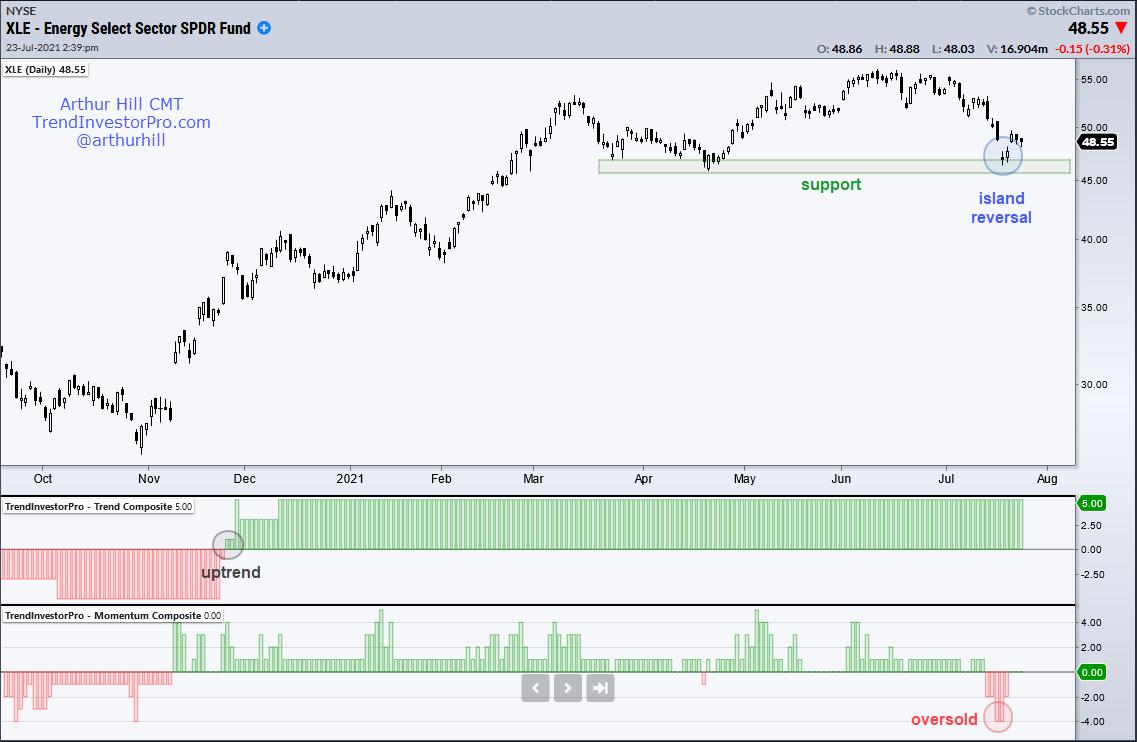
XLE Bids to End Correction and Resume Uptrend
by Arthur Hill,
Chief Technical Strategist, TrendInvestorPro.com
The Energy SPDR (XLE) is setting up to end its correction and resume its bigger uptrend.
First and foremost, the long-term trend is up because the Trend Composite signaled an uptrend (gray circle) in late November when the majority of indicators turned bullish. There are five trend-following indicators in the...
READ MORE