MEMBERS ONLY
Breadth Indicators Hit New Highs and Small Caps Perk Up
by Arthur Hill,
Chief Technical Strategist, TrendInvestorPro.com
The bulk of the evidence remains bullish as stocks continue in strong uptrends. The Nasdaq AD Line and AD Volume Line hit new highs as techs led the market in November. The NYSE AD Line and AD Volume Line are lagging somewhat, but are nowhere close to breaking down and...
READ MORE
MEMBERS ONLY
SPY Extends on Flag - $NATGAS Surges thru Resistance
by Arthur Hill,
Chief Technical Strategist, TrendInvestorPro.com
Stocks extended their corrective ways as the S&P 500 ETF (SPY) lost ground for the fifth consecutive day. Bespoke reports that 1996 was the last time the S&P 500 started December with a five day decline. Maybe so, but the index is down a mere 1....
READ MORE
MEMBERS ONLY
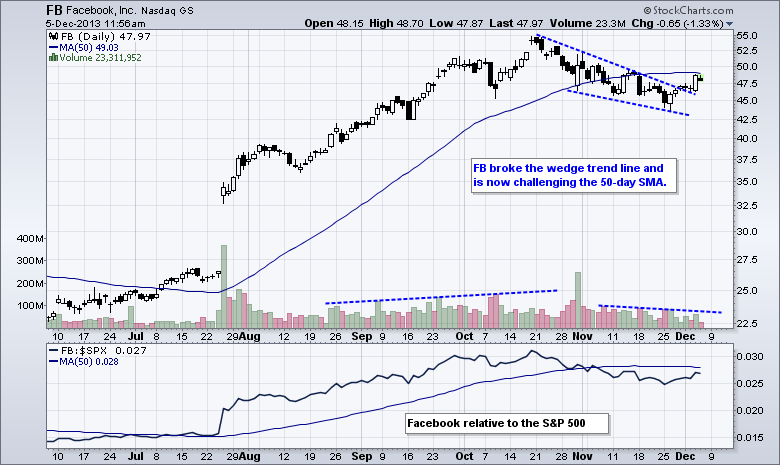
Facebook Challenges Key Moving Average
by Arthur Hill,
Chief Technical Strategist, TrendInvestorPro.com
Facebook (FB) got a bounce over the last seven days and broke above the wedge trend line. This is the first step to ending the correction that started in mid October. The 50-day moving average is the next hurdle. A follow thru break above this moving average on good...
READ MORE
MEMBERS ONLY
IWM Hits Moment of Truth - TLT Falls Sharply
by Arthur Hill,
Chief Technical Strategist, TrendInvestorPro.com
Stocks extended their mixed correction with weakness for the third day running. The declines, however, remain very modest and selling pressure has been contained. The Russell 2000 ETF (IWM) lost .27% on the day, while the Nasdaq 100 ETF (QQQ) edged higher with a .09% gain. Microsoft led QQQ higher...
READ MORE
MEMBERS ONLY
Charts of Interest: ATVI, CHRW, EMC, FFIV, TIBX
by Arthur Hill,
Chief Technical Strategist, TrendInvestorPro.com
ATVI Triangulates with Two Patterns.
CHRW Tests Key Support Level.
Plus EMC, FFIV and TIBX
Individual charts are below video.
Sorry but your browser doesn't support HTML5 video.
Click here for iPad/iPhone Version
**This chart analysis is for educational purposes only, and should not
be construed as...
READ MORE
MEMBERS ONLY
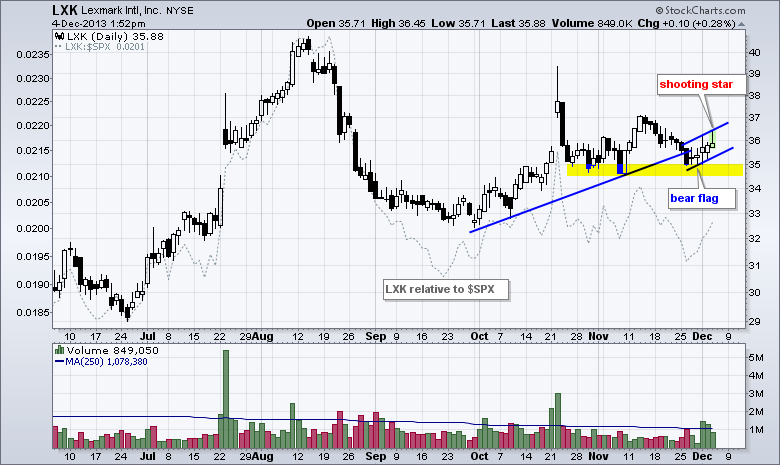
Lexmark Bounces off Support with Good Volume
by Arthur Hill,
Chief Technical Strategist, TrendInvestorPro.com
Lexmark (LXK) presents a conundrum for traders. On the bullish side, the stock bounced off support near 35 with a three day advance on pretty good volume. Relative to the market, the stock is also holding up pretty well the last three days. On the bearish side, the stock shows...
READ MORE
MEMBERS ONLY
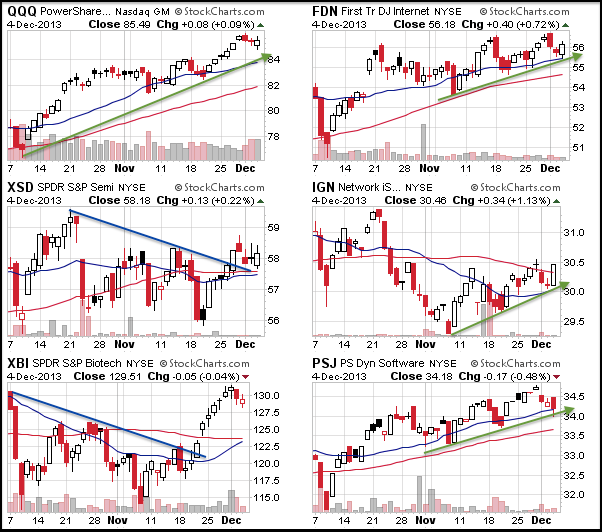
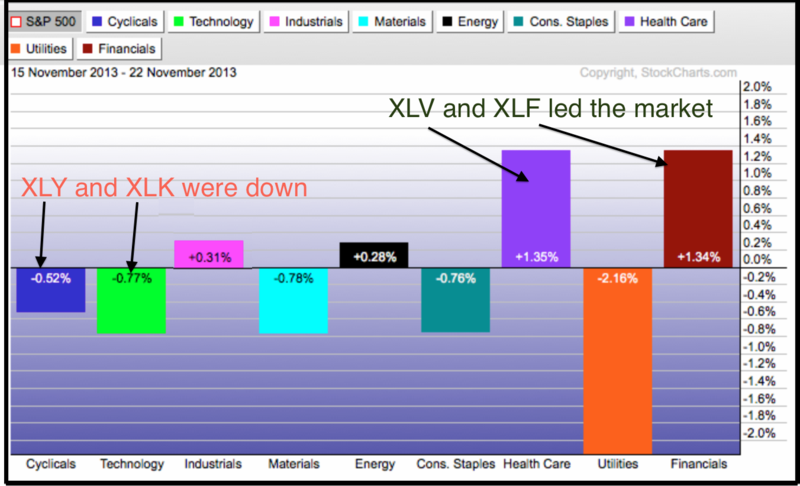
Tech Sector Shows Relative Strength During Correction
by Arthur Hill,
Chief Technical Strategist, TrendInvestorPro.com
The major index ETFs corrected over the last two days, but this correction turned mixed as the tech sector held up relatively well on Tuesday. Also notice that the declines in the major index ETFs were modest and not that significant, especially considering the big gains from November. The PerfChart...
READ MORE
MEMBERS ONLY
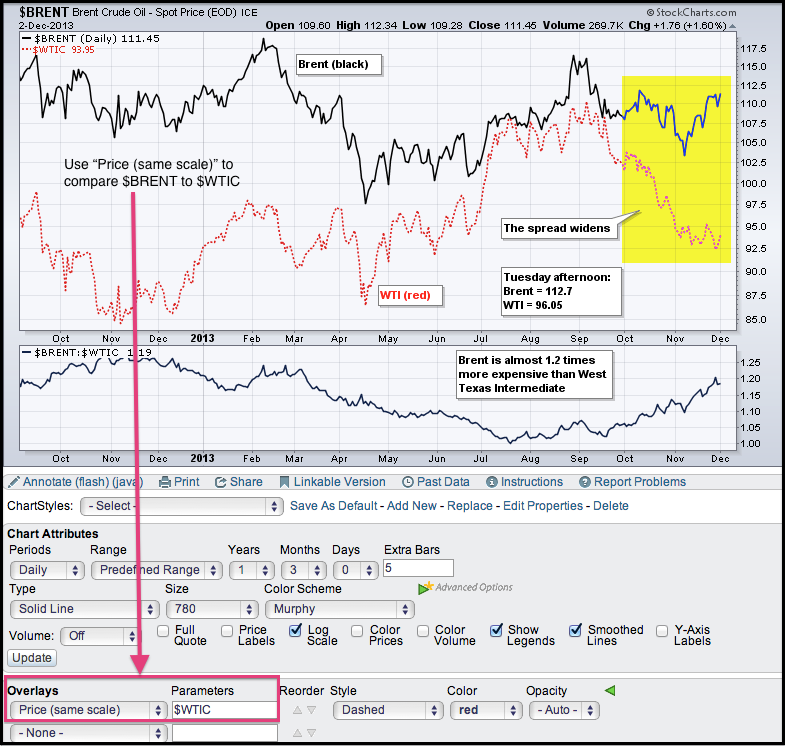
WTI Surges, but Brent-WTI Spread Remains Large
by Arthur Hill,
Chief Technical Strategist, TrendInvestorPro.com
Brent Crude ($BRENT) surged above $110 this week and WTI Crude ($WTIC) moved above $96, but the spread between the two remains wide. The chart below shows Brent trading some $18 higher than WTI. The indicator window shows the $BRENT:$WTIC ratio nearing 1.2 for the first time since...
READ MORE
MEMBERS ONLY
Gold Nears July Low as Dollar Firms at Support
by Arthur Hill,
Chief Technical Strategist, TrendInvestorPro.com
After a two week surge at the end of November, stocks started December with some selling pressure. Small-caps and micro-caps led the two week surge, and the Monday pullback. The Russell 2000 ETF (IWM) fell 1% and the Russell Micro Cap ETF (IWC) fell 1.44%. The sectors...
READ MORE
MEMBERS ONLY
Charts of Interest: AMT, AN, CY, FB, PLCM, TER
by Arthur Hill,
Chief Technical Strategist, TrendInvestorPro.com
AMT Bounces off Key Retracement with Volume.
AN Forms Flag after Wedge Break.
Plus CY, FB, PLCM and TER.
Individual charts are below video.
Sorry but your browser doesn't support HTML5 video.
Click here for iPad/iPhone Version
**This chart analysis is for educational purposes only, and should...
READ MORE
MEMBERS ONLY
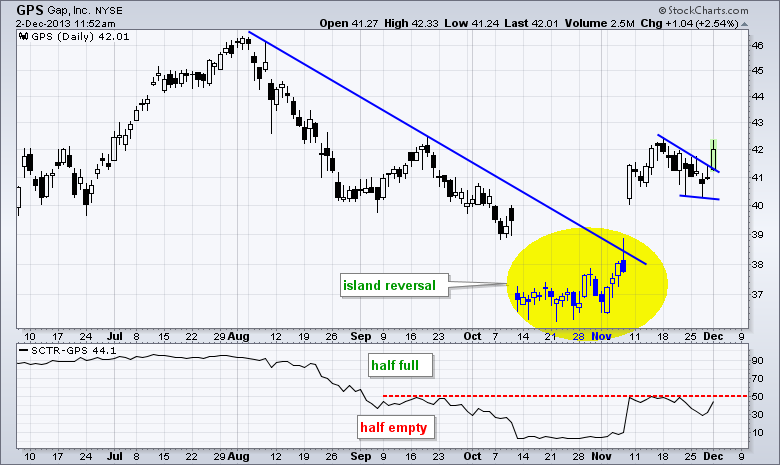
SCTR Surges as Gap Breaks Wedge Resistance
by Arthur Hill,
Chief Technical Strategist, TrendInvestorPro.com
Gap is making some waves with an island reversal in early November and wedge breakout here in early December. Also notice that the SCTR surged above 40 and is on the verge of breaking into the upper half of its range. Click here for the current SCTRs for the S&...
READ MORE
MEMBERS ONLY
Small-Caps Start to Lead - Dollar Hits Support Zone
by Arthur Hill,
Chief Technical Strategist, TrendInvestorPro.com
Trading was a bit strange last week, but stocks remain in short-term uptrends and still show no signs of sustained selling pressure. First, the trading week was short because of the Thanksgiving holiday and shortened day on Friday. Second, volume levels were low. Third, trading was rather mixed with...
READ MORE
MEMBERS ONLY
The Squeeze Play is On for Qlogic
by Arthur Hill,
Chief Technical Strategist, TrendInvestorPro.com
After a big surge in October, Qlogic (QLGC) moved into a consolidation as volatility contracted. Notice that the Bollinger Bands contracted and the Bandwidth moved to its lowest level of the year. The stock is showing some signs of buying pressure with two white candles over the last five days....
READ MORE
MEMBERS ONLY
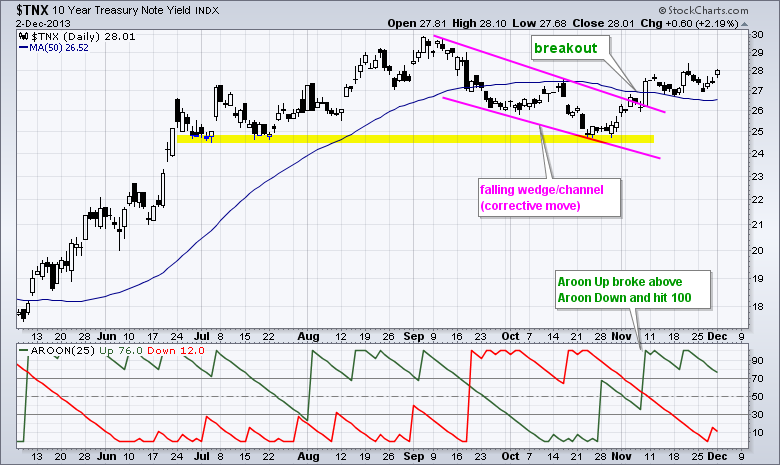
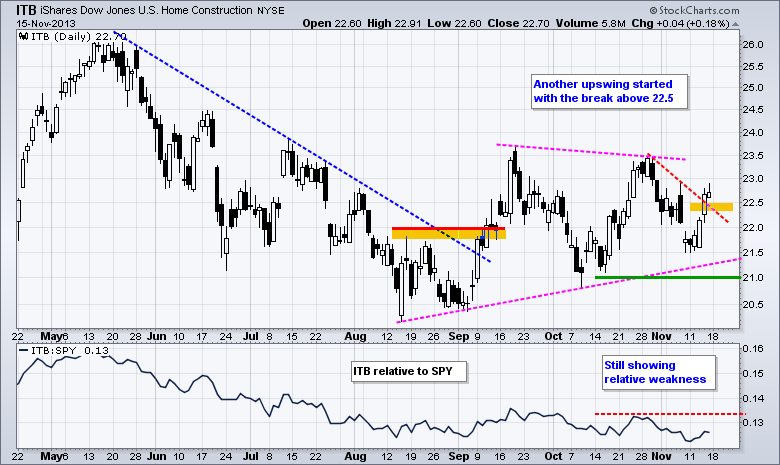
Home Construction SPDR Makes the Aroon Bull Scan
by Arthur Hill,
Chief Technical Strategist, TrendInvestorPro.com
The Home Construction SPDR (ITB) is making a bid to break resistance as Aroon Up surges above Aroon Down. Also notice that Aroon Up hit 100, which suggests that a new uptrend may be emerging. Note, however, that this is the third time in three months that Aroon Up has...
READ MORE
MEMBERS ONLY
Skyworks Solutions Breaks Cup-with-Handle Resistance
by Arthur Hill,
Chief Technical Strategist, TrendInvestorPro.com
The cup-with-handle pattern is a bullish continuation pattern that was popularized by William O'Neil of IBD. The handle marks a small consolidation near resistance and the breakout confirms the pattern. With the cup measuring around three points from low to high, chartists can project a three...
READ MORE
MEMBERS ONLY
Pre-defined Technical Alerts Page Lights Up Green
by Arthur Hill,
Chief Technical Strategist, TrendInvestorPro.com
Stocks opened higher on Monday with several ETFs hitting new highs and new all time highs. Chartists can follow these milestones on the Predefined Technical Alerts page. In addition to several major stock indices, note that XLY, XLV, XLI and XLF recorded new highs on Monday. Also note that oil...
READ MORE
MEMBERS ONLY
IWM Revives and Surges to New High
by Arthur Hill,
Chief Technical Strategist, TrendInvestorPro.com
Programming note: I am taking some holiday this week and Art's Charts will not be updated on Tuesday, Wednesday and Friday. The market is closed on Thursday and will close early on Friday (1PM). Stocks were relatively mixed last week, but some groups led the market and the...
READ MORE
MEMBERS ONLY
Finance Sector Leads with a Fresh 52-week High
by Arthur Hill,
Chief Technical Strategist, TrendInvestorPro.com
Three of the nine sector SPDRs hit new highs this week with the Finance SPDR (XLF) leading the way. The Energy SPDR (XLE) and the Healthcare SPDR (XLV) also recorded new highs. Even though XLF has been underperforming the S&P 500 since summer, this key sector is showing...
READ MORE
MEMBERS ONLY
Retail SPDR Hits Channel Trend Line
by Arthur Hill,
Chief Technical Strategist, TrendInvestorPro.com
The Retail SPDR (XRT) has been one of the strongest industry group ETFs this year with a 25+ percent advance. Even though the ETF is looking overextended as it hits the upper trend line of a rising channel, it is by no means weak. Notice that XRT has traded in...
READ MORE
MEMBERS ONLY
Gentiva Bucks the Selling Pressure with 3-Day Advance
by Arthur Hill,
Chief Technical Strategist, TrendInvestorPro.com
The healthcare sector is one of the strongest sectors in the market, but Gentiva (GTIV) has lagged and failed to keep pace. Even though the stock is in a medium-term downtrend, this decline could be a correction. Notice how the decline formed a falling wedge and retraced 62%. Also...
READ MORE
MEMBERS ONLY
ITB Stalls after Breakout - UUP Breaks Flag Resistance
by Arthur Hill,
Chief Technical Strategist, TrendInvestorPro.com
Programming note: I am on the road Friday and commentary for Art's charts will not be published on Friday. The next commentary will be on Monday. Taper talk allegedly weighed on the market Wednesday, but the declines in the major index ETFs were minimal. The S&P...
READ MORE
MEMBERS ONLY
Charts of Interest: APC, ATML, DHI, EMC, HPQ
by Arthur Hill,
Chief Technical Strategist, TrendInvestorPro.com
APC Forms Flag after High Volume Decline.
ATML Springs a Bear Trap.
Plus DHI, EMC and HPQ
Individual charts are below video.
**This chart analysis is for educational purposes only, and should not
be construed as a recommendation to buy, sell or sell-short said securities**
Sorry but your browser...
READ MORE
MEMBERS ONLY
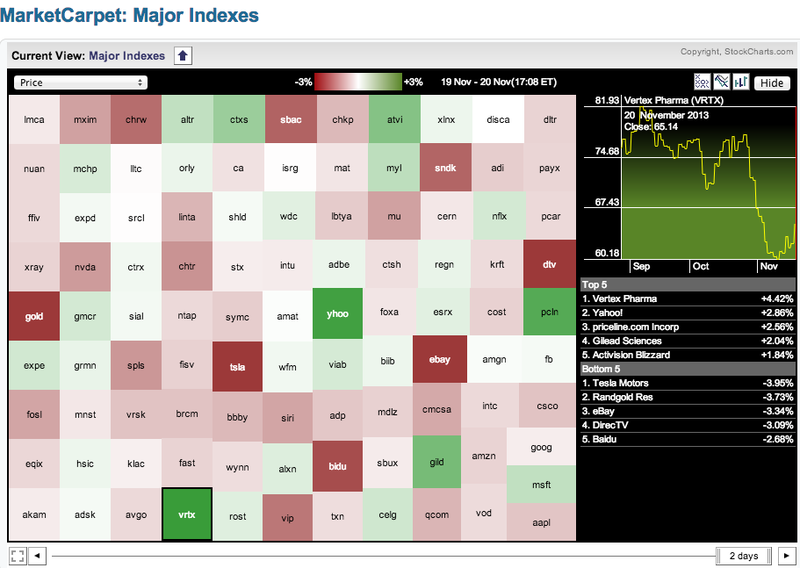
Vertex and Yahoo! Lead Nasdaq 100 MarketCarpet
by Arthur Hill,
Chief Technical Strategist, TrendInvestorPro.com
The Nasdaq 100 MarketCarpet was mixed on Wednesday with several big losers and a handful of strong gainers. The dark green boxes show big gains in Yahoo! (YHOO), Vertex (VRTX), PriceLine (PCLN) and Gilead Science (GILD). These gains were countered with sizable losses in Tesla (TSLA), Randgold (GOLD), Ebay (EBAY)...
READ MORE
MEMBERS ONLY
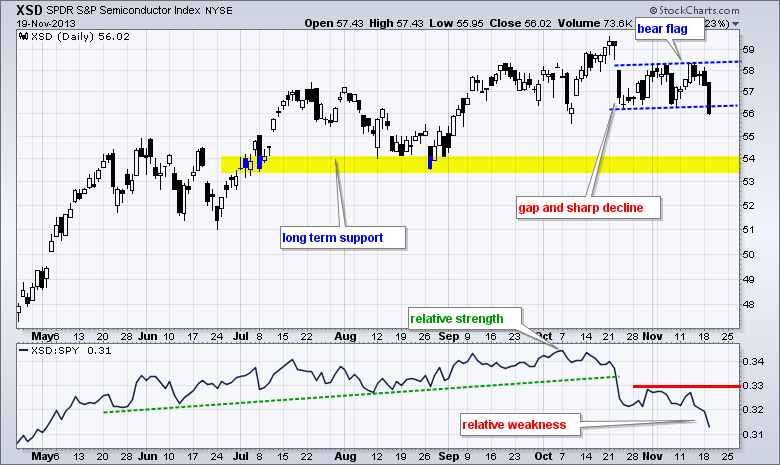
Semis Weigh as XSD Breaks Flag Support
by Arthur Hill,
Chief Technical Strategist, TrendInvestorPro.com
Stocks corrected the last two days with relatively mild selling pressure. The Russell 2000 ETF (IWM) lost .62% and the S&P 500 ETF (SPY) fell just .22%. IWM continues to show relative weakness over the last six weeks. The sectors were mixed with six down and three up....
READ MORE
MEMBERS ONLY
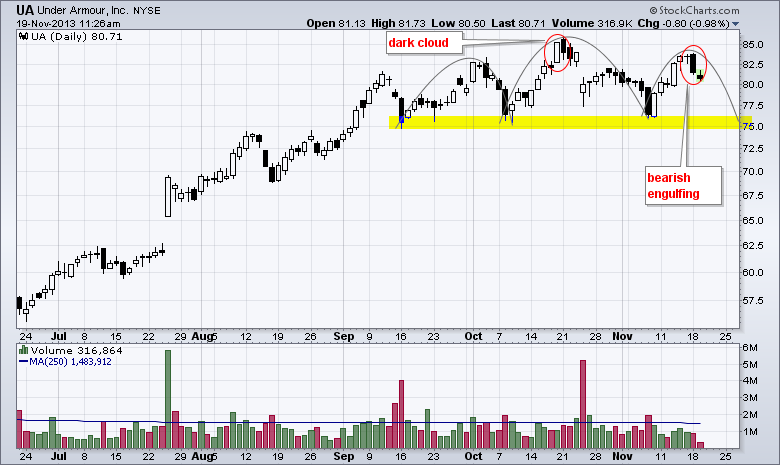
Under Armour Forms Bearish Candlestick Pattern
by Arthur Hill,
Chief Technical Strategist, TrendInvestorPro.com
Under Armour (UA) is currently in a long-term uptrend, but the stock stalled over the last three months with a head-and-shoulders pattern taking shape. The right shoulder is under construction with a bearish engulfing marking the high. The September-November lows mark neckline support in the 75-...
READ MORE
MEMBERS ONLY
QQQ Leads Late Sell Off - KOL Forms Bearish Engulfing
by Arthur Hill,
Chief Technical Strategist, TrendInvestorPro.com
Stocks traded relatively flat the first part of the day and then got hit with selling pressure in the afternoon. Techs led the way down with the Nasdaq 100 ETF (QQQ) losing around 1%. Eight of the nine sectors were down with the Consumer Discretionary SPDR (XLY) and Energy SPDR...
READ MORE
MEMBERS ONLY
Charts: CAT, COF, DOW, FB, MOVE, NVR, PEG, RDC
by Arthur Hill,
Chief Technical Strategist, TrendInvestorPro.com
CAT Extends Post-Gap Consolidation.
COF Shows Relative Weakness as Wedge Forms.
Plus DOW, FB, MOVE, NVR, PEG, RDC
Individual charts are below the video.
Sorry but your browser doesn't support HTML5 video.
Click here for iPad/iPhone Version
**This chart analysis is for educational purposes only, and...
READ MORE
MEMBERS ONLY
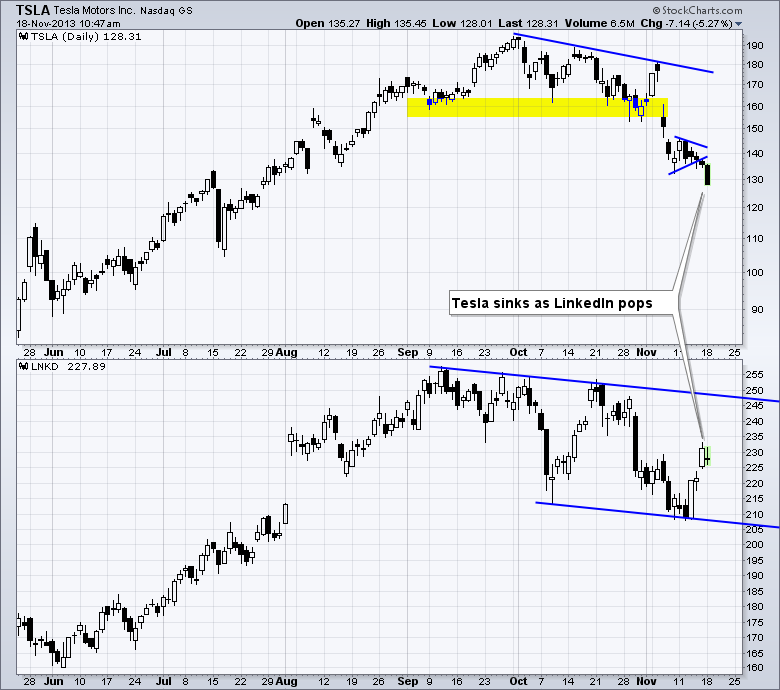
LinkedIn and Tesla Go their Separate Ways
by Arthur Hill,
Chief Technical Strategist, TrendInvestorPro.com
There was a time when LinkedIn (LNKD) and Tesla (TSLA) were joined at the hip and led the momentum crowd. Both stocks surged from January to September and then corrected from early October to mid November. This relationship appears to be changing as Tesla sank to new lows for the...
READ MORE
MEMBERS ONLY
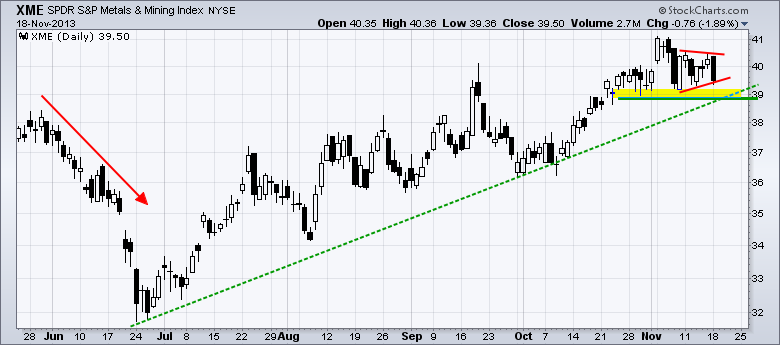
ITB Reverses Downswing and GLD Bounces off October Low
by Arthur Hill,
Chief Technical Strategist, TrendInvestorPro.com
The bulls continue to press their case as the major index ETFs scored modest gains for the week. It is not as if buying pressure is especially strong. Buying pressure, however, is clearly stronger than selling pressure. In fact, selling pressure is pretty much non-existent. The Nasdaq 100 Equal-...
READ MORE
MEMBERS ONLY
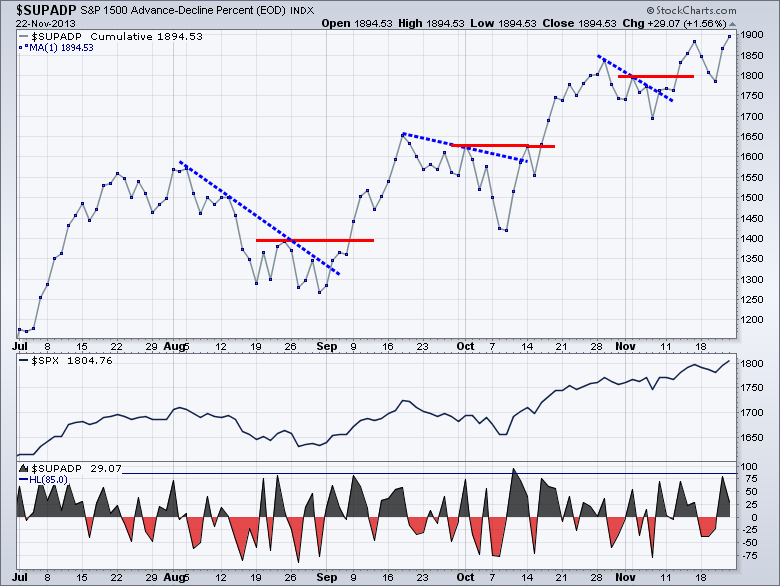
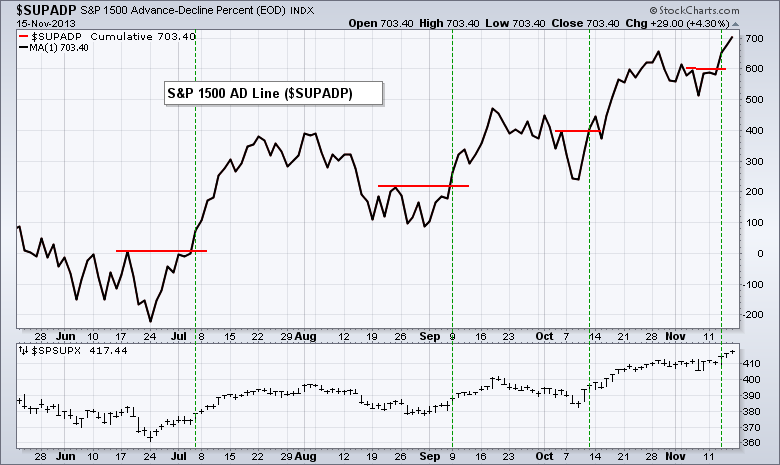
Breadth Indicators Confirm with New Highs
by Arthur Hill,
Chief Technical Strategist, TrendInvestorPro.com
When a major index records a new high, I go straight to the key breadth indicators to see if these highs were confirmed. Breadth indicators are sometimes called "internal" indicators because they measure what is happening inside a specific index or ETF. We can see what is happening...
READ MORE
MEMBERS ONLY
Peabody Breaks P&F Support as Coal Loses Favor
by Arthur Hill,
Chief Technical Strategist, TrendInvestorPro.com
Coal stocks were hit with selling pressure after the TVA announced the closing of eight coal-fired power plants. The 60-minute P&F chart shows BTU breaking Quadruple Bottom support and sporting a downside price objective of 18.65. Note that chartists can change the period settings and...
READ MORE
MEMBERS ONLY
Major Index ETFs and NYSE AD Volume Line Hit New Highs
by Arthur Hill,
Chief Technical Strategist, TrendInvestorPro.com
There is no change in the indicator summary as the bulk of the evidence remains bullish. We saw new highs in SPY, RSP and MDY this week. The NYSE AD Volume Line also hit a new high. Net New Highs surged as buying pressure picked up in November. Volatility remains...
READ MORE
MEMBERS ONLY
SPY and QQQ Hit New Highs, But IWM Drags its Feet
by Arthur Hill,
Chief Technical Strategist, TrendInvestorPro.com
Stocks got a bounce, but there were some pockets of weakness in the market. Get this. The Russell 1000 iShares (IWB) moved higher, but the Russell 2000 ETF (IWM) edged lower. We can blame this on the growth component because the Russell 2000 Value iShares (IWN) was up .22%, but...
READ MORE
MEMBERS ONLY
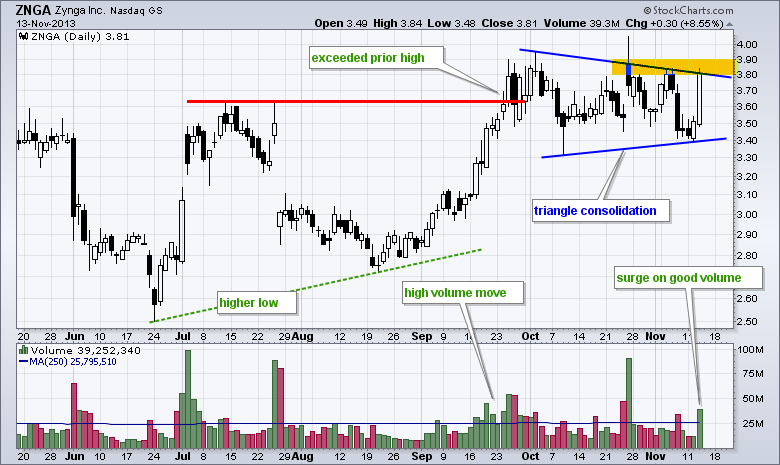
Zynga Forms Bullish Pattern and Zyngs Higher
by Arthur Hill,
Chief Technical Strategist, TrendInvestorPro.com
After a bullish engulfing on Tuesday, Zynga (ZNGA) surged to triangle resistance with high volume on Wednesday. Overall, chartists can make a bullish case for this internet-mobile gaming company. A higher low formed in August and the stock surged above the July high with good volume in September. The...
READ MORE
MEMBERS ONLY
Charts of Interest Video: BAX, BIIB, CNL, MAS, SIAL, TE, WFC
by Arthur Hill,
Chief Technical Strategist, TrendInvestorPro.com
Video for Art's Charts:
BAX Bounces off Support with Good Volume.
BIIB Hits an Interesting Juncture.
Plus CNL, MAS, SIAL, TE, WFC
Sorry but your browser doesn't support HTML5 video.
Click here for iPad/iPhone Version
This commentary and charts-of-interest are designed to stimulate...
READ MORE
MEMBERS ONLY
IWM and QQQ Surge with Double Flag Breakouts
by Arthur Hill,
Chief Technical Strategist, TrendInvestorPro.com
Trading started mixed on Wednesday, but stocks caught a midday bid and raced higher to close strong. The Nasdaq 100 ETF (QQQ) and the Russell 2000 ETF (IWM) led the way. All sectors were up with the Consumer Discretionary SPDR (XLY) leading (+1.58%). Strength in Macy's boosted...
READ MORE
MEMBERS ONLY
Charts of Interest: BAX, BIIB, CNL, MAS, SIAL, TE, WFC
by Arthur Hill,
Chief Technical Strategist, TrendInvestorPro.com
BAX Bounces off Support with Good Volume.
BIIB Hits an Interesting Juncture.
Plus CNL, MAS, SIAL, TE, WFC
Individual charts are below.
Sorry but your browser doesn't support HTML5 video.
Click here for iPad/iPhone Version
**This chart analysis is for educational purposes only, and should not
be...
READ MORE
MEMBERS ONLY
Nasdaq and NYSE Most Actives Go Ten for Ten
by Arthur Hill,
Chief Technical Strategist, TrendInvestorPro.com
It was a big day for stocks as the ten most active stocks on the NYSE and Nasdaq advanced. As the Free Charts page shows, both exchanges went ten for ten. Bank of America (BAC) led the NYSE with a 2+ percent gain. Facebook (FB) led the Nasdaq with a...
READ MORE
MEMBERS ONLY
XLF Falls below Breakout Point - QQQ Hits Moment of Truth
by Arthur Hill,
Chief Technical Strategist, TrendInvestorPro.com
It was another mixed day for the major index ETFs. The Nasdaq 100 ETF (QQQ) edged higher, while the S&P 500 ETF (SPY) edged lower. Six of the nine sector SPDRs finished lower with the Finance SPDR (XLF), Energy SPDR (XLE) and Utilities SPDR (XLU) leading the way....
READ MORE
MEMBERS ONLY
Nikkei Breaks Wedge Resistance as Yen Weakens
by Arthur Hill,
Chief Technical Strategist, TrendInvestorPro.com
The Nikkei 225 ($NIKK) broke above wedge resistance with a surge to 14589 and extended its long-term uptrend. First, note that the long-term trend is up after the big surge from November to May. Second, this triangle represents a consolidation and the breakout signals a continuation of the...
READ MORE