MEMBERS ONLY
Steel ETF Makes a Bid to End Correction
by Arthur Hill,
Chief Technical Strategist, TrendInvestorPro.com
The Steel ETF (SLX) led the market from late October to early May by more than doubling in price. The ETF then fell back with a break of the 50-day SMA in June, but this decline is viewed as a correction within a bigger uptrend. As such, it represents an...
READ MORE
MEMBERS ONLY
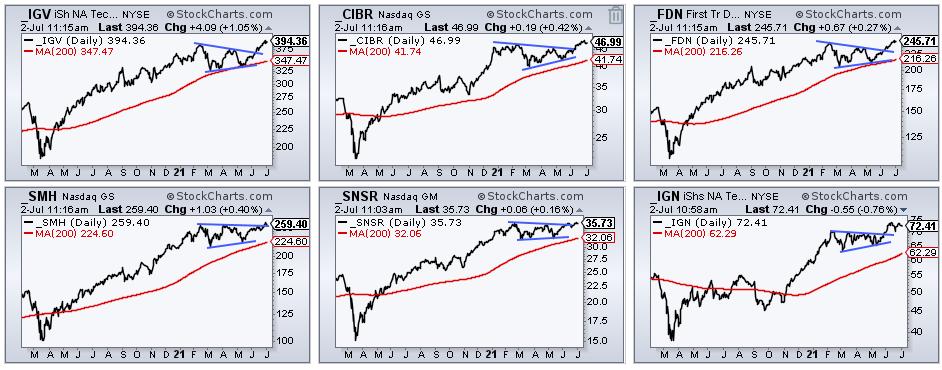
Big Triangle Breakouts in Key Tech ETFs - How to Trade a Pullback
by Arthur Hill,
Chief Technical Strategist, TrendInvestorPro.com
After leading the market into February 2020, tech-related ETFs were hit with strong selling pressure into March and extended their corrections into May. Large triangles formed in several and they broke out of these bullish continuation patterns with strong move the last seven weeks. A triangle within an uptrend represents...
READ MORE
MEMBERS ONLY
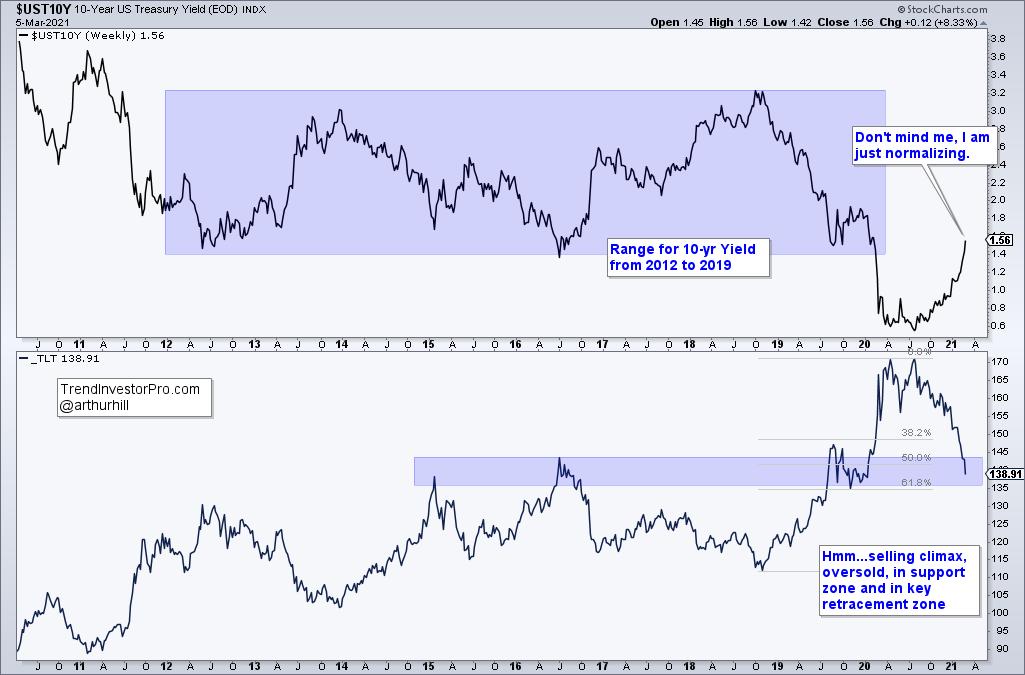
Mind the 10-year Yield Chart, Not the Fed
by Arthur Hill,
Chief Technical Strategist, TrendInvestorPro.com
Traders interested in Treasury bonds, Treasury bond ETFs and yields would be better off ignoring Fed-speak and focusing on the charts. The bond market leads the Fed, not the other way around.
There is a battle raging for the heart and soul of the bond market. In a rare divergence,...
READ MORE
MEMBERS ONLY
Downside Participation Expands - Here's How to Measure and the Key Levels to Watch
by Arthur Hill,
Chief Technical Strategist, TrendInvestorPro.com
SPY experienced its biggest weekly decline (-2.2%) since late February and the nine-week Rate-of-Change turned negative for the first time since late October. The ETF also closed below its 10-day SMA for the first time since late January. Normally, a close or dip below the 10-week SMA signals a...
READ MORE
MEMBERS ONLY
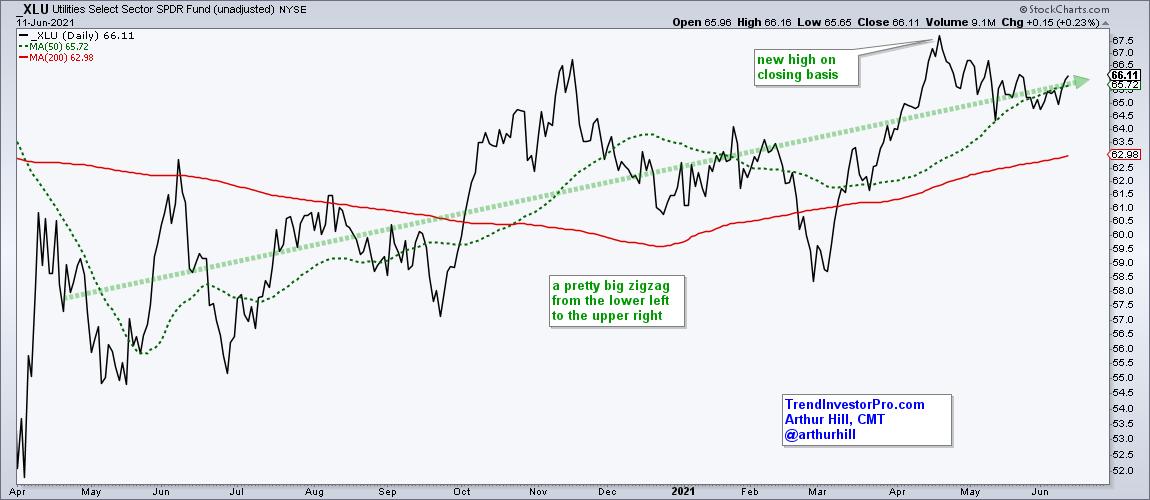
Momentum Turns Up as Utes Form Bullish Pattern
by Arthur Hill,
Chief Technical Strategist, TrendInvestorPro.com
The Utilities SPDR is lagging the broader market over the last eight weeks, but a close look at price action reveals an uptrend, a bullish continuation pattern and an uptick in short-term momentum. Let's investigate.
First and foremost, the long-term trend is up for the Utilities SPDR (XLU)...
READ MORE
MEMBERS ONLY
5G Takes the Lead - Tune into the Trading Room
by Arthur Hill,
Chief Technical Strategist, TrendInvestorPro.com
The 5G Next Generation ETF (FIVG) is taking the lead within the tech space as it breaks out of a bullish continuation pattern. FIVG is leading because it recorded a new high here in early June. Not very many tech-related ETFs hit new highs here in early June and this...
READ MORE
MEMBERS ONLY
CARZ Revs its Engine (while it Still Can)
by Arthur Hill,
Chief Technical Strategist, TrendInvestorPro.com
Some of the old Ford and GM cars can still rev their engines, but the sound of a revving engine could go the way of the dodo with EVs. Perhaps, I should say that the Global Auto ETF (CARZ) price chart is revving its engine and poised for a breakout....
READ MORE
MEMBERS ONLY
Gold, Silver the 200-day and Realistic Expectations
by Arthur Hill,
Chief Technical Strategist, TrendInvestorPro.com
The Gold SPDR (GLD) crossed above its 200-day EMA in early May and its 200-day SMA this past week. Both signals are "bullish" and point to a long-term uptrend, but tell us little regarding realistic expectations going forward. To get a better understanding, we need to know which...
READ MORE
MEMBERS ONLY
The 50-day and the early Gap Tell the Tale for QQQ
by Arthur Hill,
Chief Technical Strategist, TrendInvestorPro.com
Chartists can compare performance by using the 50-day SMA as a benchmark level. Names that exceed their 50-day SMAs show more strength than those that do not exceed their 50-day SMAs. By this yardstick, QQQ is underperforming SPY and weighing on the broader market. Oh, and mind the gap as...
READ MORE
MEMBERS ONLY
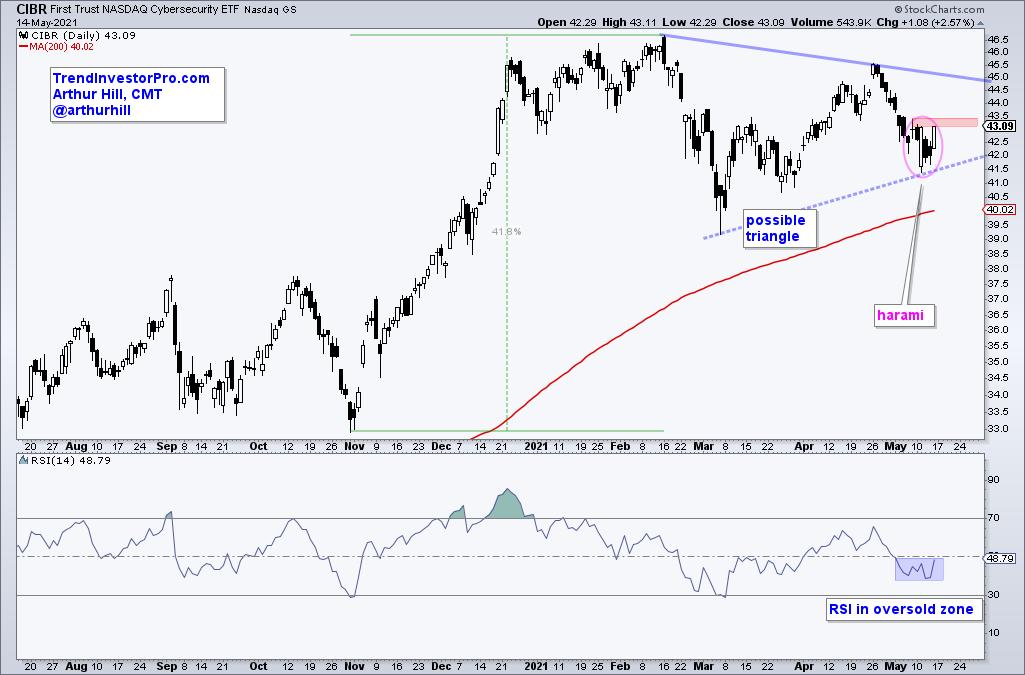
A Tech ETF Forming A Short-term Bullish Pattern within a Bigger Bullish Pattern
by Arthur Hill,
Chief Technical Strategist, TrendInvestorPro.com
The Cybersecurity ETF (CIBR) was hit with the rest of the tech sector over the last few weeks, but it held the March lows and is on my radar as a possible triangle forms over the last few months. In particular, I am watching the downswing within this triangle for...
READ MORE
MEMBERS ONLY
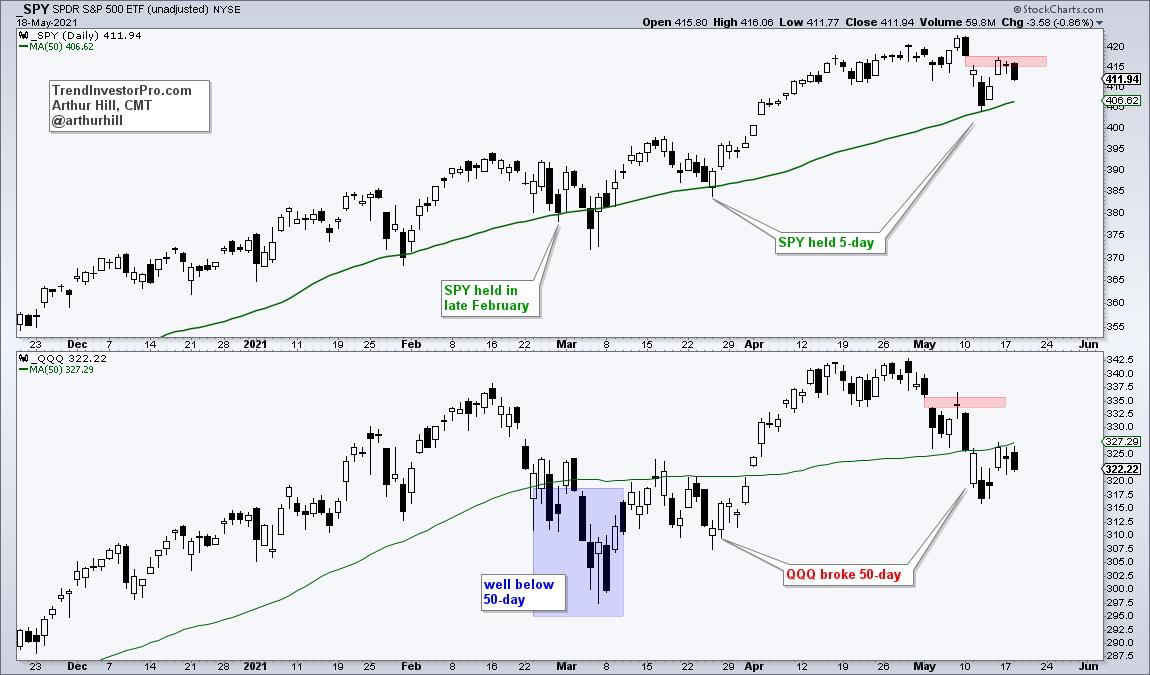
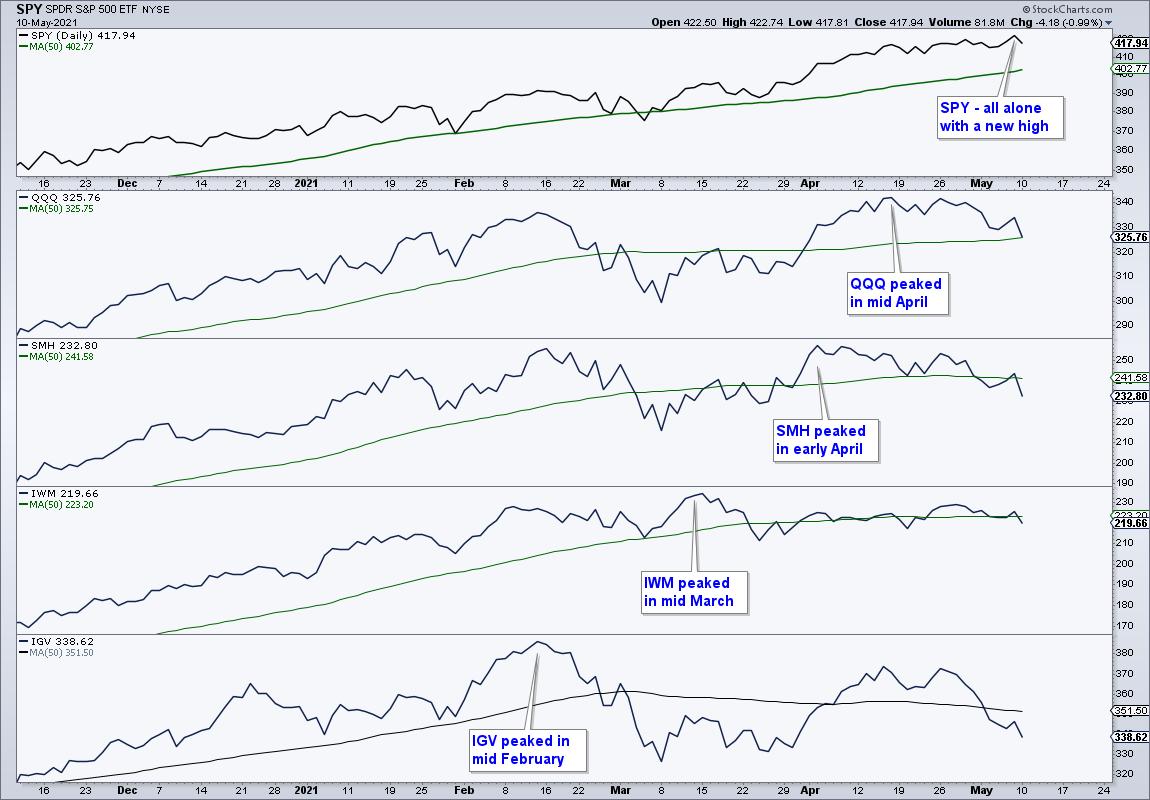
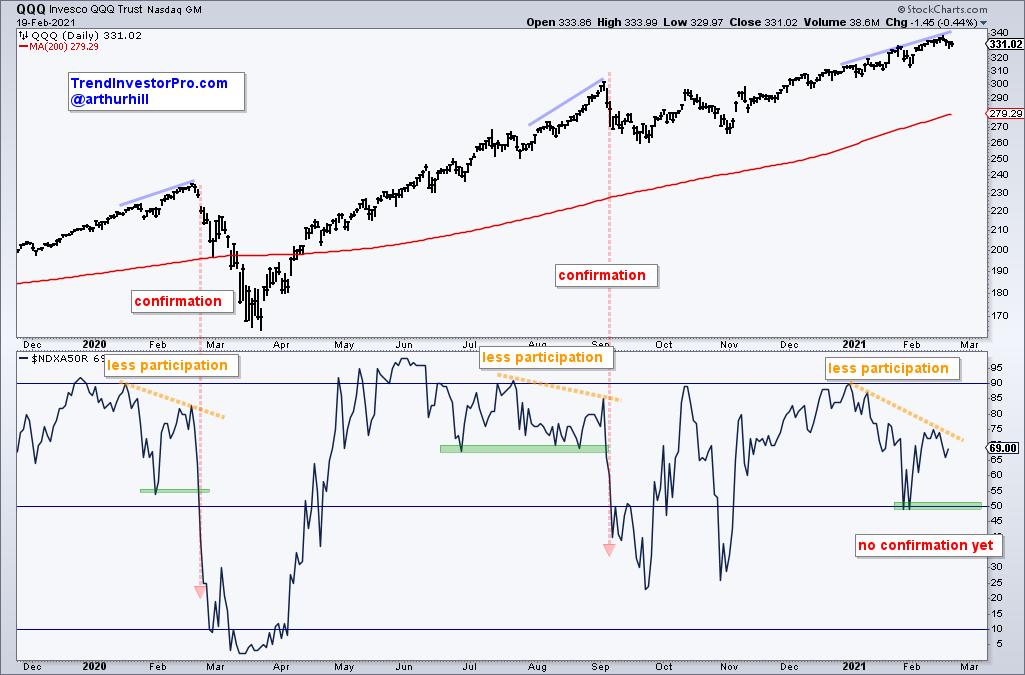
Non-confirmations show Creeping Correction that Could Expand
by Arthur Hill,
Chief Technical Strategist, TrendInvestorPro.com
The S&P 500 SPDR hit a new high last week, but it was alone at the top because several other major index ETFs did not confirm. In fact, these non-confirmations have been building since March as fewer groups participated. Of note, several tech-related ETFs peaked in mid February,...
READ MORE
MEMBERS ONLY
KRE Breakout Holds and Bodes well for Small-caps
by Arthur Hill,
Chief Technical Strategist, TrendInvestorPro.com
The Regional Bank ETF pattern over the last few months is similar to that of the S&P SmallCap 600 SPDR and Russell 2000 ETF. This is not surprising because the financial services sector accounts for 17.8% of IJR and 16.34% of IWM, and is the second...
READ MORE
MEMBERS ONLY
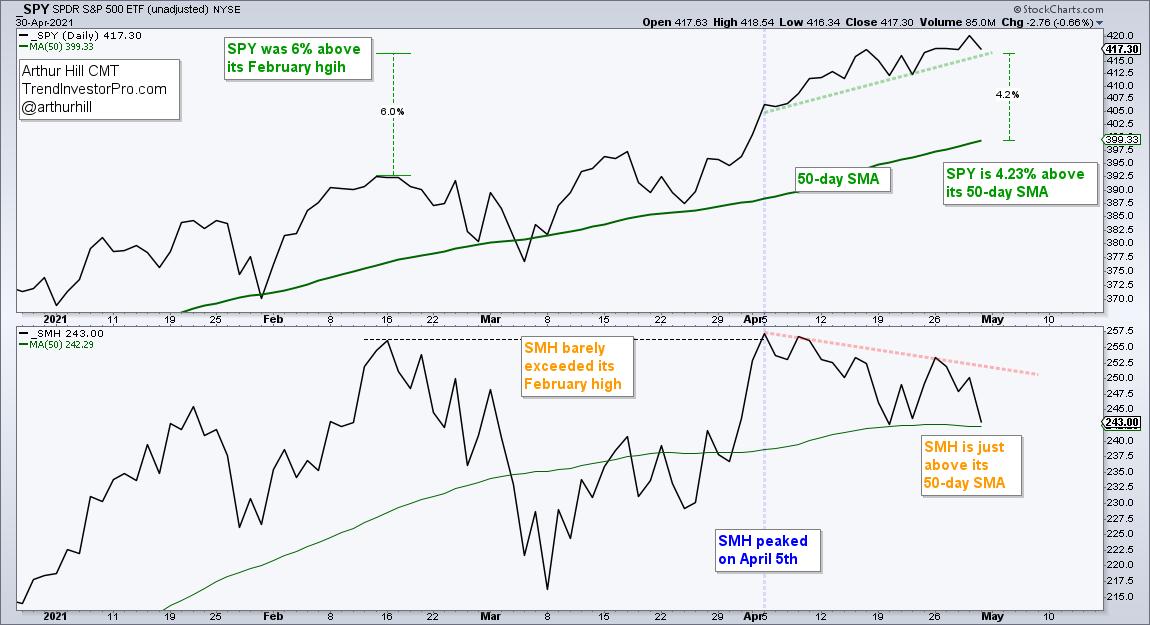
Semis Lose Their Shine
by Arthur Hill,
Chief Technical Strategist, TrendInvestorPro.com
The long-term trend for the Semiconductor ETF (SMH) remains up, but the ETF is coming under some selling pressure and underperforming the broader market. While this is not enough reason to turn long-term bearish, it does increase the odds of corrective period in the coming weeks.
First, let's...
READ MORE
MEMBERS ONLY
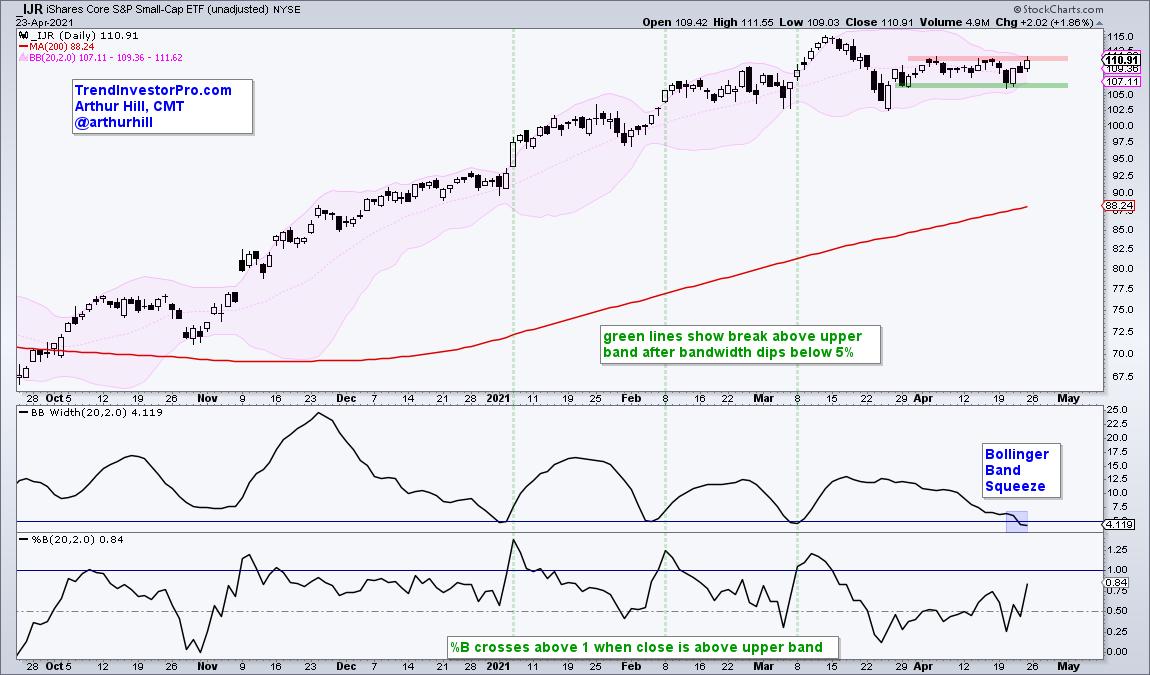
Small-caps Keep Everyone Guessing - Here's Mine
by Arthur Hill,
Chief Technical Strategist, TrendInvestorPro.com
The S&P SmallCap 600 SPDR (IJR) and Russell 2000 ETF (IWM) are lagging the market, but they are still in uptrends and the noose is tightening. Today we will look at the volatility contraction in IJR and the loss of trend in IWM, and then show what to...
READ MORE
MEMBERS ONLY
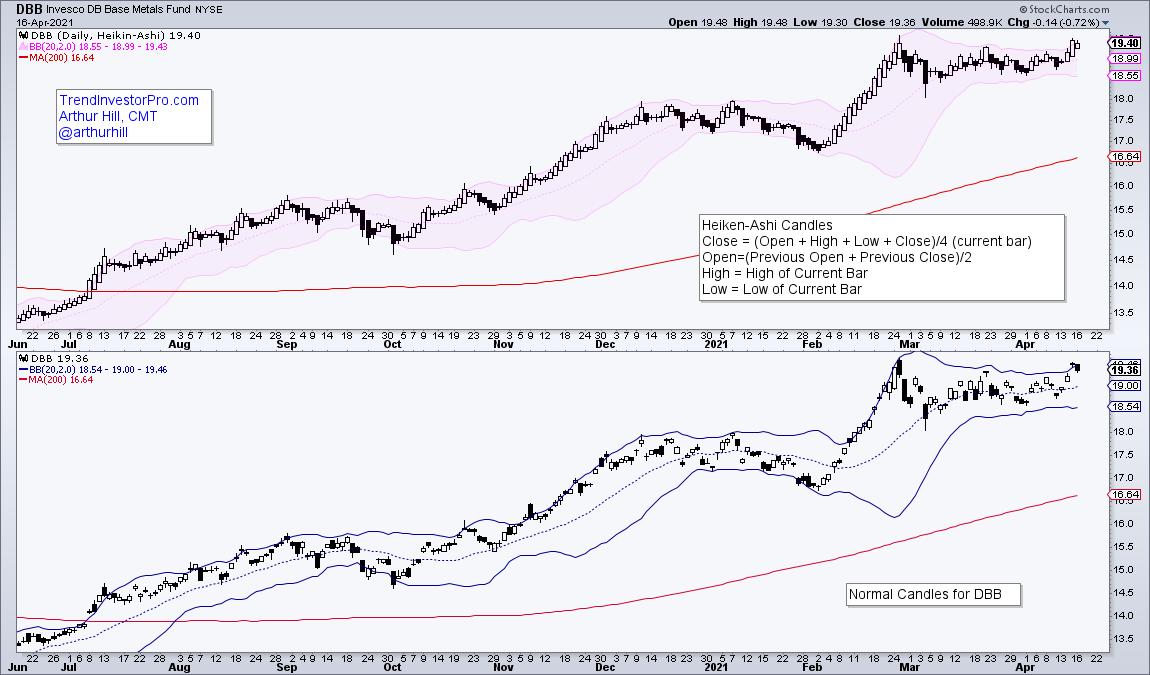
Base Metals ETF Gets the Squeeze
by Arthur Hill,
Chief Technical Strategist, TrendInvestorPro.com
The DB Base Metals ETF (DBB) is breaking out of a bullish continuation pattern after a Bollinger Band squeeze and this signals a continuation of the long-term uptrend.
The first chart shows the DB Base Metals ETF (DBB) with Heikin-Ashi candlesticks in the top window and normal candlesticks in the...
READ MORE
MEMBERS ONLY
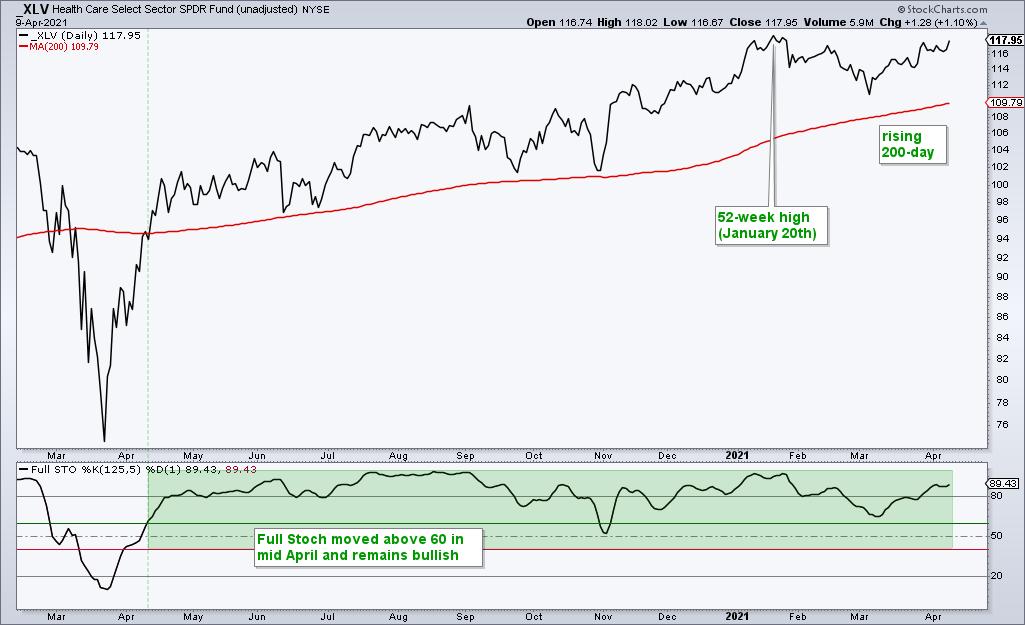
Healthcare SPDR Looks Poised to Extend Uptrend
by Arthur Hill,
Chief Technical Strategist, TrendInvestorPro.com
The Healthcare SPDR (XLV) formed two bullish continuation patterns within its long-term uptrend and recent breakouts bode well for further gains.
First and foremost, the long-term trend is up for XLV. The ETF is above its rising 200-day SMA and within 1% of its January high, which was a 52-week...
READ MORE
MEMBERS ONLY
A Relative Strength Clue for QQQ
by Arthur Hill,
Chief Technical Strategist, TrendInvestorPro.com
The Nasdaq 100 ETF (QQQ) represents the largest stocks in the Nasdaq and the Nasdaq 100 Next Gen ETF (QQQJ) covers the next 100 (101 to 200). Stocks at the top of the latter group are knocking on the door and trying to fatten up for inclusion into the legendary...
READ MORE
MEMBERS ONLY
News Flash! Big Advances Deserve Big Corrections and Proper Perspective - Tesla Example
by Arthur Hill,
Chief Technical Strategist, TrendInvestorPro.com
Dozens of high flying stocks and ETFs are down double digits from their February highs, but chartists should put these declines into perspective when analyzing the charts. The ARK Innovation ETF (ARKK), the Clean Energy ETF (PBW) and the Solar Energy ETF (TAN) declined over 30% from their February highs...
READ MORE
MEMBERS ONLY
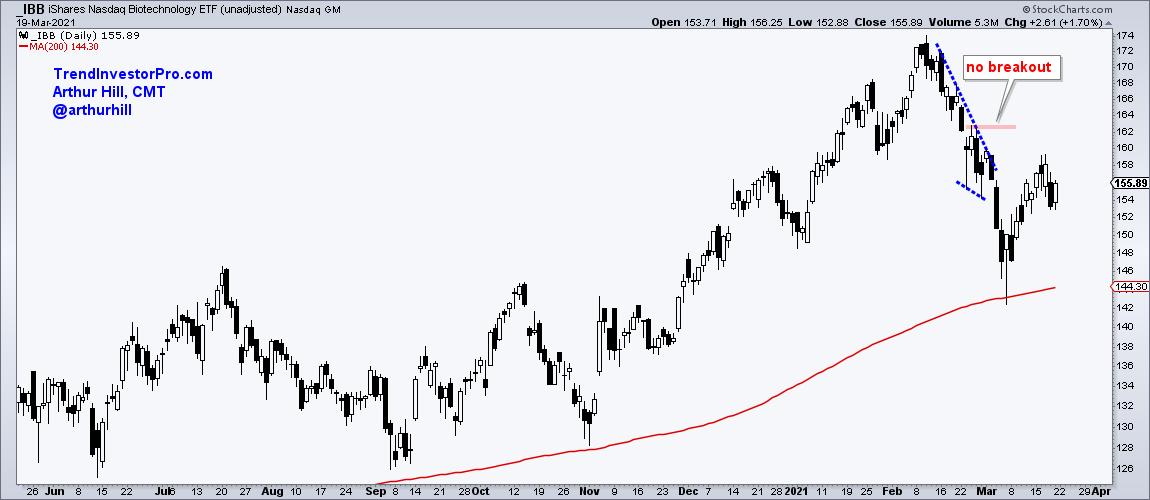
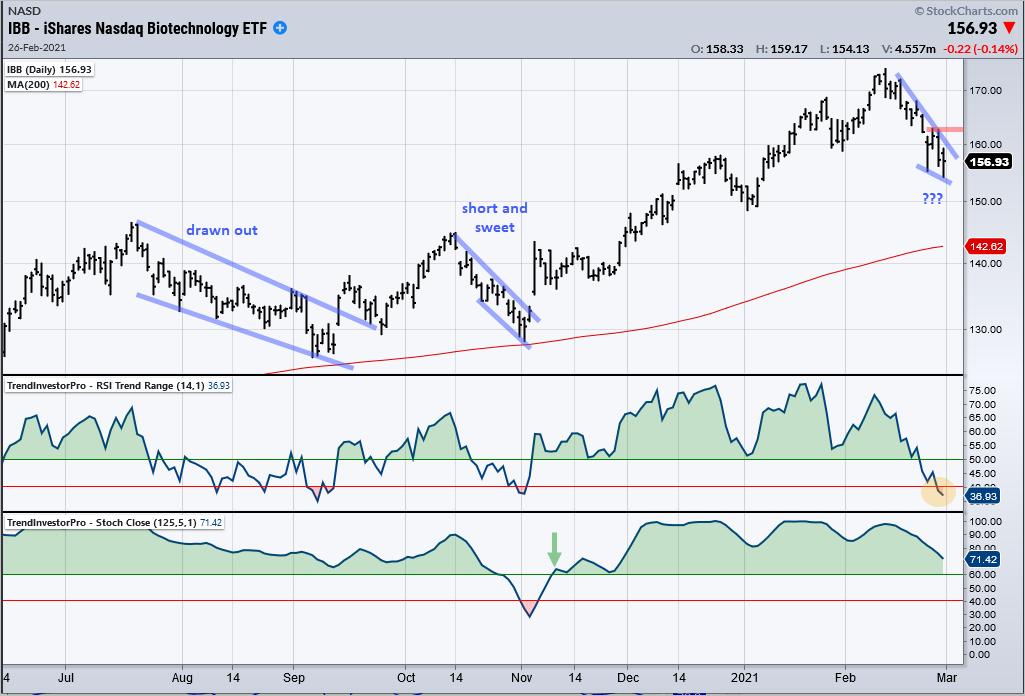
IBB: Still a Correction within a Bigger Uptrend
by Arthur Hill,
Chief Technical Strategist, TrendInvestorPro.com
I wrote about the Biotech ETF (IBB) on February 28th as it pulled back from a new high. The pullback was viewed as a correction within the bigger uptrend, but the correction extended further than expected. At the time, I drew a falling wedge on the chart and marked resistance...
READ MORE
MEMBERS ONLY
Applying Multiple Timeframe Analysis to the Healthcare SPDR
by Arthur Hill,
Chief Technical Strategist, TrendInvestorPro.com
As its name suggests, multiple timeframe analysis looks at two or more timeframes to find a setup. Typically, the longer timeframe is used to define the long-term trend and set the trading bias. The shorter timeframe is then used to find setups in harmony with the bigger trend. Nothing is...
READ MORE
MEMBERS ONLY
Does the 10-Year Yield Really Matter?
by Arthur Hill,
Chief Technical Strategist, TrendInvestorPro.com
Two items are dominating the news narrative right now: the rise in interest rates and the decline in tech stocks. Are rising rates really an issue for tech stocks? The charts suggest that the evidence is mixed, at best. In fact, it is not very hard to find periods when...
READ MORE
MEMBERS ONLY
Secondary Downtrends in Primary Uptrends Create Opportunities
by Arthur Hill,
Chief Technical Strategist, TrendInvestorPro.com
With a pullback led by QQQ and the high flyers, several ETFs have become short-term oversold in a longer term uptrend. In Dow Theory terms, the primary trend for these ETFs is up and the secondary trend is down. A secondary downtrend within a primary uptrend is considered a correction...
READ MORE
MEMBERS ONLY
A Medium-term Breadth Indicator Waves the Caution Flag
by Arthur Hill,
Chief Technical Strategist, TrendInvestorPro.com
The Nasdaq 100 has been on a tear the last few months with a move to new highs, but a medium-term breadth indicator is not keeping pace here in February. This indicator is simply flashing the yellow caution sign right now and we have yet to see an actual signal...
READ MORE
MEMBERS ONLY
An Industrials ETF with More Juice than XLI
by Arthur Hill,
Chief Technical Strategist, TrendInvestorPro.com
Not all ETFs are created equal and the name does not always tell the entire story. One would think that the Industrials SPDR (XLI) and the Industrials iShares (IYJ) are similar in makeup and performance. This is not the case because one has a clear edge over the other.
The...
READ MORE
MEMBERS ONLY
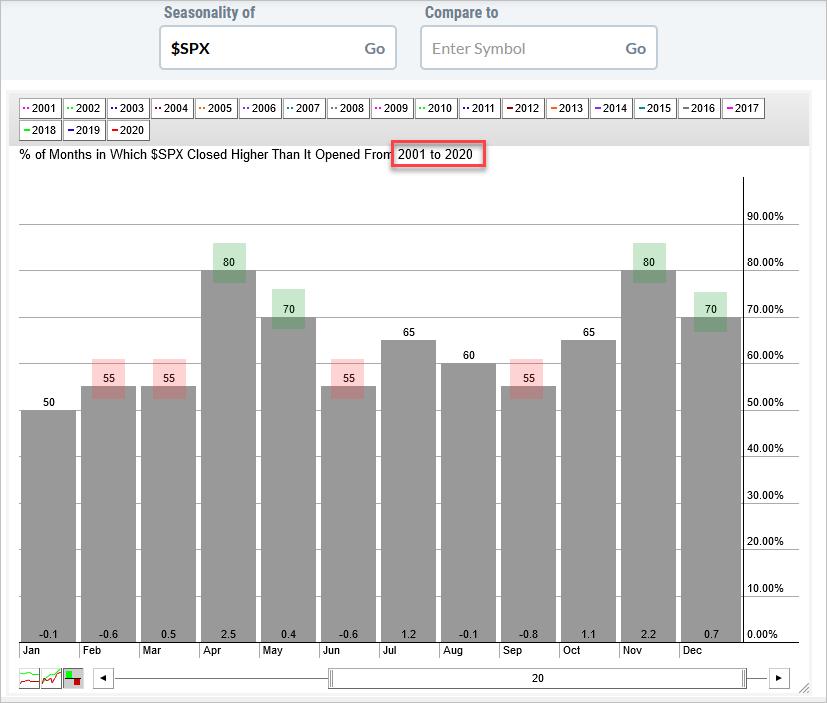
Seasonality Looks Weak, but Price Action is Strong
by Arthur Hill,
Chief Technical Strategist, TrendInvestorPro.com
The seasonal patterns over the next two months are not very strong, but price action is strong with the S&P 500 hitting a new high. Price action is more important than the seasonal pattern because profits and losses are driven by price changes, not seasonal tendencies. Seasonality becomes...
READ MORE
MEMBERS ONLY
SOXX Follows Overbought Extreme with Outsized Decline
by Arthur Hill,
Chief Technical Strategist, TrendInvestorPro.com
Last weekend's post showed the Semiconductor ETF (SOXX) with a 10 day overbought streak and several ETFs with even bigger overbought streaks. These streaks came to an end this week as SOXX fell 6.21%, its biggest weekly decline since mid March. As measured by Normalized ROC, this...
READ MORE
MEMBERS ONLY
SOXX and other ETFs with Extended Overbought Conditions
by Arthur Hill,
Chief Technical Strategist, TrendInvestorPro.com
The Semiconductor ETF (SOXX) and several other ETFs are on a serious roll in 2021. For the fourth time since 2009, 14-day RSI was above 70 for ten or more days. This is an exceptional streak, but SOXX is not alone and there are even longer streaks. The following list...
READ MORE
MEMBERS ONLY
A Top or a Mere Correction?
by Arthur Hill,
Chief Technical Strategist, TrendInvestorPro.com
Visual chart analysis is prone to subjectivity and biases. While we cannot completely remove subjectivity, we can approach chart analysis in a systematic fashion and increase objectivity. This commentary will show an example using the Home Construction ETF (ITB) because the ETF has traded flat since mid October. Is this...
READ MORE
MEMBERS ONLY
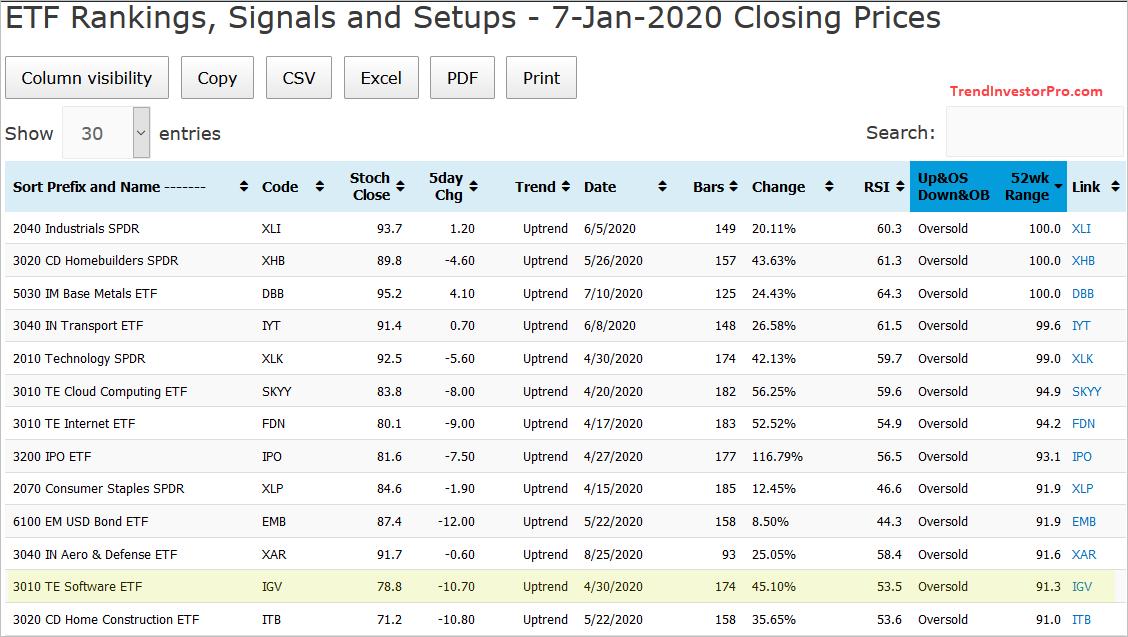
Tracking Trend Signals and Mean-Reversion Setups
by Arthur Hill,
Chief Technical Strategist, TrendInvestorPro.com
Tech-related ETFs are lagging over the last few weeks, but they are still in uptrends overall. This means bullish setups still matter so today we will look at a classic mean-reversion setup in the Software ETF (IGV).
The IGV setup came to light through the ETF Ranking, Trends and Setups...
READ MORE
MEMBERS ONLY
More Forest and Fewer Trees in 2021
by Arthur Hill,
Chief Technical Strategist, TrendInvestorPro.com
Way back in early September, a time long long ago, tech-related ETFs were leading the market and recording new highs. The Software ETF (IGV), Cloud Computing ETF (SKYY), Cyber Security ETF (HACK), Internet ETF (FDN) and Semiconductor ETF (SOXX), among others, were up 75 plus percent from late March to...
READ MORE
MEMBERS ONLY
Squeezing the Apple for a Breakout
by Arthur Hill,
Chief Technical Strategist, TrendInvestorPro.com
Several big tech stocks have consolidation patterns working the last few months and Bollinger Band squeezes in December. These include Apple, Amazon, Microsoft and Nvidia. Today's article will focus on the strongest of the four, and the one with a breakout working already. There is a video at...
READ MORE
MEMBERS ONLY
Performance Divergences that Make You Go Hmm...
by Arthur Hill,
Chief Technical Strategist, TrendInvestorPro.com
There was a serious shift over the last five weeks as commodities surged, bonds fell and the Dollar recorded new lows. There were also some noticeable divergences as the Inflation-Indexed Bond ETF (TIP) edged higher and the 20+ Yr Treasury Bond ETF (TLT) moved lower. This divergence is only five...
READ MORE
MEMBERS ONLY
Cyber Monday Special and Consumer Discretionary Breadth Hits an Extreme
by Arthur Hill,
Chief Technical Strategist, TrendInvestorPro.com
The Consumer Discretionary SPDR (XLY) is leading the charge with the most stocks trading above their 200-day EMAs. The table below shows the percentage of stocks above their 200-day EMAs for three indexes and the eleven sectors. This indicator is above 98% for XLY and above 90% for four other...
READ MORE
MEMBERS ONLY
Bullish Setups in Two Boring Tech ETFs
by Arthur Hill,
Chief Technical Strategist, TrendInvestorPro.com
Boring and lagging ETFs turned into exciting leaders in November as we saw breakouts in the Regional Bank ETF (KRE) and REIT ETF (IYR). The breakouts are bullish and IYR has a short-term bullish continuation pattern working, but we should not forget about the prior leaders and ETFs with real...
READ MORE
MEMBERS ONLY
The Calm before the Storm in QQQ
by Arthur Hill,
Chief Technical Strategist, TrendInvestorPro.com
The weekly high-low range for the Nasdaq 100 ETF (QQQ) was the narrowest of the year this past week and the ETF is battling triangle resistance. A narrowing range shows indecision and a volatility contraction. Even though this is just one weekly bar, QQQ is at a moment of truth....
READ MORE
MEMBERS ONLY
Two Biotech ETFs: One Stands Out as the other Forges a Big Continuation Pattern
by Arthur Hill,
Chief Technical Strategist, TrendInvestorPro.com
Even though the Biotech ETF (IBB) and the Biotech SPDR (XBI) represent the same industry group, their composition is very different and one is clearly outperforming the other. Nevertheless, the laggard still has a big bullish continuation pattern and this group looks bullish as a whole.
First, let's...
READ MORE
MEMBERS ONLY
Two ETFs with Market Leading Charts and Fast Growing Industries
by Arthur Hill,
Chief Technical Strategist, TrendInvestorPro.com
New highs and a fast growing industry group make for a powerful combination. Today's article and video (below) will focus on two ETFs that capture two fast growing industries, video gaming and esports. We will show why these two ETFs are leading, why a consolidation within an uptrend...
READ MORE
MEMBERS ONLY
Broad Selling Pressure, but Not Enough to Tip the Scales
by Arthur Hill,
Chief Technical Strategist, TrendInvestorPro.com
Breadth indicators, such as Advance-Decline Percent, measure the participation behind a move in the underlying index. Sometimes participation is so strong that it tips the scales and signals the start of an extended move. For example, 10-day EMA of SPX AD% triggered a bearish breadth thrust on February 25th and...
READ MORE
MEMBERS ONLY
Two of the Four Commodity Groups Stand Out
by Arthur Hill,
Chief Technical Strategist, TrendInvestorPro.com
Broad commodity ETFs are like broad index ETFs: an amalgamation of various components. Traders can improve performance by breaking these down, ignoring the weaker components and focusing on the stronger components. Let's do that with the Invesco DB Commodity ETF.
The Commodity ETF (DBC) can be broken down...
READ MORE
MEMBERS ONLY
Small-Caps Take the Lead: Can They Hold It?
by Arthur Hill,
Chief Technical Strategist, TrendInvestorPro.com
The Russell 2000 ETF (IWM) rose from the ashes in late September and surged above its summer highs with a double-digit advance. This is quite amazing considering that IWM closed below its 200-day SMA on 24-Sept and was seriously lagging less than a month ago. IWM is leading over the...
READ MORE