MEMBERS ONLY
Gold Benefits from Weakness in Stocks and Bonds
by Arthur Hill,
Chief Technical Strategist, TrendInvestorPro.com
Selling pressure hit the stock market for the second week running as the major index ETFs lost ground. The Russell 2000 ETF (IWM) fell 2.27% last week, while the Nasdaq 100 ETF (QQQ) lost just 1.31%. Even though these are small losses in the grand scheme of things,...
READ MORE
MEMBERS ONLY
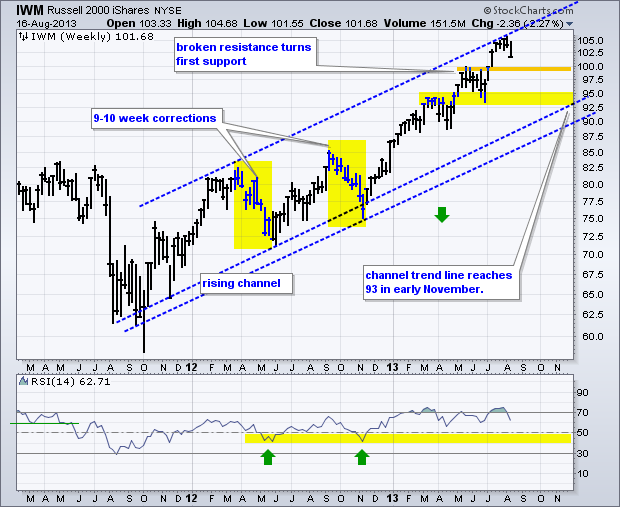
Russell 2000 ETF Starts Correction within Bigger Uptrend
by Arthur Hill,
Chief Technical Strategist, TrendInvestorPro.com
The Russell 2000 ETF (IWM) moved sharply lower this week to start a short-term downtrend, but this is still considered just correction within a bigger uptrend. There are simply no signs of a major top at this moment. Tops often form with major reversal patterns or consolidation, a bearish...
READ MORE
MEMBERS ONLY
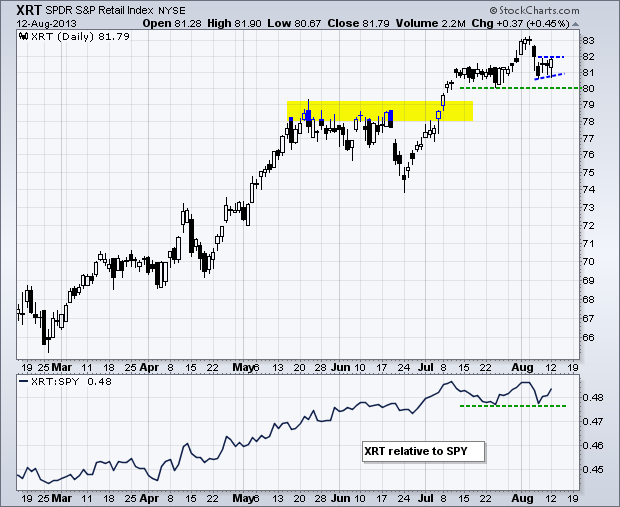
Market Carpet Shows Retailers Lagging and Homebuilders Leading
by Arthur Hill,
Chief Technical Strategist, TrendInvestorPro.com
The image below shows the Market Carpet for just the consumer discretionary sector (cyclicals). Notice that Pulte (PHM) and Lennar (LEN) are leading on Friday, while Nordstrom (JWN) and Kohl's (KSS) are lagging. Chartists can double click on any symbol in the market carpet to expand that section...
READ MORE
MEMBERS ONLY
Net New Highs Turn Negative on Naz and NYSE
by Arthur Hill,
Chief Technical Strategist, TrendInvestorPro.com
Stocks were hit with broad selling pressure over the past week, but this is not enough to affect the overall uptrends. As we saw in November and June, corrections are normal in uptrends. The challenge, as always, is distinguishing between a normal correction and the start of something more (extended...
READ MORE
MEMBERS ONLY
Selling Pressure Increases as Breadth Indicators Break Down
by Arthur Hill,
Chief Technical Strategist, TrendInvestorPro.com
Selling pressure certainly intensified on Thursday with an across the board decline. The high-beta Russell 2000 ETF (IWM) led the major index ETFs lower with a 1.82 percent decline. All sectors were down with the Consumer Discretionary SPDR (XLY) leading the way. It is negative to see this...
READ MORE
MEMBERS ONLY
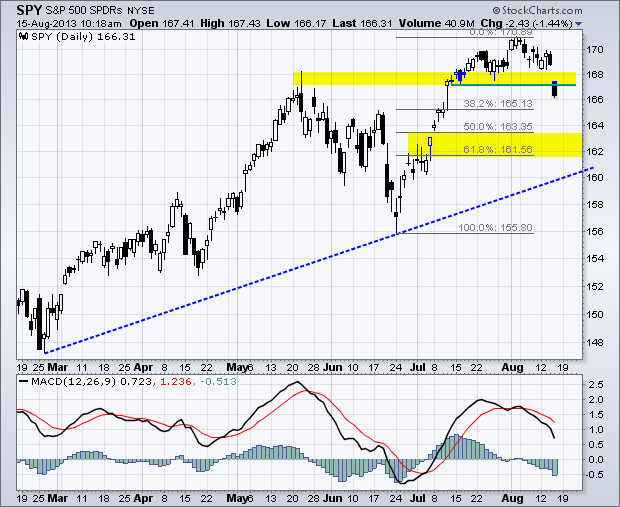
SPY Breaks Support with Gap Down
by Arthur Hill,
Chief Technical Strategist, TrendInvestorPro.com
After weeks of indecision, the S&P 500 ETF (SPY) made a decisive move with break below the late July low. The gap and support break are short-term bearish as long as they hold. Using the Fibonacci Retracements Tools, chartists can estimate next support in the 50-62%...
READ MORE
MEMBERS ONLY
Buyers Pull Back as SPY and IWM Consolidate Near Support
by Arthur Hill,
Chief Technical Strategist, TrendInvestorPro.com
Stocks opened weak and remained weak, but selling pressure was not that intense as the major index ETFs closed modestly lower. The Dow SPDR (DIA) and S&P Midcap SPDR (MDY) led the way by falling around .75 percent. All sectors were lower with the Consumer Discretionary SPDR (XLY)...
READ MORE
MEMBERS ONLY
Charts of Interest: ACN, AMD, DGX, KMB, TXT
by Arthur Hill,
Chief Technical Strategist, TrendInvestorPro.com
ACN Breaks Triangle Support with High Volume.
AMD Bounces off Support with Good Volume.
Plus DGX, KMB, TXT
Video at end of commentary
**This chart analysis is for educational purposes only, and should not
be construed as a recommendation to buy, sell or sell-short said securities**
Click here for...
READ MORE
MEMBERS ONLY
Home Construction iShares Breaks Neckline Support
by Arthur Hill,
Chief Technical Strategist, TrendInvestorPro.com
Rising rates are taking their toll on the Home Construction iShares (ITB) as the ETF broke neckline support on Wednesday. The head-and-shoulders pattern extends almost the entire year and today's breakdown confirms the bearish reversal. The indicator window shows the price relative (ITB:SPY ratio) moving...
READ MORE
MEMBERS ONLY
ITB Tests Neckline Support - No Follow Through for GLD
by Arthur Hill,
Chief Technical Strategist, TrendInvestorPro.com
Stocks meandered on Tuesday with the major index ETFs finishing mixed on the day. The Nasdaq 100 ETF (QQQ) advanced .56% on the heels of Apple, while the Russell 2000 ETF (IWM) fell .13% on the day. Treasuries were the big movers as a positive retail sales report prompted another...
READ MORE
MEMBERS ONLY
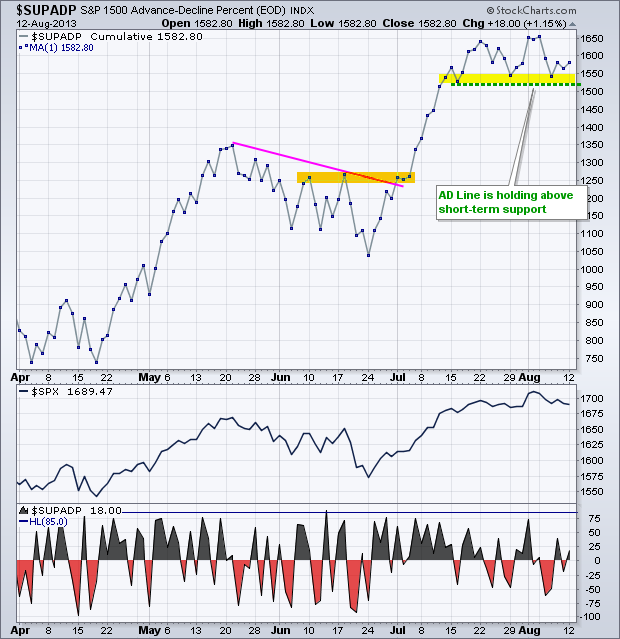
S&P 1500 AD Line Holds Short-term Support
by Arthur Hill,
Chief Technical Strategist, TrendInvestorPro.com
The S&P 1500 AD Line ($SUPADP), which is a key breadth indicator, has yet to break support and remains in bull mode. Notice how the AD Line established lows from mid July to early August. These lows mark a support zone that chartists should watch for clues on...
READ MORE
MEMBERS ONLY
SPY Bounces off Support - USO Bounces within Flag
by Arthur Hill,
Chief Technical Strategist, TrendInvestorPro.com
Stocks opened weak on Monday, but quickly recovered and edged into positive territory. The overall gains were rather paltry with the Nasdaq 100 ETF (QQQ) gaining .24% and the Russell 2000 ETF (IWM) advancing .53%. The sectors were mixed with small gains and losses. The Technology SPDR (XLK) stood out...
READ MORE
MEMBERS ONLY
Charts of Interest: CY, DE, FST, INTC, MXIM, SWKS
by Arthur Hill,
Chief Technical Strategist, TrendInvestorPro.com
CY Consolidates after Big Surge.
DE Bounces off Support with Good Volume.
Plus FST, INTC, MXIM, SWKS
Video at end of commentary
**This chart analysis is for educational purposes only, and should not
be construed as a recommendation to buy, sell or sell-short said securities**
Click here for iPad/...
READ MORE
MEMBERS ONLY
US Oil Fund Forms Bull Flag in Uptrend
by Arthur Hill,
Chief Technical Strategist, TrendInvestorPro.com
After surging and breaking resistance in July, the US Oil Fund (USO) pulled back with a falling flag the last few weeks. USO made its first move with a surge over the last two days. A follow through breakout above flag resistance would signal a continuation higher. Chartists can also...
READ MORE
MEMBERS ONLY
AD Volume Line Breaks Support - GLD Challenges Resistance
by Arthur Hill,
Chief Technical Strategist, TrendInvestorPro.com
The Shanghai Composite ($SSEC) and the Hang Seng Index ($HSI) surged over 2% on Monday, but the Nikkei 225 ($NIKK) fell and US stock futures are trading lower. Chinese shares are up because there were some positive economic reports late last week. Gold is also up and going for a...
READ MORE
MEMBERS ONLY
Finance Sector Starts Underperforming
by Arthur Hill,
Chief Technical Strategist, TrendInvestorPro.com
The Finance SPDR (XLF) was one of the best performing sectors from April to late July, but was the weakest sector over the last two weeks. The PerfChart below shows XLF with a loss over the last ten trading days. In contrast, notice that the S&P 500, Consumer...
READ MORE
MEMBERS ONLY
NYSE Lags Nasdaq, but Technicals Remain Bullish
by Arthur Hill,
Chief Technical Strategist, TrendInvestorPro.com
Stocks stalled over the last two weeks, but this was not enough to derail any indicators or the overall uptrend in the major index ETFs. Note that the major index ETFs hit new highs over the last two weeks, while XLK, XLY and XLI hit new highs to lead the...
READ MORE
MEMBERS ONLY
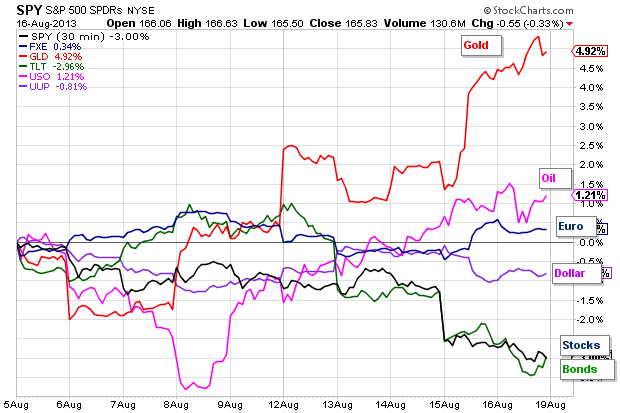
Greenback Extends Downtrend - Gold Surges
by Arthur Hill,
Chief Technical Strategist, TrendInvestorPro.com
Stocks were all over the place on Thursday. The major index ETFs opened higher, quickly pulled back and then moved back into positive territory in the afternoon. The end result was uneventful as the Russell 2000 ETF (IWM) and Nasdaq 100 ETF (QQQ) advanced around 1/2 percent. A gain,...
READ MORE
MEMBERS ONLY
Steel ETF Breaks Flag Resistance with Big Surge
by Arthur Hill,
Chief Technical Strategist, TrendInvestorPro.com
Even though the long-term trend remains down, the Steel ETF (SLX) is making some bullish waves with a flag breakout on Thursday. After an advance from late June to mid July, SLX consolidated with a falling flag, which is a bullish continuation pattern. Today's breakout signals a...
READ MORE
MEMBERS ONLY
QQQ Continues to Lead - Yen Surges
by Arthur Hill,
Chief Technical Strategist, TrendInvestorPro.com
Stocks opened weak, but quickly firmed and consolidated at lower levels the rest of the day. The overall losses were small with the Russell 2000 ETF (IWM) loosing .71% and the Nasdaq 100 ETF (QQQ) falling just .18%. QQQ continues to lead the major index ETFs and show the most...
READ MORE
MEMBERS ONLY
Charts of Interest: AEP, AMX, HD, INTU, SO, TE
by Arthur Hill,
Chief Technical Strategist, TrendInvestorPro.com
AEP Firms at Broken Resistance.
AMX Surges to Consolidation Highs.
Plus HD, INTU, SO, TE
Video at end of commentary
**This chart analysis is for educational purposes only, and should not
be construed as a recommendation to buy, sell or sell-short said securities**
Click here for iPad/iPhone Version...
READ MORE
MEMBERS ONLY
Chuy's Holdings Forms Bearish Engulfing at Key Retracement
by Arthur Hill,
Chief Technical Strategist, TrendInvestorPro.com
Chuy's Holdings came across the intraday bearish engulfing scan on Wednesday. Even though the trading day has just begun, notice that the stock broke down in July and retraced 62% with a bounce back to 40 in August. The gap and 62% retracement mark resistance as the stock...
READ MORE
MEMBERS ONLY
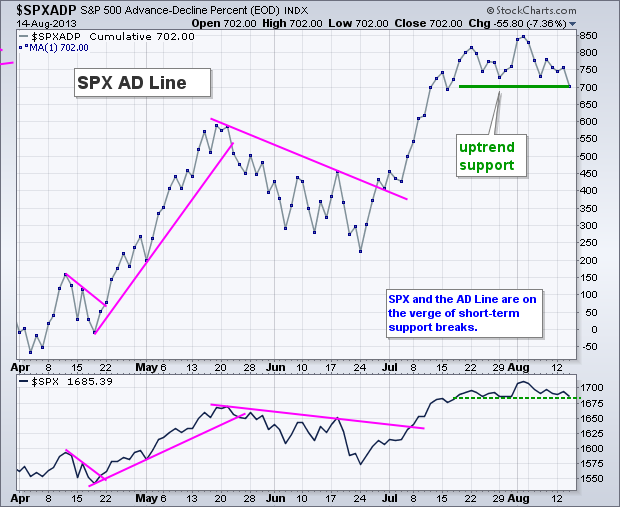
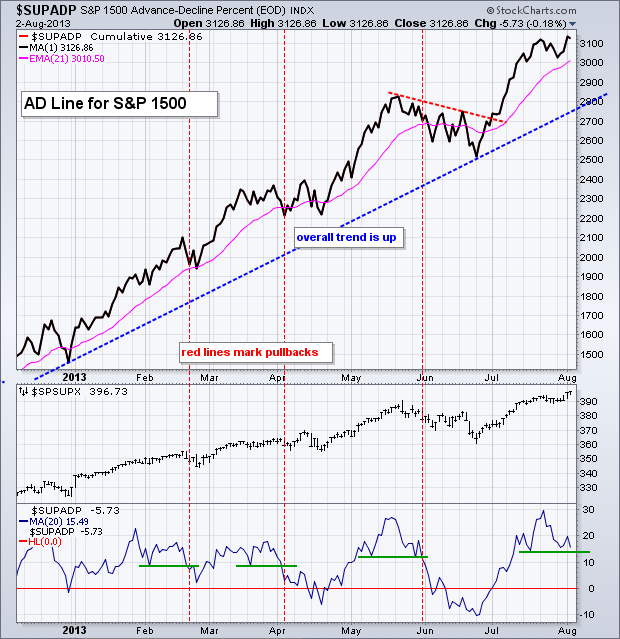
Marking Short-Term Support for the SPX AD Line
by Arthur Hill,
Chief Technical Strategist, TrendInvestorPro.com
**This chart analysis is for educational purposes only, and should not
be construed as a recommendation to buy, sell or sell-short said securities**
Stocks pulled back on Tuesday with the Home Construction iShares (ITB), Gold Miners ETF (GDX) and Biotech SPDR (XBI) leading the way lower. ITB is on...
READ MORE
MEMBERS ONLY
ITB Stalls at Trend Line - GLD Breaks Support
by Arthur Hill,
Chief Technical Strategist, TrendInvestorPro.com
**This chart analysis is for educational purposes only, and should not
be construed as a recommendation to buy, sell or sell-short said securities**
Stocks meandered on Monday. Trading was listless and volume was light. Yes, the dog days of summer are upon us. The Russell 2000 ETF (IWM) edged...
READ MORE
MEMBERS ONLY
Charts of Interest: AGN, D, HCA, MU, THC
by Arthur Hill,
Chief Technical Strategist, TrendInvestorPro.com
AGN Consolidates at Trend Line Resistance.
D Forms Pennant after Big Surge.
Plus HCA, MU and THC
Video at end of commentary
**This chart analysis is for educational purposes only, and should not
be construed as a recommendation to buy, sell or sell-short said securities**
Click here for iPad/...
READ MORE
MEMBERS ONLY
Only One Bullish Percent Index is Below 50%
by Arthur Hill,
Chief Technical Strategist, TrendInvestorPro.com
StockCharts calculates the Bullish Percent Index for over a dozen groups, including several major indices, the main sectors and a few industry groups. A list can be found on the end-of-day market summary page. Notice that all BPIs are at or above 50%, which favors the bulls. The...
READ MORE
MEMBERS ONLY
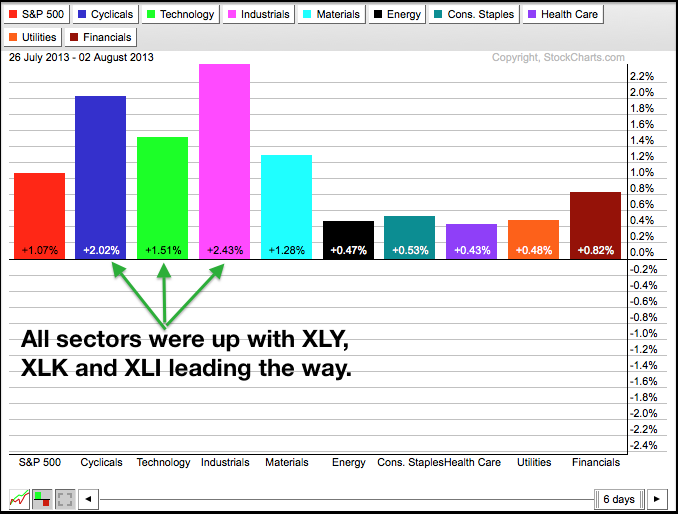
SPY Holds Breakout as QQQ Leads Market Higher
by Arthur Hill,
Chief Technical Strategist, TrendInvestorPro.com
It was a good week for the stock market. The major index ETFs gained and hit fresh 52-week highs. The Nasdaq 100 ETF (QQQ) and S&P MidCap 400 SPDR (MDY) led the way with 2+ percent gains. All sectors were up with the Consumer Discretionary SPDR (XLY)...
READ MORE
MEMBERS ONLY
Key Breadth Indicators Confirm Underlying Strength
by Arthur Hill,
Chief Technical Strategist, TrendInvestorPro.com
The major stock indices recorded 52-week highs this week and these highs were confirmed by the breadth indicators for the S&P 1500. Note that the S&P 500, S&P MidCap 400, S&P SmallCap 600, Nasdaq 100 and Dow Industrials recorded fresh 52-...
READ MORE
MEMBERS ONLY
Elder Bars Turns Green as ARIA Breaks Flag Resistance
by Arthur Hill,
Chief Technical Strategist, TrendInvestorPro.com
Chartists looking for stocks on the move can turn to our pre-defined scans page and the Elder bar scans. Stocks with an Elder bar turning green are turning up. Those with an Elder bar turning red are turning down. The chart below shows Ariad Pharma with a big green...
READ MORE
MEMBERS ONLY
Nasdaq Scores with New Highs in AD Line and AD Volume Line
by Arthur Hill,
Chief Technical Strategist, TrendInvestorPro.com
The major index ETFs affirmed their uptrends with new highs this week. In addition, the Consumer Discretionary SPDR (XLY) and the Industrials SPDR (XLI) hit new highs, as did the Nasdaq AD Line and AD Volume Line. There are simply no signs of weakness in the market right now. Breadth...
READ MORE
MEMBERS ONLY
SPY Hits 52-week High as TLT Hits 52-week Low
by Arthur Hill,
Chief Technical Strategist, TrendInvestorPro.com
Stocks moved higher on positive economic news, and bonds moved lower. The ISM Manufacturing Index rose to 55.40, which is a two year high. Initial jobless claims fell to 326,000, which is the lowest level since January 2008. Stocks took the news well with the major index ETFs...
READ MORE
MEMBERS ONLY
S&P MidCap 400 SPDR Takes the Lead with a New High
by Arthur Hill,
Chief Technical Strategist, TrendInvestorPro.com
Stocks surged after Fed day with the S&P MidCap 400 SPDR (MDY) hitting a new high early Thursday. The indicator window shows the price relative (MDY:SPY ratio) hitting a new high as well. Notice that the ETF's Technical Rank (SCTR) has been above 70 the...
READ MORE
MEMBERS ONLY
QQQ Leads with New High - GLD Forms Bullish Flag
by Arthur Hill,
Chief Technical Strategist, TrendInvestorPro.com
Stocks were all over the place on Wednesday, but the overall range was relatively small and the day-to-day change was miniscule. Stocks surged immediately after the Fed statement, peaked at 3PM and moved lower the final hour. I am not going to read too much into this late...
READ MORE
MEMBERS ONLY
Charts of Interest: ATML, CHS, FST, NVDA, SWKS
by Arthur Hill,
Chief Technical Strategist, TrendInvestorPro.com
ATML Forms Continuation Pattern.
CHS Show Signs of Accumulation.
Plus FST, NVDA and SWKS
***Video edition is at the end***
iPad and iPhone Version
This commentary and charts-of-interest are designed to stimulate thinking. This analysis is
not a recommendation to buy, sell, hold or sell short any security...
READ MORE
MEMBERS ONLY
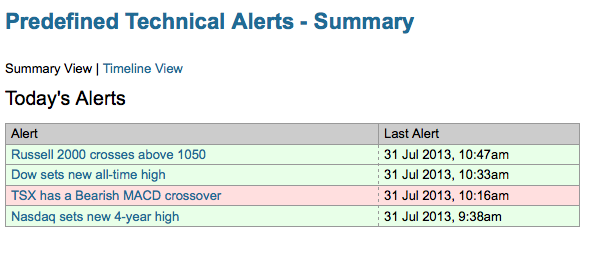
Dow and Nasdaq Hit New Highs
by Arthur Hill,
Chief Technical Strategist, TrendInvestorPro.com
Even though stocks were all over the place on Wednesday, the Dow recorded an all time high and the Nasdaq recorded a four year high. Not shabby at all. StockCharts users can keep abreast of these milestones on the Predefined Technical Alerts page.
Click this image for a live chart...
READ MORE
MEMBERS ONLY
Stocks, Bonds, the Dollar and Gold Await the Fed
by Arthur Hill,
Chief Technical Strategist, TrendInvestorPro.com
Stocks meandered again on Tuesday. Large techs caught a modest bid with the Nasdaq 100 ETF (QQQ) advancing .70% on the day. The remaining moves were non events. The sectors were mixed with the Technology SPDR (XLK), Industrials SPDR (XLI) and Utilities SPDR (XLU) finishing modestly higher. The Basic Materials...
READ MORE
MEMBERS ONLY
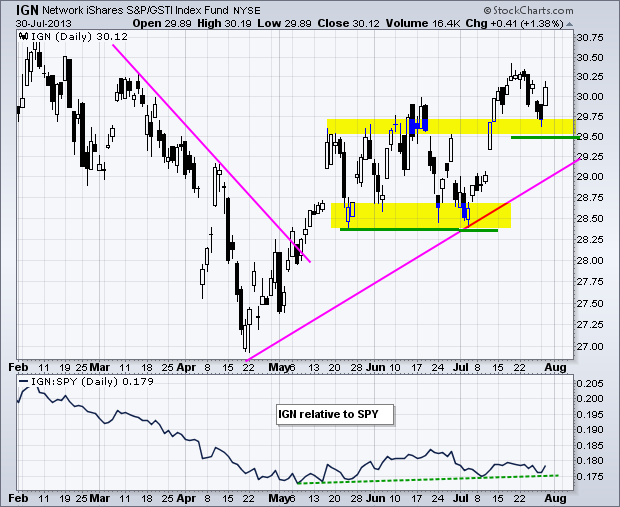
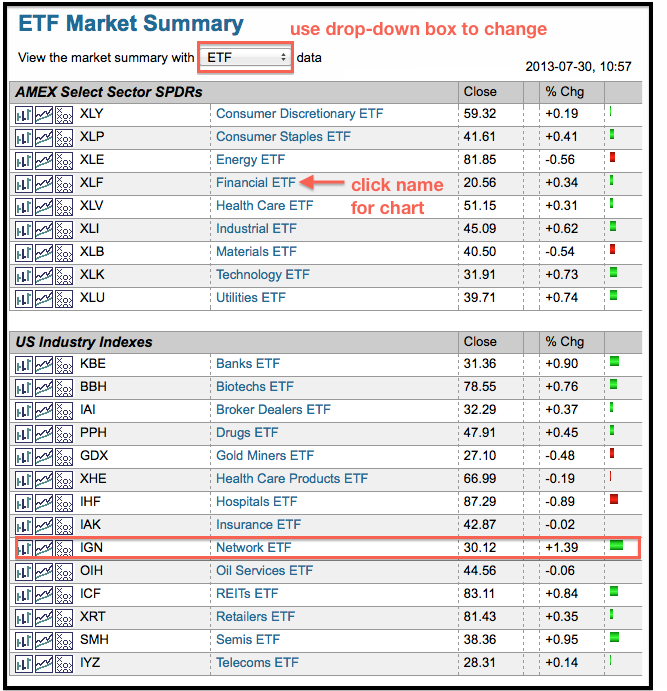
Networking iShares Leads Industry Group ETFs on Market Summary Page
by Arthur Hill,
Chief Technical Strategist, TrendInvestorPro.com
The Market Summary (ETF mode) provides a quick overview of performance for groups of ETFs. These include broad market, sector, industry group, international, bond, commodity and currency ETFs. Within the industry group ETFs, the Networking iShares (IGN) is leading with a 1+ percent gain in early trading on Tuesday.
Click...
READ MORE
MEMBERS ONLY
SPY Extends Consolidation - MOO Bounces on Good Volume
by Arthur Hill,
Chief Technical Strategist, TrendInvestorPro.com
Stocks edged lower on Monday with the Russell 2000 ETF (IWM) leading the way (-.70%). Losses were relatively small as selling pressure was contained. Seven of nine sectors were down with the Energy SPDR (XLE) leading the way lower (-.94%). The Basic Materials SPDR (XLB) and the Utilities SPDR (XLU)...
READ MORE
MEMBERS ONLY
Charts of Interest: ADSK, AMKR, FSLR, PBI, R, WTW
by Arthur Hill,
Chief Technical Strategist, TrendInvestorPro.com
ADSK Hits Resistance at Retracement Zone.
AMKR Corrects with Small Wedge.
Plus FSLR, PBI, R, WTW
This commentary and charts-of-interest are designed to stimulate thinking. This analysis is
not a recommendation to buy, sell, hold or sell short any security (stock ETF or otherwise).
We all need to...
READ MORE
MEMBERS ONLY
Bearish Resistance Line Holds on Alcoa P&F Chart
by Arthur Hill,
Chief Technical Strategist, TrendInvestorPro.com
StockCharts gives users the power to chart intraday P&F charts with trend lines. In this example, the 60-minute P&F Chart shows Alcoa (AA) breaking the Bullish Support Line in June (red 6) and moving to new lows. The July bounce carried the stock to the...
READ MORE