MEMBERS ONLY
Stocks Get Oversold Bounce within Correction
by Arthur Hill,
Chief Technical Strategist, TrendInvestorPro.com
Stocks caught a bid on Thursday as the major index ETFs advanced over 1% on the day. A better-than-expected retail sales report put stocks on a positive footing from the start and they extended their advance throughout the day. There is also talk that the Fed will start jawboning down...
READ MORE
MEMBERS ONLY
Two Technical Features Suggest Support for the Homebuilders SPDR
by Arthur Hill,
Chief Technical Strategist, TrendInvestorPro.com
The Homebuilders SPDR (XHB) is finding support with a bounce last week and small gain in early trading on Thursday. Notice that the ETF is trading near the November trend line and the 61.80% retracement. These two items suggest support is at hand. A break above last week'...
READ MORE
MEMBERS ONLY
Charts of Interest: ANF, BHI, FL, IBM, MMM, NEM, URBN
by Arthur Hill,
Chief Technical Strategist, TrendInvestorPro.com
ANF Forms Island Reversal.
BHI Gaps Down and Tests Support.
Plus FL, IBM, MMM, NEM, URBN
This commentary and charts-of-interest are designed to stimulate thinking. This analysis is
not a recommendation to buy, sell, hold or sell short any security (stock ETF or otherwise).
We all need to think for...
READ MORE
MEMBERS ONLY
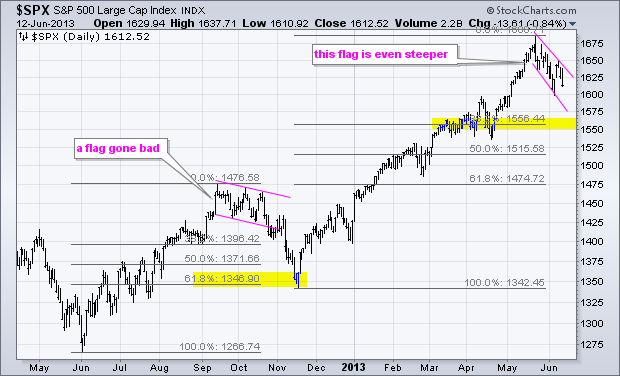
Setting a Fibonacci and Support Target for the S&P 500 $SPX
by Arthur Hill,
Chief Technical Strategist, TrendInvestorPro.com
The Asian rout continues as the Shanghai Composite ($SSEC) caught up with a 2.83% decline on Thursday. The Hang Seng Index ($HSI) fell another 2.3% and the Nikkei 225 ($NIKK) plunged over 6%. European stocks are also down with the major indices falling around 1% in early trading...
READ MORE
MEMBERS ONLY
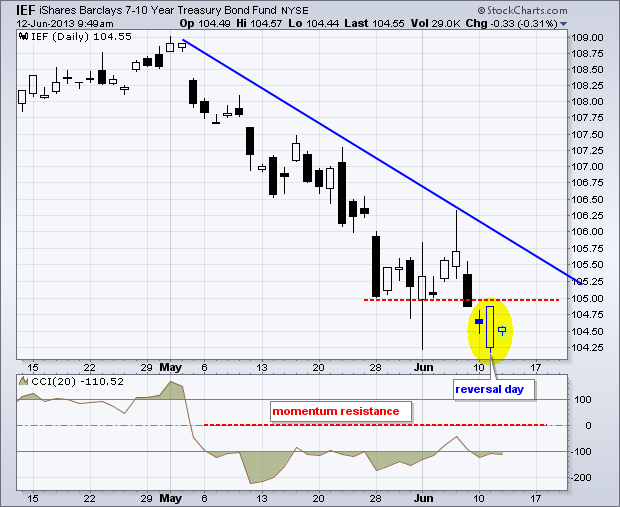
Treasury Bond ETFs Forge Intraday Reversals
by Arthur Hill,
Chief Technical Strategist, TrendInvestorPro.com
The 7-10 year T-Bond ETF (IEF) opened weak and closed strong on Tuesday to forge an outside reversal day or bullish engulfing pattern. This is potentially positive, but we have yet to see follow through with a break above first resistance at 105. Also notice that the Commodity Channel Index...
READ MORE
MEMBERS ONLY
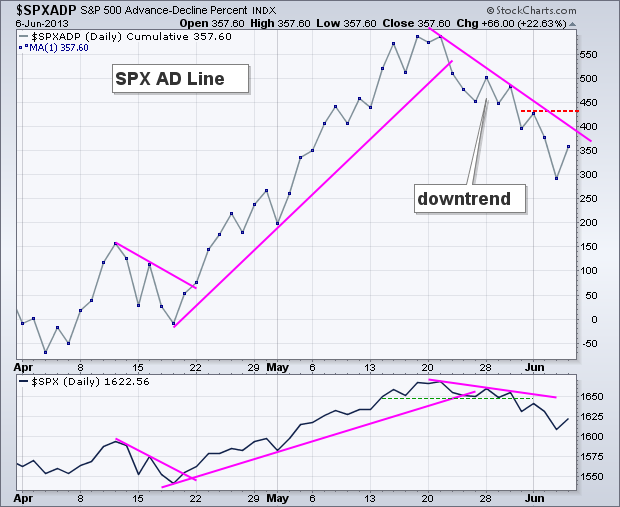
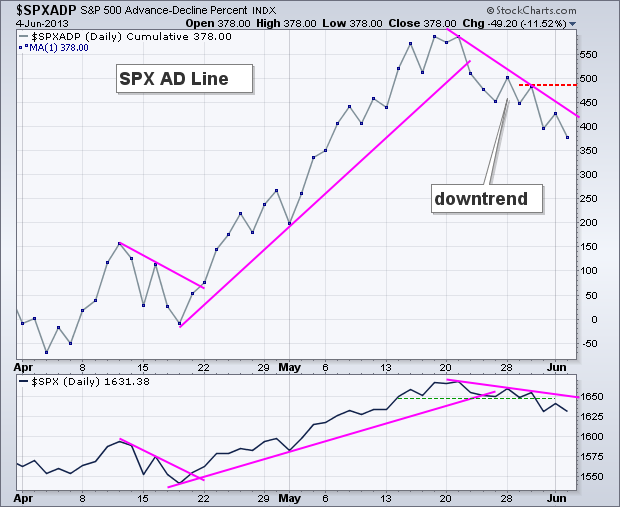
SPY and SPX AD Volume Line Fail at Resistance
by Arthur Hill,
Chief Technical Strategist, TrendInvestorPro.com
Stocks opened weak, got a pretty nice bounce and then turned lower to close weak. The major index ETFs were down around 1%. All sectors were down with the Energy SPDR (XLE) and Basic Materials SPDR (XLB) leading the way. Weakness in these two can be attributed to declines in...
READ MORE
MEMBERS ONLY
Regional Bank SPDR Challenges Flag Resistance
by Arthur Hill,
Chief Technical Strategist, TrendInvestorPro.com
With a bounce after the open on Tuesday, the Regional Bank SPDR (KRE) is showing resilience as it challenges flag resistance. Notice how the ETF surged from mid April to mid May and then corrected with the falling zigzag (flag). A breakout at 33.25 would signal a continuation higher....
READ MORE
MEMBERS ONLY
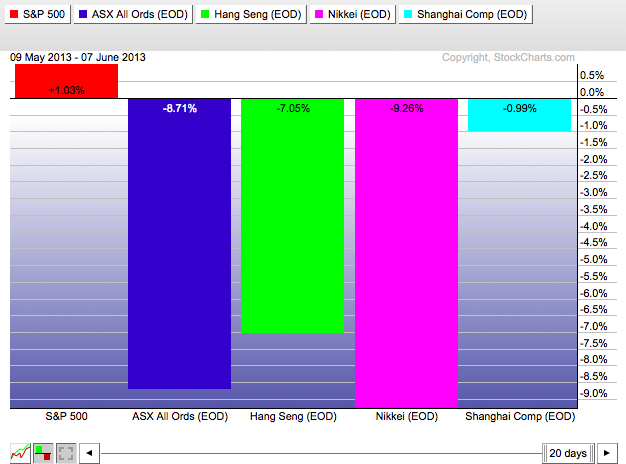
Asian Shares Get Hammered as SPY Hits Resistance
by Arthur Hill,
Chief Technical Strategist, TrendInvestorPro.com
US stocks are actually looking vulnerable on the charts as the major index ETFs stall near resistance levels and key retracements. Also note that Asian stocks were weak on Tuesday with the Shanghai Composite ($SSEC), Hang Seng Index ($HSI) and Nikkei 225 ($NIKK) falling over 1%. Emerging stock markets were...
READ MORE
MEMBERS ONLY
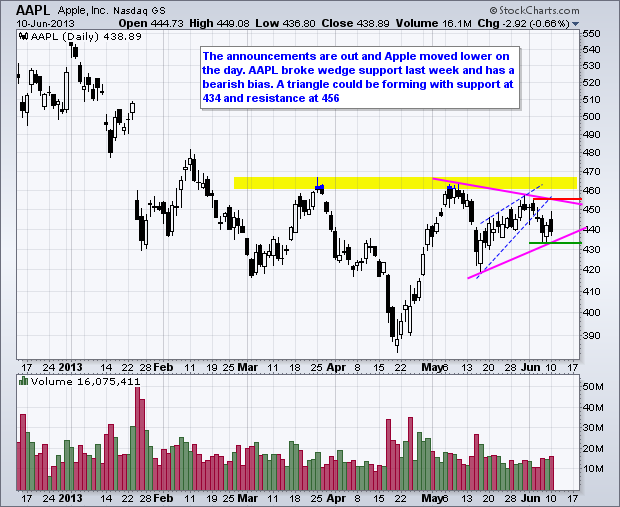
Charts of Interest: AAPL, AEO, COST, FCX, MHK, VLO
by Arthur Hill,
Chief Technical Strategist, TrendInvestorPro.com
AAPL Battles Resistance after Announcements.
AEO Forms Bear Flag.
Plus COST, FCX, MHK, VLO
This commentary and charts-of-interest are designed to stimulate thinking. This analysis is
not a recommendation to buy, sell, hold or sell short any security (stock ETF or otherwise).
We all need to think for ourselves when...
READ MORE
MEMBERS ONLY
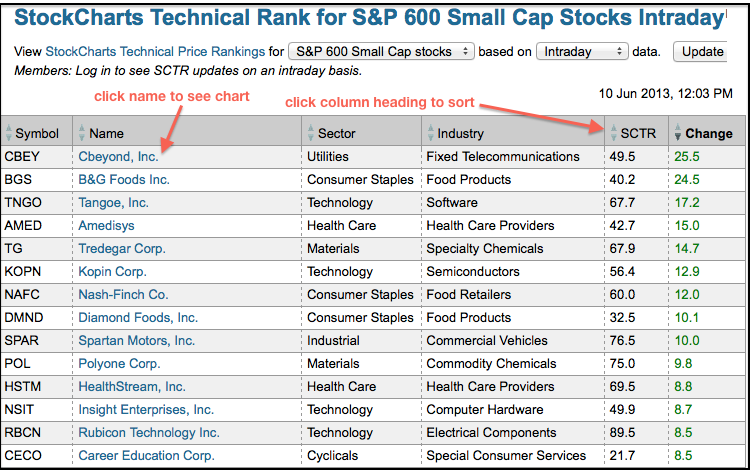
Cbeyond Shows Relative Strength on Small-cap SCTR Table
by Arthur Hill,
Chief Technical Strategist, TrendInvestorPro.com
StockCharts Technical Rank (SCTR) for the S&P SmallCap 600 ($SML) ranks 600 small-cap stocks according to their technical strength. Chartists can also sort this table by change to find the bigger (relative) movers. Cbeyond (CBEY), B&G Foods (BGS) and Tangoe Inc (TNGO) are leading today with...
READ MORE
MEMBERS ONLY
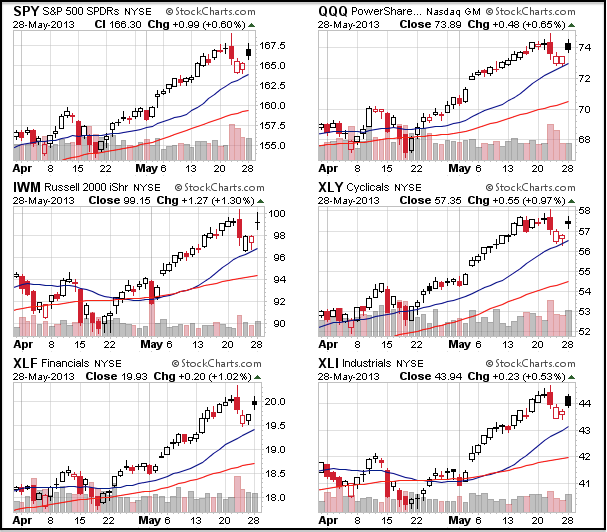
SPY, QQQ and IWM Challenge Short-Term Resistance
by Arthur Hill,
Chief Technical Strategist, TrendInvestorPro.com
Stocks reacted positively to a rather routine employment report. The Labor department reported a 175,000 increase in non-farm payrolls for May. This is the not-to-hot and not-to-cold version of the jobs report. It is enough to suggest modest economic growth and keep the hopes alive for sustained quantitative easing....
READ MORE
MEMBERS ONLY
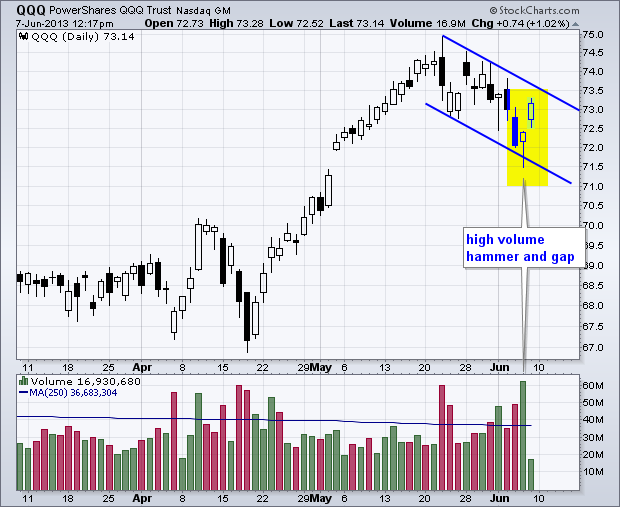
QQQ Follows Thru on High Volume Hammer
by Arthur Hill,
Chief Technical Strategist, TrendInvestorPro.com
The Nasdaq 100 ETF (QQQ) fell below 72 on Thursday, but rallied to forge a strong close and form a hammer. Also notice that volume surged to its highest in over three months. QQQ followed through with a gap and move above 73, but has yet to break flag resistance...
READ MORE
MEMBERS ONLY
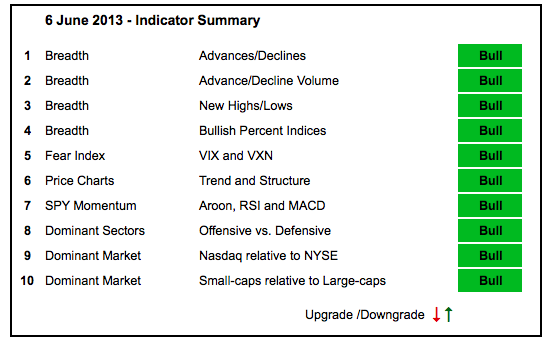
Correction Pushes 3 Indicators to Make-or-Break Points
by Arthur Hill,
Chief Technical Strategist, TrendInvestorPro.com
The market is hitting its first make-or-break point. The bulk of the evidence remains bullish and this decline is still considered a correction within a bigger uptrend. The current decline, however, has extended long enough to push some indicators to the brink though. NYSE Net New Highs have been flirting...
READ MORE
MEMBERS ONLY
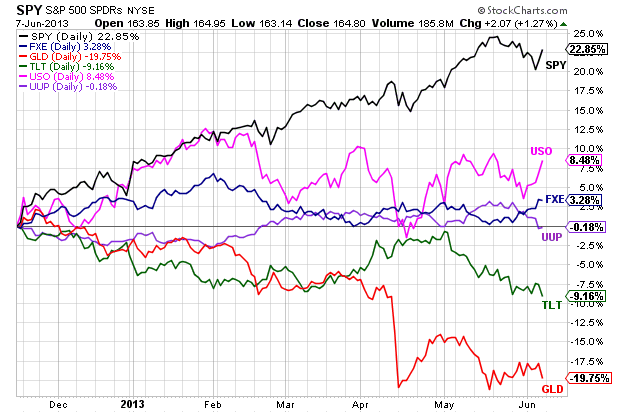
SPY Bounces off First Support as USO Hits Resistance
by Arthur Hill,
Chief Technical Strategist, TrendInvestorPro.com
And now for the employment report. Here's the thing with these big reports. Traders have to get two things right to successfully trade the report. First, you have to guess the non-farm payroll number. Second, you have to guess the market's reaction. The report can be...
READ MORE
MEMBERS ONLY
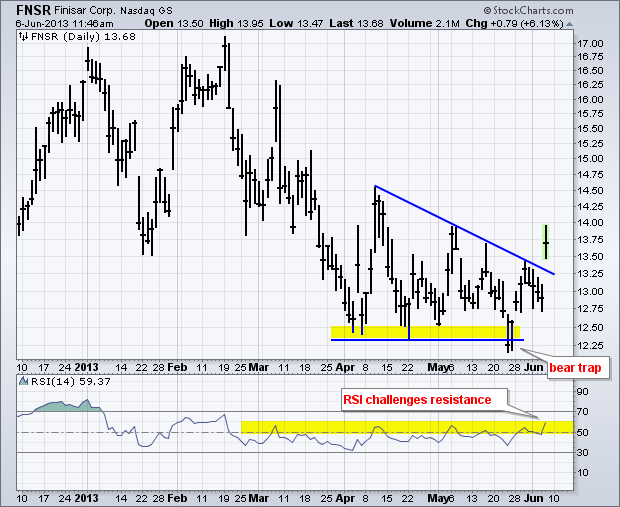
Finisar Makes the Gap Scan with a Surge Higher
by Arthur Hill,
Chief Technical Strategist, TrendInvestorPro.com
Finisar (FNSR) has had a tough year so far, but the stock is showing signs of life after a bear trap in late May (failed support break) and gap breakout in early June. Also notice that RSI is challenging range resistance and a breakout at 60 would be bullish for...
READ MORE
MEMBERS ONLY
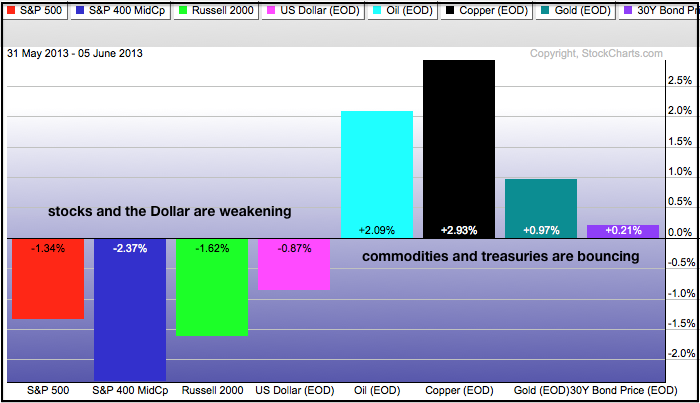
Stocks Extend Correction - Weak Dollar Helps Commodities
by Arthur Hill,
Chief Technical Strategist, TrendInvestorPro.com
It was a sea of red on Wednesday as the major index ETFs extended their declines and all nine sectors fell. That's the bad news. The good news, perhaps, is that the stock market is short-term oversold now. The upcoming employment numbers represent the uncertain news. The economic...
READ MORE
MEMBERS ONLY
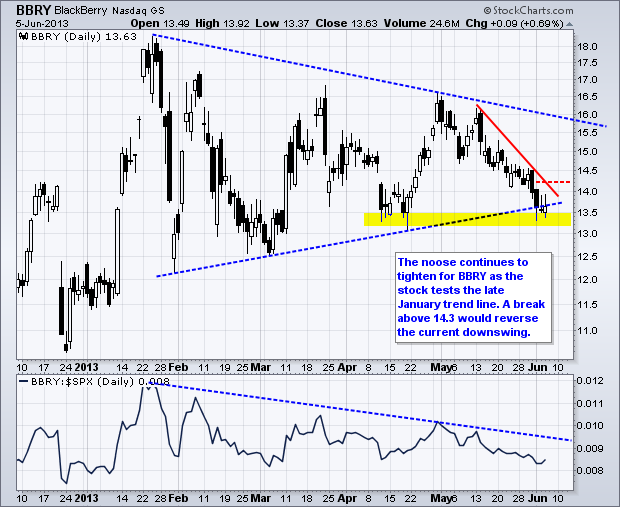
Charts of Interest: BBRY, DE, IMAX, KBH, MWV, PKI
by Arthur Hill,
Chief Technical Strategist, TrendInvestorPro.com
BBRY Tests Channel Support with Bounce.
DE Breaks Flag Support.
Plus IMAX, KBH, MWV, PKI
This commentary and charts-of-interest are designed to stimulate thinking. This analysis is
not a recommendation to buy, sell, hold or sell short any security (stock ETF or otherwise).
We all need to think for ourselves...
READ MORE
MEMBERS ONLY
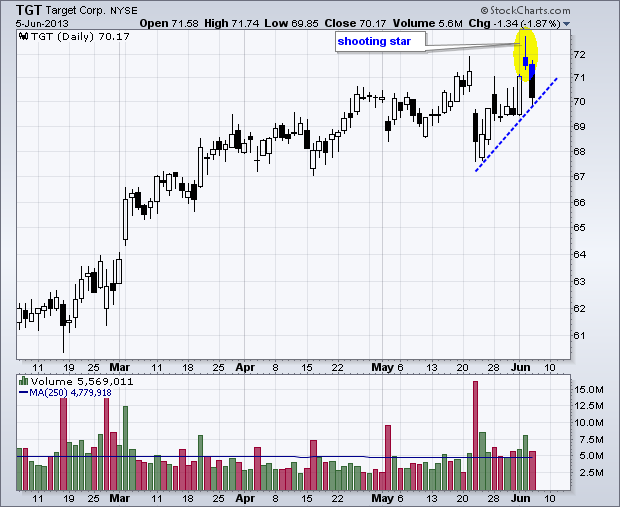
Target Fills Gap after Shooting Star
by Arthur Hill,
Chief Technical Strategist, TrendInvestorPro.com
Target (TGT) surged to a new high above 72, but failed to hold above 72 as a shooting star candlestick formed on Tuesday. The stock went on to fill Tuesday's gap with a long filled candlestick on Wednesday. This confirms the shooting star and resistance in the 71-72...
READ MORE
MEMBERS ONLY
GLD Tests Rising Wedge Support - USO Forms Small Flag
by Arthur Hill,
Chief Technical Strategist, TrendInvestorPro.com
Stocks were all over the place on Tuesday. The major index ETFs opened stronger, moved lower during the day and bounced in the afternoon. Despite this bounce, the major index ETFs closed lower with the Russell 2000 ETF (IWM) leading the way (-1.06%). All sectors were lower with the...
READ MORE
MEMBERS ONLY
Facebook Lags, but Support Could be Near
by Arthur Hill,
Chief Technical Strategist, TrendInvestorPro.com
Facebook (FB) led the market from late October until early January, but stumbled in January and has lagged the S&P 500 since. Despite relative weakness and a 4-5 month downtrend, support could be near as the stock trades near the 61.80% retracement and broken resistance.
Click this...
READ MORE
MEMBERS ONLY
IWM Holds Up Best with a Pennant Formation
by Arthur Hill,
Chief Technical Strategist, TrendInvestorPro.com
Stocks opened weak, but firmed and rebounded in the afternoon. The major index ETFs finished mixed on the day with the S&P MidCap 400 SPDR (MDY) falling .34% and the Russell 2000 ETF (IWM) rising .95% on the day. Wow, you don't see that very often....
READ MORE
MEMBERS ONLY
Charts of Interest: AMCC, ASEI, CAT, ISRG, JBLU, NIHD
by Arthur Hill,
Chief Technical Strategist, TrendInvestorPro.com
AMCC Makes a Move with Good Volume.
ASEI Tests Support with Long Lower Shadow.
Plus CAT, ISRG, JBLU, NIHD
This commentary and charts-of-interest are designed to stimulate thinking. This analysis is
not a recommendation to buy, sell, hold or sell short any security (stock ETF or otherwise).
We all need...
READ MORE
MEMBERS ONLY
All Ords Index Breaks Key Support
by Arthur Hill,
Chief Technical Strategist, TrendInvestorPro.com
Weakness is spreading in Asia as the Australian All Ords Index ($AORD) breaks support from the April lows. The chart below shows the index testing support last week. $AORD closed at 4873 on Monday, which is just below the April lows. Also notice that the index has been underperforming the...
READ MORE
MEMBERS ONLY
SPX AD Volume Line Breaks Support - SPY Breaks Triangle
by Arthur Hill,
Chief Technical Strategist, TrendInvestorPro.com
The major index ETFs closed lower as stocks were hit with some pretty strong selling pressure Friday afternoon. The S&P 500 ETF (SPY) led the way with a 1.44% decline. All sectors were down with the Healthcare SPDR (XLV), Consumer Staples SPDR (XLP) and Utilities SPDR (XLU)...
READ MORE
MEMBERS ONLY
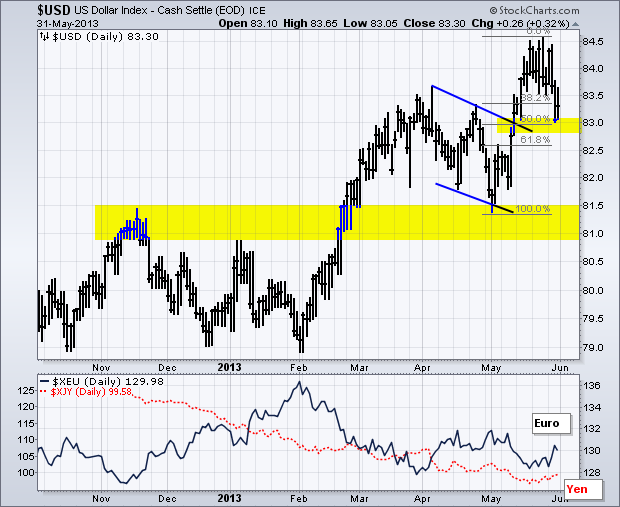
US Dollar Index Tests Breakout ahead of Big Economic Week
by Arthur Hill,
Chief Technical Strategist, TrendInvestorPro.com
The US Dollar Index ($USD) is in a long-term uptrend, but the index pulled back this week to test the most recent breakout. A strong breakout should hold, while a weak breakout would fold. This is am important test for the greenback as we head into a big economic reporting...
READ MORE
MEMBERS ONLY
Randgold Forges a Double Top Breakout on P&F Chart
by Arthur Hill,
Chief Technical Strategist, TrendInvestorPro.com
Gold stocks remain down in the dumps and in long-term downtrends, but signs of short-term strength are emerging. Randgold (GOLD) formed a higher low in May and the current X-Column broke above the prior X-Column to forge a P&F breakout. This breakout, however, is still below the Bearish...
READ MORE
MEMBERS ONLY
Nasdaq AD Volume Line Hits New High
by Arthur Hill,
Chief Technical Strategist, TrendInvestorPro.com
After hitting new highs in mid May, the major index ETFs moved into consolidation patterns the last two weeks. A little rest, or even a pullback, would be healthy for the uptrend. With this sideway movement, there is no change in the indicator summary. Of note, the Nasdaq is showing...
READ MORE
MEMBERS ONLY
SPY AD Volume Line Holds the Short-Term Key
by Arthur Hill,
Chief Technical Strategist, TrendInvestorPro.com
Stocks moved higher again on Thursday with mid-caps leading the way. The overall gains were modest though and the major index ETFs remain below Tuesday's highs. The Finance SPDR (XLF) led the sectors here with a 1.2% gain on the day. The Technology SPDR (XLK) and Industrials...
READ MORE
MEMBERS ONLY
Nikkei 225 Hits First Support with another 5+ Percent Decline
by Arthur Hill,
Chief Technical Strategist, TrendInvestorPro.com
For the second Thursday in a row, the Nikkei 225 ($NIKK) fell over 5% and extended its correction. While the decline from 15900 looks dramatic, it is still just a correction within a bigger uptrend and pales in comparison to the prior surge. The November trend line and broken resistance...
READ MORE
MEMBERS ONLY
Charts of Interest: AAPL, ABX, HCA, JDSU, WNR
by Arthur Hill,
Chief Technical Strategist, TrendInvestorPro.com
AAPL Stalls Just below Neckline Resistance.
ABX Breaks Trend Line with Good volume.
Plus HCA, JDSU and WNR
This commentary and charts-of-interest are designed to stimulate thinking. This analysis is
not a recommendation to buy, sell, hold or sell short any security (stock ETF or otherwise).
We all need to...
READ MORE
MEMBERS ONLY
SPY Fails to Hold Gap - GLD Continues to Firm
by Arthur Hill,
Chief Technical Strategist, TrendInvestorPro.com
Stocks weakened on Wednesday with the defensive sectors leading the way down. The Consumer Staples SPDR (XLP), Healthcare SPDR (XLV) and Utilities SPDR (XLU) declined 1.5% or more. Interest rate sensitive stocks continued to slide with the Real Estate iShares (IYR) and Telecom iShares (IYZ) falling around 2%. Homebuilders...
READ MORE
MEMBERS ONLY
SPY and QQQ Gap, but Turn Indecisive after Gap
by Arthur Hill,
Chief Technical Strategist, TrendInvestorPro.com
Stocks got their pop with a strong surge on the open. Even though stocks closed higher, I was not impressed with post-gap price action. In addition, notice that indecisive candlesticks formed in a number of stocks and ETFs. The charts below show SPY and QQQ forming small black candlesticks with...
READ MORE
MEMBERS ONLY
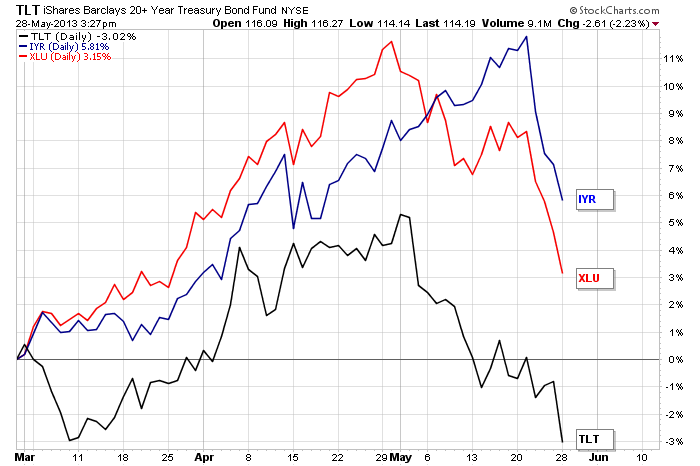
REITs, Utilities and Treasuries Fall Off a Cliff
by Arthur Hill,
Chief Technical Strategist, TrendInvestorPro.com
The Utilities SPDR (XLU) and the 20+ Year T-Bond ETF (TLT) both peaked in early May and declined sharply the last four weeks. The Real Estate iShares (IYR) continued higher into mid May, but peaked last week and fell sharply the last four days. Interest rate sensitive issues are not...
READ MORE
MEMBERS ONLY
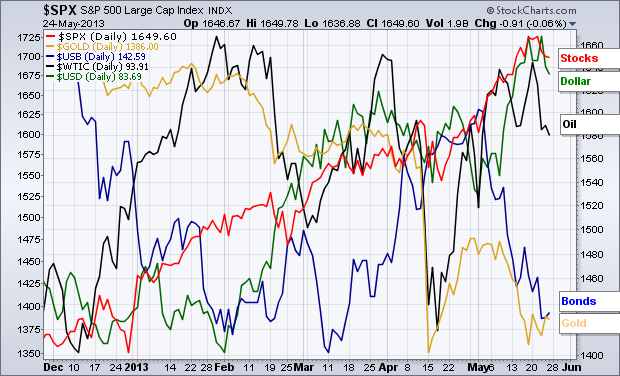
SPY Bounces after Weak Opens - TLT Remains Weak
by Arthur Hill,
Chief Technical Strategist, TrendInvestorPro.com
Stocks and the Dollar are in uptrends, while Treasuries and gold remain in downtrends. Stocks pulled back on Wednesday and opened weak on both Thursday and Friday. However, buyers stepped in after these weak openings and stocks closed off their lows on both days. The bulls still have the edge...
READ MORE
MEMBERS ONLY
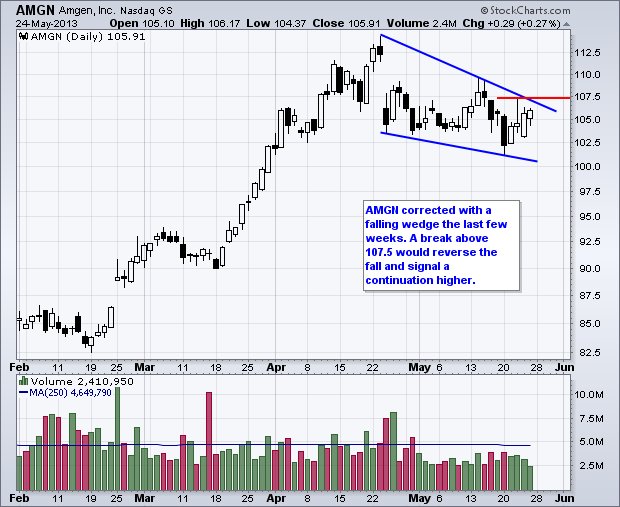
Charts of Interest: AMGN, BSBR, FAST, MOS, IPI
by Arthur Hill,
Chief Technical Strategist, TrendInvestorPro.com
AMGN Corrects with Falling Wedge.
FAST Surges and Consolidates.
Plus BSBR, MOS IPI
This commentary and charts-of-interest are designed to stimulate thinking. This analysis is
not a recommendation to buy, sell, hold or sell short any security (stock ETF or otherwise).
We all need to think for ourselves when it...
READ MORE
MEMBERS ONLY
Three Fan Lines Take Shape on the Spot Light Crude Chart
by Arthur Hill,
Chief Technical Strategist, TrendInvestorPro.com
Spot Light Crude ($WTIC) has been quite volatile the last few weeks with two declines from the 97 area and two bounces off the 92 area. It is possible to draw three trend lines extending up from the mid April low. The mid May lows and third fan line mark...
READ MORE
MEMBERS ONLY
Midweek Pullback is not Enough to Affect Bigger Uptrend
by Arthur Hill,
Chief Technical Strategist, TrendInvestorPro.com
Stocks were hit with a reversal day on Wednesday, but this was not enough to affect the bigger uptrends. The AD Lines and AD Volume Lines hit new highs just before the reversal day. Net New Highs remain strong and the offensive sectors are leading again. Despite this bullish environment,...
READ MORE
MEMBERS ONLY
S&P 500 AD Line Breaks Short-Term Support
by Arthur Hill,
Chief Technical Strategist, TrendInvestorPro.com
Stocks plunged on Wednesday and firmed somewhat on Thursday. Even though the medium-term trends remain up, the short-term uptrends are in jeopardy and stocks are still ripe for a correction. A correction can form as a sideways consolidation, a decline or as a combination of the two (think zigzag lower)...
READ MORE
MEMBERS ONLY
Lumber Prices Plunge, but Housing Stocks Remain Strong
by Arthur Hill,
Chief Technical Strategist, TrendInvestorPro.com
An interesting divergence is brewing between lumber and housing stocks. Lumber Futures ($LUMBER) fell around 25% the last two months, but the Home Construction iShares (ITB) hit a 52-week high recently. Something may need to give because lumber and housing stocks are positively correlated for the most part.
Click this...
READ MORE
MEMBERS ONLY
IWM Breaks Channel Trend Line - USO Breaks Support
by Arthur Hill,
Chief Technical Strategist, TrendInvestorPro.com
Stocks finally got spooked as the bulls pulled in their horns and the bears showed their claws. The market opened strong and moved higher in early trading, but quickly reversed and moved sharply lower. The Fed got the blame as investors contemplated an end to quantitative easing. Frankly speaking, an...
READ MORE