MEMBERS ONLY
Charts: AEO, BBRY, CQB, DGX, EMC, FINL, GM, TEVA
by Arthur Hill,
Chief Technical Strategist, TrendInvestorPro.com
AEO Nears Broken Support with Rising Wedge.
Traders Hold their Breadth on BBRY.
Plus CQB, DGX, EMC, FINL, GM, TEVA
This commentary and charts-of-interest are designed to stimulate thinking. This analysis is
not a recommendation to buy, sell, hold or sell short any security (stock ETF or otherwise).
We all...
READ MORE
MEMBERS ONLY
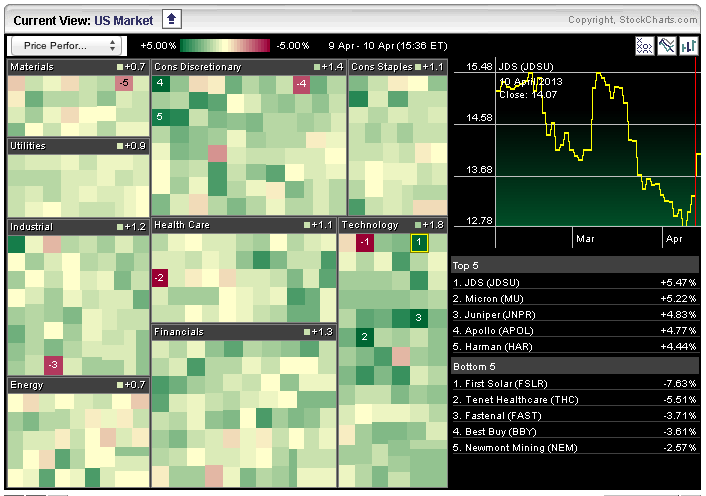
Tech Stocks See the Most Green on the Market Carpet
by Arthur Hill,
Chief Technical Strategist, TrendInvestorPro.com
The Sector Market carpet is full of green on Wednesday with the average tech stock up 1.8%. JDS Uniphase, Micron and Juniper are leading the way. There are, however, some big losers today with First Solar, Tenet and Fastenal down over 3%. These can be seen with the red...
READ MORE
MEMBERS ONLY
IWM Rebounds to Broken Support - UUP Tests March Lows
by Arthur Hill,
Chief Technical Strategist, TrendInvestorPro.com
Stocks limped higher as the Euro, gold and oil rebounded on Tuesday. A pullback in the Dollar also lifted silver and copper, both of which have been in the doldrums of late. The Basic Materials SPDR (XLB) stole the show as the only sector to gain more than 1%. XLB...
READ MORE
MEMBERS ONLY
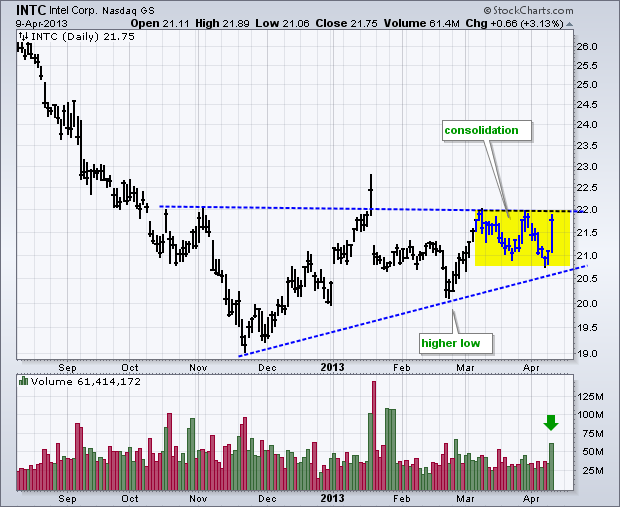
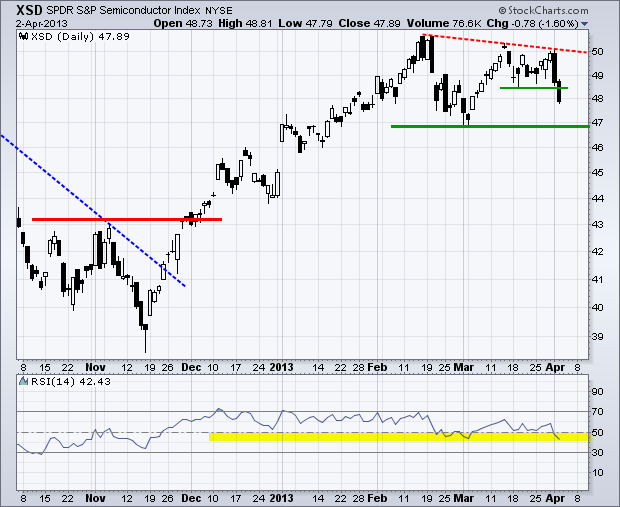
Intel Surges to Resistance on High Volume
by Arthur Hill,
Chief Technical Strategist, TrendInvestorPro.com
Intel gave a lift to the MarketVectors Semiconductor ETF (SMH) and Semiconductor SPDR (XSD) with a 3.13% advance on the highest volume since late February. Notice how the stock formed a higher low with the late February surge and then consolidated the last five weeks. A consolidation breakout would...
READ MORE
MEMBERS ONLY
SPX is Priced for Perfection as Third Quarter Earnings Start
by Arthur Hill,
Chief Technical Strategist, TrendInvestorPro.com
The major index ETFs followed through on the Friday afternoon rebound and closed modestly higher on Monday. The Russell 2000 ETF (IWM) led the way, but this small-cap ETF was also hit the hardest last week. Technically, the S&P 500 ETF (SPY) remains the strongest of the big...
READ MORE
MEMBERS ONLY
Charts of Interest: AAPL, AES, BHI, COF, FCX, GMED, POT
by Arthur Hill,
Chief Technical Strategist, TrendInvestorPro.com
AAPL Tests Prior Low with Indecisive Candlesticks.
AES Bounces with High Volume.
Plus BHI, COF, FCX, GMED, POT
This commentary and charts-of-interest are designed to stimulate thinking. This analysis is
not a recommendation to buy, sell, hold or sell short any security (stock ETF or otherwise).
We all need to...
READ MORE
MEMBERS ONLY
Silver Tests Long-term Support $SILVER
by Arthur Hill,
Chief Technical Strategist, TrendInvestorPro.com
After falling sharply in April and September 2011, Spot Silver ($SILVER) moved into a trading range with resistance at 36 and support at 26. Silver has touched support at least three times and is poised to test this area again. This marks an important test because a break would signal...
READ MORE
MEMBERS ONLY
SPY Bounces off Support as TLT Becomes Overbought
by Arthur Hill,
Chief Technical Strategist, TrendInvestorPro.com
Stocks were hit hard in early trading on Friday, but managed to firm during the day and even mount a recovery in the afternoon. The Nasdaq 100 ETF (QQQ) and S&P 500 ETF (SPY) still finished modestly lower. The S&P Midcap SPDR (MDY) surged and almost...
READ MORE
MEMBERS ONLY
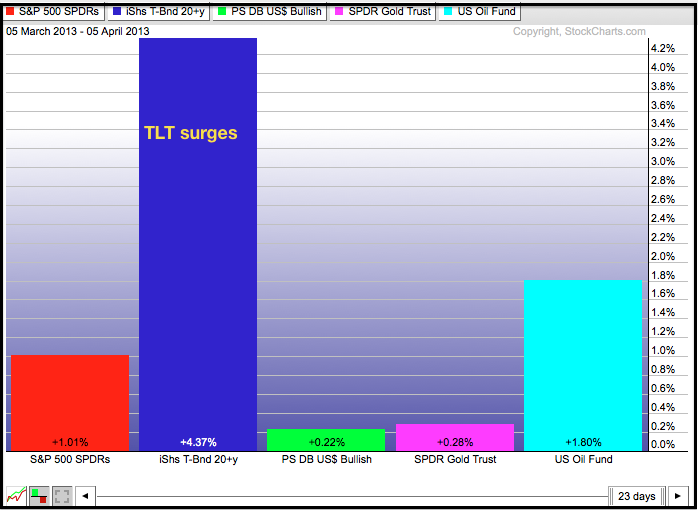
Treasury Bond ETF Outperforms SPY and USO
by Arthur Hill,
Chief Technical Strategist, TrendInvestorPro.com
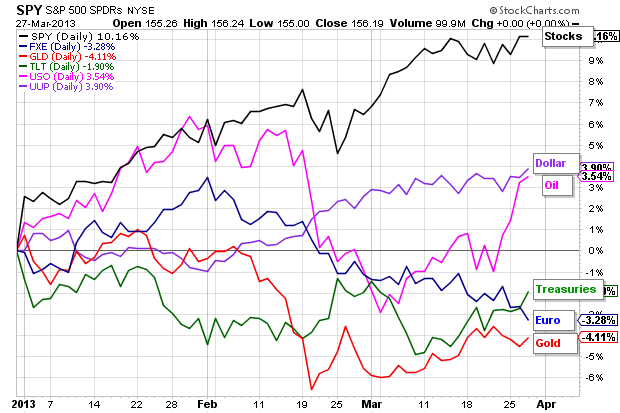
The PerfChart below shows five ETFs representing the inter-market picture. Even though the S&P 500 ETF (SPY) and the US Oil Fund (USO) are up over the past month. notice that the 20+ Year T-Bond ETF (TLT) is up a lot more. Treasuries are showing relative strength and...
READ MORE
MEMBERS ONLY
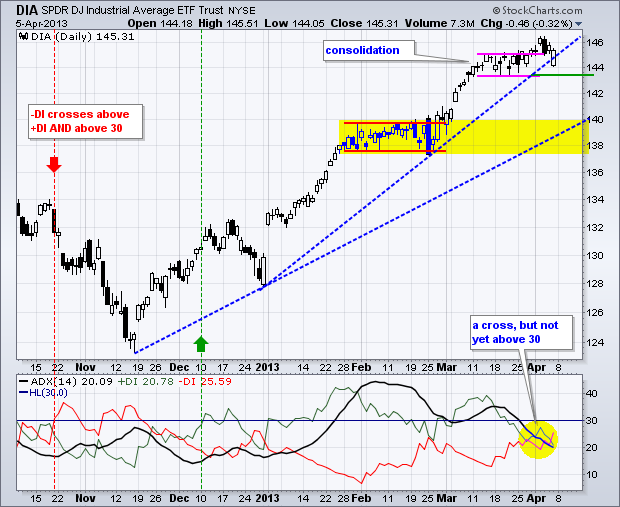
DIA Tests Support as Directional Indicators Converge
by Arthur Hill,
Chief Technical Strategist, TrendInvestorPro.com
The Directional Movement Indicators have equalized as trading turns flat for the Dow SPDR (DIA), but the overall trend remains up as the ETF tests its first support zone. Let's look at support first. DIA hit 144 on March 11th and then traded flat the last few weeks...
READ MORE
MEMBERS ONLY
Materials and Energy SPDRs are the First Sectors to Turn Negative
by Arthur Hill,
Chief Technical Strategist, TrendInvestorPro.com
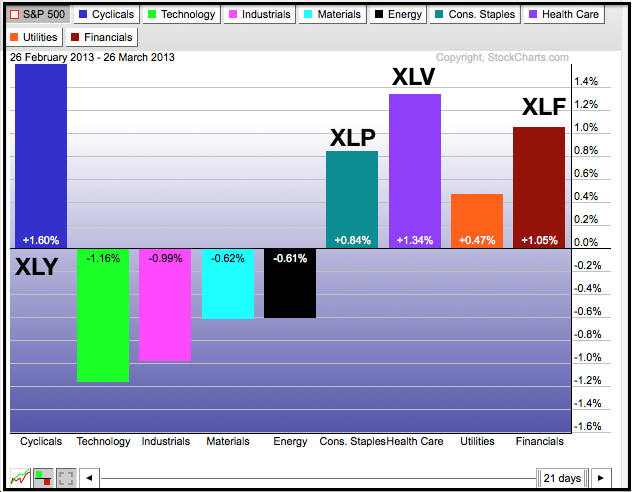
With a hard hit this week, the Energy SPDR (XLE) and the Materials SPDR (XLB) are now down month-to-date. In contrast, the S&P 500 and other seven sectors are still up since March 1st. The technology, industrials and finance sectors are, however, underperforming because they are up less...
READ MORE
MEMBERS ONLY
Utilities Show Least Red on Market Carpet
by Arthur Hill,
Chief Technical Strategist, TrendInvestorPro.com
The market carpet was mostly red on Wednesday with pockets of deep red in the finance and energy sectors. The utilities sector held up the best as the average stock fell 30 cents. There were some isolated pockets of strength in the consumer discretionary as ANF and KSS bucked the...
READ MORE
MEMBERS ONLY
Charts of Interest: BCR, COH, KLAC, MRK, NUE, SWC, WFM
by Arthur Hill,
Chief Technical Strategist, TrendInvestorPro.com
BCR Forms Bull Flag after Advance. Group Pressure Weighs as
NUE Breaks Support on High Volume.
Plus KLAC, MRK, SWC, WFM
This commentary and charts-of-interest are designed to stimulate thinking. This analysis is
not a recommendation to buy, sell, hold or sell short any security (stock ETF or otherwise).
We...
READ MORE
MEMBERS ONLY
Markets Splits as DIA Gains and IWM Loses
by Arthur Hill,
Chief Technical Strategist, TrendInvestorPro.com
It was a rather strange day in the stock market. The Russell 2000 ETF (IWM) fell by 1.34%, but the Dow SPDR (DIA) edged higher with a .02% gain. Defensive stocks led the Dow higher with nice gains in JNJ, MRK and UNH from healthcare, T from Telecom and...
READ MORE
MEMBERS ONLY
IWM Diverges from QQQ and SPY as Small-Caps Underperform
by Arthur Hill,
Chief Technical Strategist, TrendInvestorPro.com
It was another strange day on Wall Street. DIA, QQQ and SPY closed up on the day and hit new highs for 2013. In contrast, IWM and MDY were hit with selling pressure and failed to confirm. Small-caps and mid-caps were relatively weak for the second day running. Also note...
READ MORE
MEMBERS ONLY
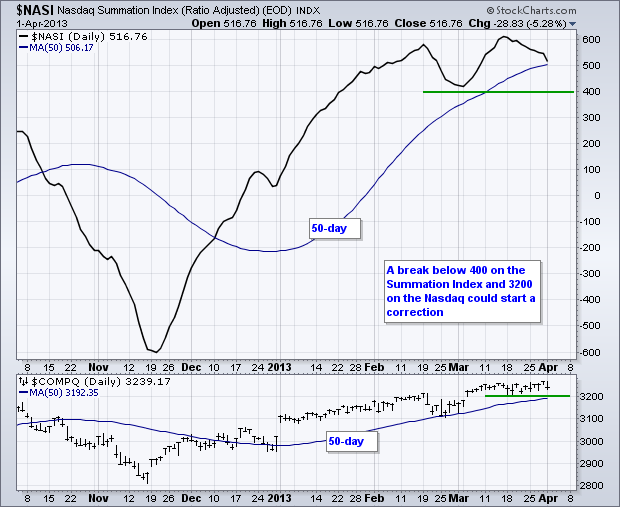
Nasdaq Summation Index Tests 50-day Moving Average
by Arthur Hill,
Chief Technical Strategist, TrendInvestorPro.com
The Nasdaq Summation Index ($NASI) remains in an uptrend overall, but the indicator hit resistance near the February high and turned lower the last few weeks. A break below the 50-day moving average would be negative and a break below the support low would turn this Nasdaq breadth indicator bearish....
READ MORE
MEMBERS ONLY
Telecom iShares Gets Caught in a Moving Average Sandwich
by Arthur Hill,
Chief Technical Strategist, TrendInvestorPro.com
The Telecom iShares (IYZ) is finding support from the rising 200-day moving average and hitting resistance at the 50-day moving average. A move above the March highs would break the 50-day and keep the longer term uptrend alive. Notice that MACD is improving as it inches into positive territory.
Click...
READ MORE
MEMBERS ONLY
Defensive Sectors Power the Market Higher
by Arthur Hill,
Chief Technical Strategist, TrendInvestorPro.com
Another week and another new high for the S&P 500. Even though the weekly gain was small, MDY, QQQ and SPY ended the month at their highs for 2013. IWM lagged a little and finished just below its mid March high. The big trend remains up, but we...
READ MORE
MEMBERS ONLY
Weekly MACD Turns Negative for Copper
by Arthur Hill,
Chief Technical Strategist, TrendInvestorPro.com
It has been a bearish year for Spot Copper ($COPPER) and the recent breakdown points to even lower prices ahead. In addition to MACD turning negative, copper broke triangle support to signal a continuation of the prior decline (2011). The next support zone resides in the 2.80 area.
Click...
READ MORE
MEMBERS ONLY
Sprint, Gamestop and MetroPCS Show Technical Strength
by Arthur Hill,
Chief Technical Strategist, TrendInvestorPro.com
Sprint (S), Gamestop (GMS) and MetroPCS (PCS) are the big technical movers with double digit gains in the StockCharts Technical Rank (SCTR). All three recently broke above resistance on the price charts as well. You can find these top ten lists in the bottom half of our home page.
Click...
READ MORE
MEMBERS ONLY
UUP Breaks Resistance as GLD Edges Towards Resistance
by Arthur Hill,
Chief Technical Strategist, TrendInvestorPro.com
There are plenty of reasons for stocks to move lower - but the stock market is not listening just yet. Stocks are still overbought after a huge rally since mid November and the six month seasonal pattern is set to turn bearish in about a month. Elsewhere, there is concern...
READ MORE
MEMBERS ONLY
Charts of Interest: AMT, ATML, CNX, DVN, FCX, MMM
by Arthur Hill,
Chief Technical Strategist, TrendInvestorPro.com
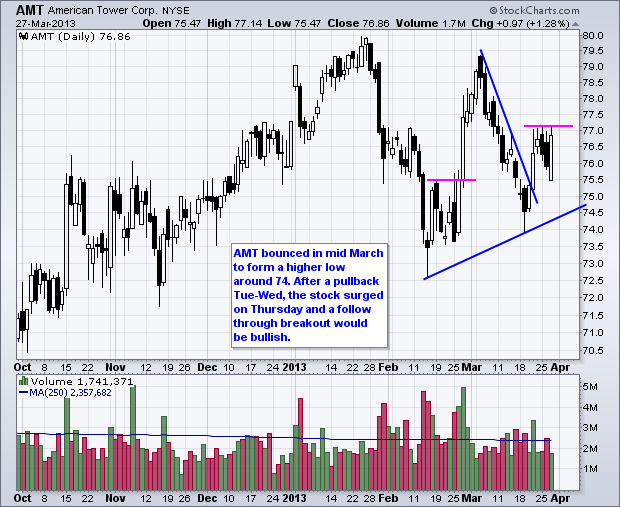
AMT Opens Weak and Closes Strong.
ATML Forms a 3-Month Diamond Consolidation.
Plus CNX, DVN, FCX, MMM
This commentary and charts-of-interest are designed to stimulate thinking. This analysis is
not a recommendation to buy, sell, hold or sell short any security (stock ETF or otherwise).
We all need to think...
READ MORE
MEMBERS ONLY
Nasdaq Most Actives Show more Strength than NYSE Most Actives
by Arthur Hill,
Chief Technical Strategist, TrendInvestorPro.com
It was a rough day for the most active NYSE stocks as eight of ten moved lower. The opposite was true for the Nasdaq as eight moved higher. Old school titans Microsoft (MSFT) and Intel (INTC) joined newbies Facebook (FB) and Groupon (GRPN). You can see this list on our...
READ MORE
MEMBERS ONLY
SPY Breaks Triangle Line - Noose Tightens for GLD
by Arthur Hill,
Chief Technical Strategist, TrendInvestorPro.com
Led by the energy and healthcare sectors, stocks got a bid on Tuesday as the major index ETFs closed modestly higher. Large-caps led the way with the S&P 500 ETF (SPY) advancing .80 percent. All sectors were up, but the four offensive sectors lagged on the day. XLE,...
READ MORE
MEMBERS ONLY
Oil Complex Leads Commodity ETFs Higher
by Arthur Hill,
Chief Technical Strategist, TrendInvestorPro.com
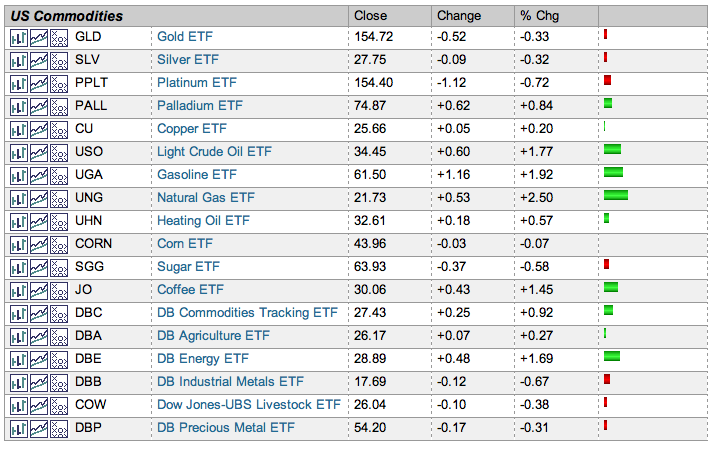
Oil was strong on Tuesday with the US Oil Fund (USO) gaining over 1.5%. Combined with gains in the US Natural Gas Fund (UNG), tbe US Gasoline Fund (UGA) and Heating Oil (UHN), the energy complex is showing strength across the board. The image below comes from the Market...
READ MORE
MEMBERS ONLY
Volatiliy and Consolidations Continue for IWM, SPY and QQQ
by Arthur Hill,
Chief Technical Strategist, TrendInvestorPro.com
It was a topsy-turvy day for the markets. Stocks opened strong on the heels of a Cyprus deal, but weakened as the details sunk in and EU comments suggested that this "unique" deal could be a template for future bailouts. While this news is certainly disconcerting for European...
READ MORE
MEMBERS ONLY
Charts of Interest: AMZN, COF, DOW, GME, MMM, MS
by Arthur Hill,
Chief Technical Strategist, TrendInvestorPro.com
AMZN stalls near support and under performs.
COF shows signs of life with volume.
Plus DOW, GME, MMM, MS
This commentary and charts-of-interest are designed to stimulate thinking. This analysis is
not a recommendation to buy, sell, hold or sell short any security (stock ETF or otherwise).
We all need...
READ MORE
MEMBERS ONLY
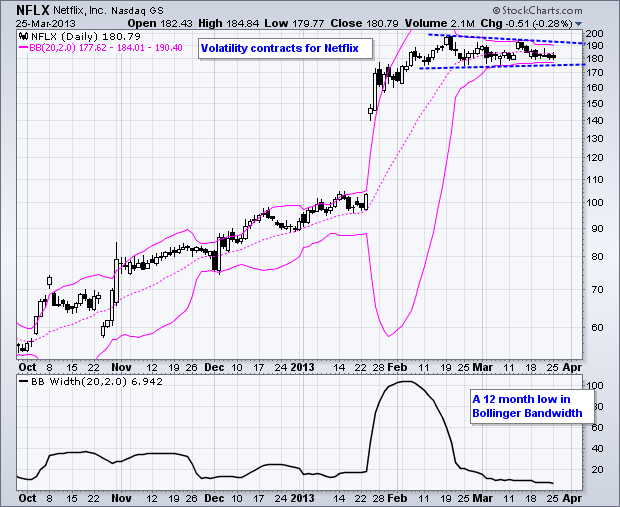
Bollinger Band Width Hits 12 month Low for Netflix
by Arthur Hill,
Chief Technical Strategist, TrendInvestorPro.com
The noose is tightening as indecision reigns supreme for Netflix. After more than doubling, the stock moved into a tight range the last two months. Notice that BandWidth is below 7% as the Bollinger Bands narrow. The range break will deliver the next signal. An upside breakout at 195 would...
READ MORE
MEMBERS ONLY
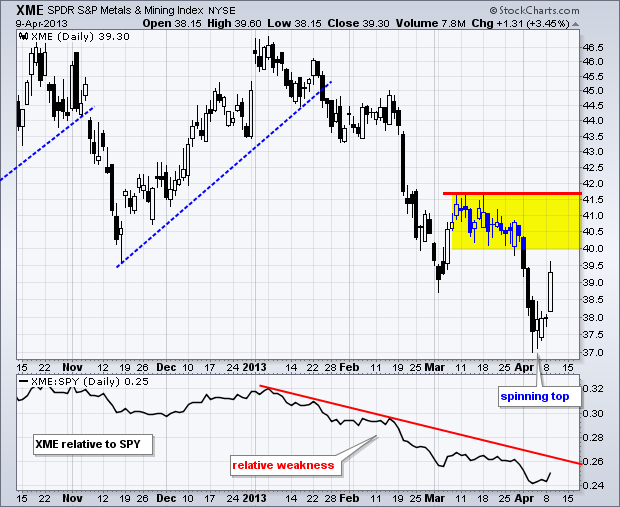
USO Breaks Wedge Resistance - XME Forms Bull Flag
by Arthur Hill,
Chief Technical Strategist, TrendInvestorPro.com
Cyprus has just a few days left - to dominate the news. Yes, once again, last-minute negotiations produced a bailout deal in the 13th hour. What a surprise. Cyprus will officially move to the back burner on Tuesday and we can get back to the real business at hand. US...
READ MORE
MEMBERS ONLY
Quest Diagnostics Consolidates on Intraday P&F Chart
by Arthur Hill,
Chief Technical Strategist, TrendInvestorPro.com
DGX moved sharply lower in January and February, but found support in late February and started a consolidation. The resolution of this consolidation will provide the next directional blue. A upside breakout would be bullish, while a downside break bearish.
Click this image for a live chart...
READ MORE
MEMBERS ONLY
Bulk of the Technical Evidence Remains Bullish
by Arthur Hill,
Chief Technical Strategist, TrendInvestorPro.com
The major index ETFs hit new highs in March, but trading has been relatively flat the last two weeks. Even though the uptrends are firmly in place, flat trading indicates that the market may be moving into corrective mode. As we have seen this year, it is hard to time...
READ MORE
MEMBERS ONLY
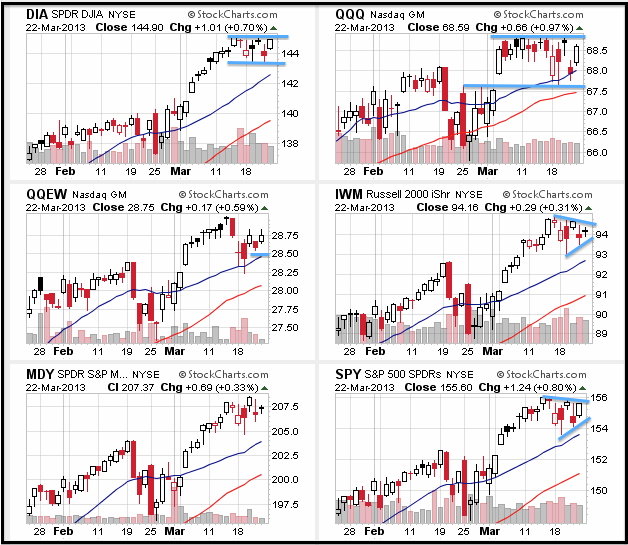
SPY and QQQ Remain Range Bound
by Arthur Hill,
Chief Technical Strategist, TrendInvestorPro.com
The major index ETFs continue to trade within narrow ranges. SPY has been stuck between 154 and 156 the last two weeks and QQQ has bounced between 67.5 and 68.8 since the gap on March 5th. After edging higher on Wednesday, stocks gave it back on Thursday and...
READ MORE
MEMBERS ONLY
Sector Carpet Shows 7 of the 10 Biggest Movers Coming from Tech
by Arthur Hill,
Chief Technical Strategist, TrendInvestorPro.com
Stocks are under pressure on Thursday and the tech sector is also feeling the heat. Even so, three of the five biggest gainers in the S&P 500 come from technology. Electronic Arts, Yahoo and BMC Software are all trading higher.
Click this image for a live chart...
READ MORE
MEMBERS ONLY
XME Forms Falling Flag - USO Bounces off Support
by Arthur Hill,
Chief Technical Strategist, TrendInvestorPro.com
Stocks surged on the open and then moved into a relatively tight trading range. It is positive that the gains held, but lack of follow through suggests that the bulls are getting a little fatigued. The Nasdaq 100 Equal-Weight ETF (QQEW) and the S&P MidCap 400 SPDR (MDY)...
READ MORE
MEMBERS ONLY
Charts of Interest: ANN, APA, FNSR, IACI, LH, S, TE
by Arthur Hill,
Chief Technical Strategist, TrendInvestorPro.com
ANN Forms Flag Near Key Trend Line.
APA Consolidates after Gap.
Plus FNSR, IACI, LH, S, TE
This commentary and charts-of-interest are designed to stimulate thinking. This analysis is
not a recommendation to buy, sell, hold or sell short any security (stock ETF or otherwise).
We all need to think...
READ MORE
MEMBERS ONLY
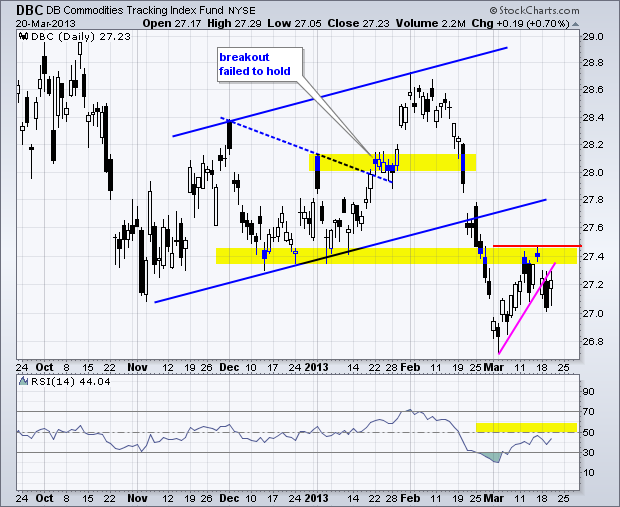
Commodity Index Fund Hits Resistance At Support Break
by Arthur Hill,
Chief Technical Strategist, TrendInvestorPro.com
The Commodity Index Fund (DBC) broke down with a sharp decline in February and then rebounded in March. This rebound was cut short when the ETF hit broken resistance and turned down on Monday-Tuesday. Last week's highs now mark the first resistance level to watch.
Click this image...
READ MORE
MEMBERS ONLY
TLT Holds Breakout to Create Negative Backdrop for Stocks
by Arthur Hill,
Chief Technical Strategist, TrendInvestorPro.com
Let the volatility begin. The situation in Cyprus remains fluid and the news flow is providing a great excuse for volatility. Again, I do not think the situation in Cyprus will affect consumer spending and housing in the US. The Fed finishes its two day meeting today with a policy...
READ MORE
MEMBERS ONLY
Healthcare Sector Leads Year-to-date PerfChart
by Arthur Hill,
Chief Technical Strategist, TrendInvestorPro.com
The Healthcare SPDR (XLV) is the top performing sector in 2013. Yes, XLV is even outperforming the Finance SPDR (XLF). Note that the PerfChart below shows relative performance. Sectors with positive relative performance are up more than the S&P 500. Sectors with negative relative performance are up less...
READ MORE
MEMBERS ONLY
USO Bounces of Short-Term Support - TLT Holds Breakout
by Arthur Hill,
Chief Technical Strategist, TrendInvestorPro.com
Stocks opened weak on news of the Cyprus bail-in plan, but quickly found their footing and bounced. Nevertheless, the major index ETFs ended the day with small losses. The Nasdaq 100 ETF (QQQ) held up well because Apple and Microsoft advanced. Note that tomorrow marks the one year anniversary of...
READ MORE
MEMBERS ONLY
Charts of Interest: CAT, CVC, DANG, NTAP, RAI, TJX
by Arthur Hill,
Chief Technical Strategist, TrendInvestorPro.com
CAT Forms Engulfing Pattern at Key Retracement.
CVC Firms at Long-term Support.
Plus DANG, NTAP, RAI, TJX
This commentary and charts-of-interest are designed to stimulate thinking. This analysis is
not a recommendation to buy, sell, hold or sell short any security (stock ETF or otherwise).
We all need to think...
READ MORE