MEMBERS ONLY
Microsoft Turns Positive and Shows Leadership
by Arthur Hill,
Chief Technical Strategist, TrendInvestorPro.com
Stocks opened weak, but quickly recovered with techs leading the way. Microsoft (MSFT) opened at 27.81, firmed and then surged with a move above 28.2 by midday. This keeps the rising channel alive. Last week's low marks support on the price chart. The February lows mark...
READ MORE
MEMBERS ONLY
SPY and IWM are Poised to Test Channel Support
by Arthur Hill,
Chief Technical Strategist, TrendInvestorPro.com
Look out below. Cyprus is getting the blame for today's move to risk-off. In short, the unprecedented decision to tax bank deposits in an EU country is putting the scare into markets. Cyprus is tiny, but the ramifications are being felt across the world today. Asian and European...
READ MORE
MEMBERS ONLY
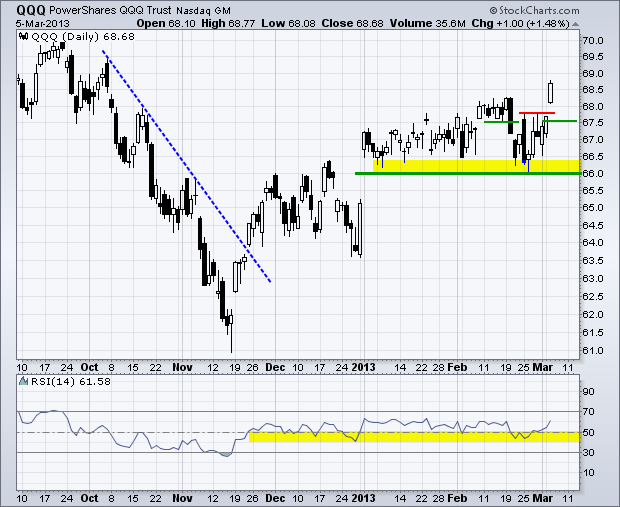
QQQ Forms Bullish Continuation Pattern after Gap
by Arthur Hill,
Chief Technical Strategist, TrendInvestorPro.com
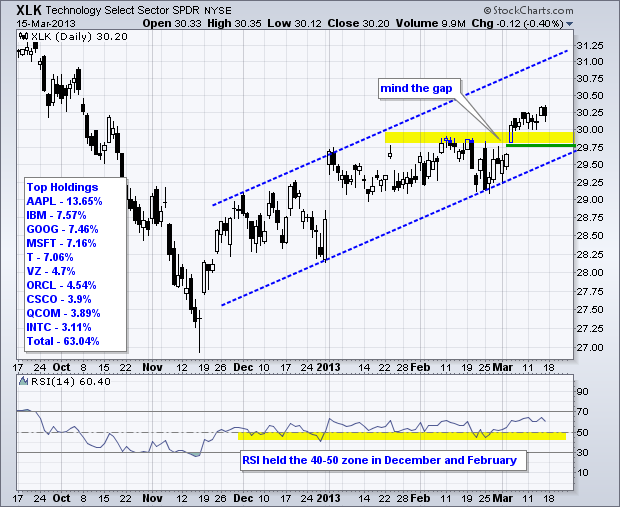
The Nasdaq 100 ETF (QQQ) and the Technology SPDR (XLK) have been underperforming the broader market, but both remain in uptrends since mid November and are holding their March gaps. Relative weakness stems from Apple, which is the biggest component for both ETFs. Microsoft, which accounts for over 7% of...
READ MORE
MEMBERS ONLY
Gold Sports a Small Breakout on the P&F Chart
by Arthur Hill,
Chief Technical Strategist, TrendInvestorPro.com
Spot Gold ($GOLD) forged a Double Top Breakout with a surge this month, but remains well short of a bigger breakout that could have medium-term consequences. Notice that February X-Columns marking resistance at 1615. A break above these would forge a Triple Top Breakout and be medium-term bullish for bullion....
READ MORE
MEMBERS ONLY
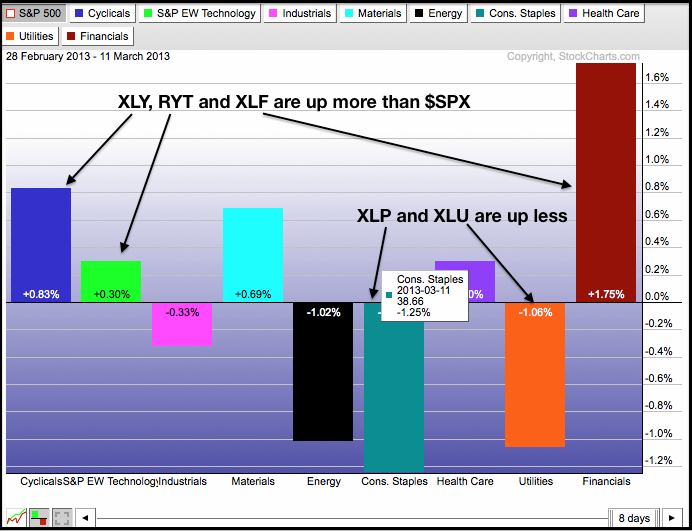
Small-caps Lead as AD Lines and AD Volume Lines Hit New Highs
by Arthur Hill,
Chief Technical Strategist, TrendInvestorPro.com
Stocks extended their March surged this week as the major index ETFs moved to new highs. The AD Lines and AD Volume Lines confirmed these moves with new highs of their own. The Russell 2000 ETF (IWM), the Consumer Discretionary SPDR (XLY) and the Finance SPDR (XLF) are the leaders...
READ MORE
MEMBERS ONLY
ITB Hits New High - GLD Triangulates
by Arthur Hill,
Chief Technical Strategist, TrendInvestorPro.com
Stocks extended their gains on Thursday as the S&P 500 moved within spitting distance of its 2007 high. Small-caps led the way as the Russell 2000 ETF (IWM) surged 1%. All sectors were up, but their gains were muted. The Energy SPDR (XLE) was the only sector SPDR...
READ MORE
MEMBERS ONLY
The StockCharts Technical Rank (SCTR) Surges for Fossil and Ebay
by Arthur Hill,
Chief Technical Strategist, TrendInvestorPro.com
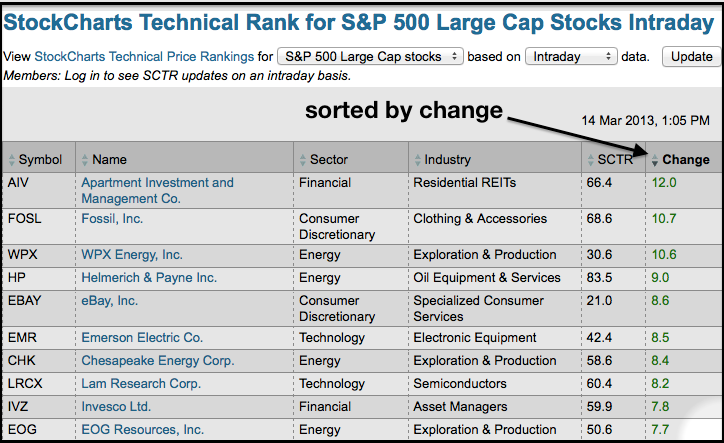
SCTR scores provides a technical ranking for all 500 stocks in the S&P 500. Chartists can view the complete ranking in table format and sort by change to find the biggest movers. Fossil and Ebay are showing big moves today, which means their price charts could warrant a...
READ MORE
MEMBERS ONLY
QQQ Extends Consolidation - USO and TLT Forms Rising Flags
by Arthur Hill,
Chief Technical Strategist, TrendInvestorPro.com
Boosted by a better-than-expected retail sales report, overbought stocks extended their advance with small gains. The major index ETFs were up fractionally with the S&P Small Cap iShares (+.55%) leading the way. The sectors were mixed with the Consumer Discretionary SPDR (XLY), Industrials SPDR (XLI) and Utilities SPDR...
READ MORE
MEMBERS ONLY
Charts of Interest: CA, CAT, FB, GT, MAR, NBR
by Arthur Hill,
Chief Technical Strategist, TrendInvestorPro.com
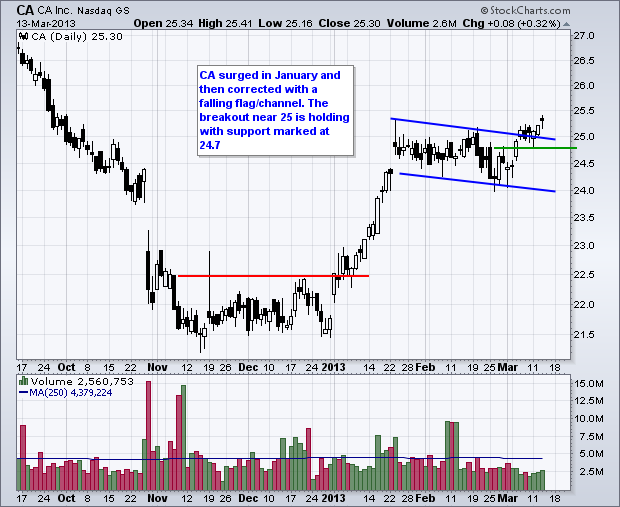
CA Consolidates after Breakout.
CAT Confirms Bearish Continuation Pattern.
Plus FB, GT, MAR, NBR
This commentary and charts-of-interest are designed to stimulate thinking. This analysis is
not a recommendation to buy, sell, hold or sell short any security (stock ETF or otherwise).
We all need to think for ourselves when...
READ MORE
MEMBERS ONLY
Brent Crude ETF Confirms Bearish Continuation Pattern
by Arthur Hill,
Chief Technical Strategist, TrendInvestorPro.com
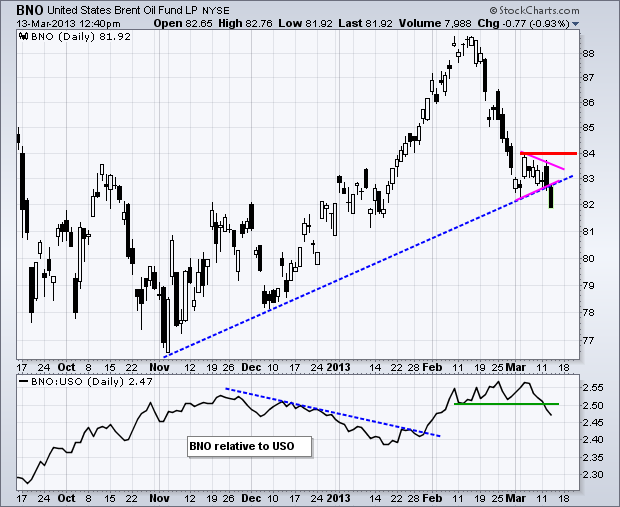
The Brent Crude ETF (BNO) plunged in February and then consolidated with a pennant in early March. This consolidation affirmed support near the trend line extending up from the early November low. With a sharp decline the last two days, BNO broke support to signal a continuation lower. Also notice...
READ MORE
MEMBERS ONLY
ITB Turns Back at Resistance - GLD Breaks Bollinger Band
by Arthur Hill,
Chief Technical Strategist, TrendInvestorPro.com
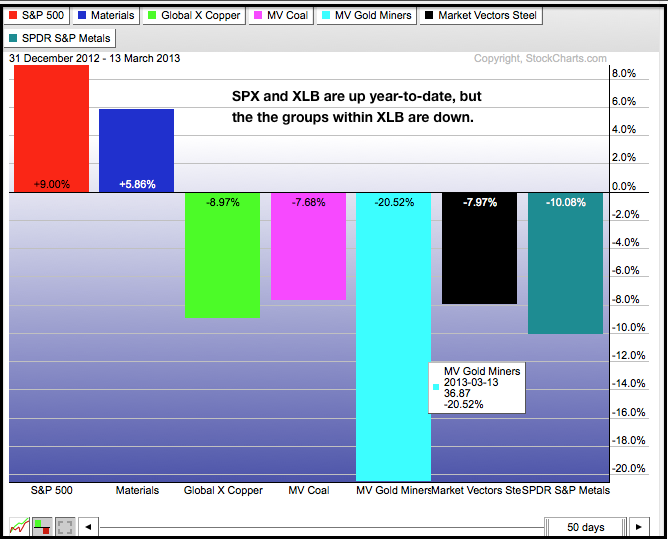
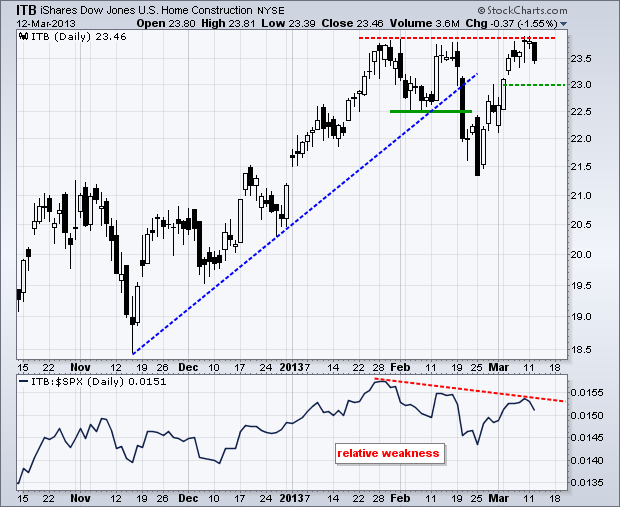
Stocks took a breather on Tuesday as the major index ETFs edged lower. The declines were small, very small. The sectors were mixed with the Basic Materials SPDR (XLB), Energy SPDR (XLE) and Healthcare SPDR (XLV) bucking the market and scoring small gains. XLV hit a new high as Merck...
READ MORE
MEMBERS ONLY
Nasdaq 100 Sets Support with Four Bounces on P&F Chart
by Arthur Hill,
Chief Technical Strategist, TrendInvestorPro.com
Point & Figure charts are great for identifying support and resistance levels. The chart below shows the Nasdaq 100 ($NDX) bouncing off the 2790 level four times in the past week as a consolidation takes shape. The bulls have a clear edge as long as this level holds. Note that...
READ MORE
MEMBERS ONLY
Bollinger Bands Narrow on GLD - USO Hits Resistance
by Arthur Hill,
Chief Technical Strategist, TrendInvestorPro.com
Stocks started the day weak with some selling pressure on the open, but quickly firmed as the major index ETFs worked their way higher the rest of the day. SPY and MDY closed near their highs for the day, which also happen to be 52-week highs. On a percentage basis,...
READ MORE
MEMBERS ONLY
Charts of Interest: ALTR, AMCC, KSS, MRK, RDC
by Arthur Hill,
Chief Technical Strategist, TrendInvestorPro.com
ALTR Consolidates near Trend Line Support.
AMCC Bounces off Key Retracement.
KSS, MRK and RDC
This commentary and charts-of-interest are designed to stimulate thinking. This analysis is
not a recommendation to buy, sell, hold or sell short any security (stock ETF or otherwise).
We all need to think for ourselves...
READ MORE
MEMBERS ONLY
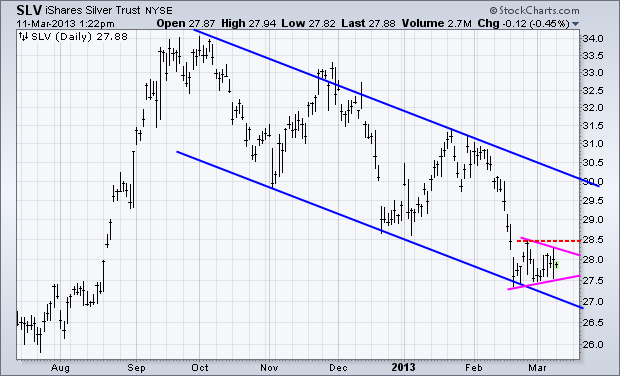
Silver Trust Consolidates at Channel Trend Line
by Arthur Hill,
Chief Technical Strategist, TrendInvestorPro.com
The Silver Trust (SLV) has been working its way lower since early October with a falling channel taking shape. After plunging in February, the ETF firmed near the lower trend line with a pennant. A break below 27.50 would signal a continuation lower, while a break above 28.50...
READ MORE
MEMBERS ONLY
XRT Hits New High - USO Bounces and Ignores Dollar
by Arthur Hill,
Chief Technical Strategist, TrendInvestorPro.com
With a better-than-expected jobs report, stocks extended their gains on Friday and Treasuries dropped sharply. The S&P 500 ETF (SPY) hit another new high, while the 20+ Year T-Bond ETF (TLT) closed at its lowest level since May 2012. Stocks are as overbought as Treasuries are oversold, but...
READ MORE
MEMBERS ONLY
Bank of America Forms Bearish Candlestick Pattern at Interesting Level
by Arthur Hill,
Chief Technical Strategist, TrendInvestorPro.com
With a strong open and sharp move lower, Bank of America (BAC) is gracing the intraday candlestick scan with a dark cloud as we head into the close on Friday. Note that this bearish reversal pattern is taking shape near resistance from the prior highs. Also notice that a broadening...
READ MORE
MEMBERS ONLY
AD Lines and AD Volume Lines Hit New Highs
by Arthur Hill,
Chief Technical Strategist, TrendInvestorPro.com
With a massive eight day surge, the major index ETFs moved to new highs and the offensive sectors got back in gear. The AD Lines and AD Volume Lines also moved to new highs, and Net New Highs expanded once again. New highs are bullish, but the size of this...
READ MORE
MEMBERS ONLY
IWM Makes it Eight Days Straight - GLD Extends Consolidation
by Arthur Hill,
Chief Technical Strategist, TrendInvestorPro.com
Stocks continued on their merry Thursday with the Russell 2000 ETF (IWM) leading the way (+.61%). Note that IMW is up eight days straight. The S&P 500 ETF (SPY) is trading at its highest level of the year as the market went from short-term oversold to short-term overbought...
READ MORE
MEMBERS ONLY
March Madness Comes Early as the S&P 500 Breaks Out on P&F Chart
by Arthur Hill,
Chief Technical Strategist, TrendInvestorPro.com
60-minute P&F charts provide a nice medium-term perspective on broad market movements. This S&P 500 chart is based on 5-points per box and a 3-box reversal. Notice that it extends back to June and shows three big price swings. After the January surge, $SPX consolidated in...
READ MORE
MEMBERS ONLY
IWM Forms Doji Near February Highs - SPY Has NR7 Day
by Arthur Hill,
Chief Technical Strategist, TrendInvestorPro.com
After big moves on Tuesday, stocks took a breather on Wednesday as the major index ETFs consolidated. The Dow SPDR (DIA) edged higher, while the Nasdaq 100 ETF (QQQ) edged lower. The sectors were also mixed with the biggest moves coming from the Materials SPDR (+88%) and the Finance SPDR...
READ MORE
MEMBERS ONLY
Charts of Interest: ANF, BSBR, BRCM, DNDN, HST
by Arthur Hill,
Chief Technical Strategist, TrendInvestorPro.com
ANF Bounces off Support with Rising Wedge.
BRBR Breaks Resistance with Surging Volume.
Plus BRCM, DNDN, HSL
This commentary and charts-of-interest are designed to stimulate thinking. This analysis is
not a recommendation to buy, sell, hold or sell short any security (stock ETF or otherwise).
We all need to think...
READ MORE
MEMBERS ONLY
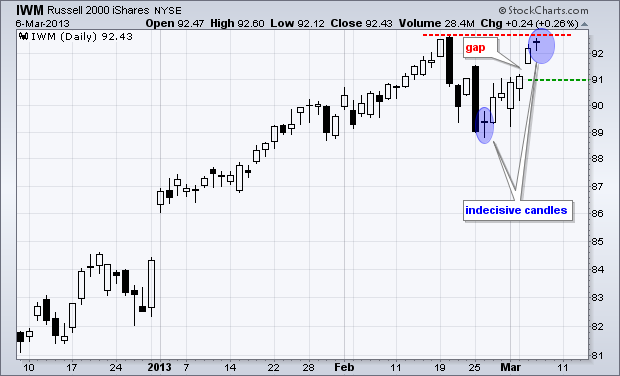
Russell 2000 ETF Turns Indecisive At February High
by Arthur Hill,
Chief Technical Strategist, TrendInvestorPro.com
The Russell 2000 ETF (IWM) is up seven days straight and is now trading near potential resistance from the February high. Notice that an indecisive doji formed on Wednesday. A doji and surge above 90 started this seven day rally. A doji and move below 90 would reverse this seven...
READ MORE
MEMBERS ONLY
QQQ Surges to New High for 2013 - TLT Tests Support Zone
by Arthur Hill,
Chief Technical Strategist, TrendInvestorPro.com
Stocks surged out of the gate with big gains in the first 30 minutes. The ISM Services Index beat expectations at 10AM and this kept the bid in stocks for the rest of the day. The major index ETFs finished the day with gains ranging from .90% for the Dow...
READ MORE
MEMBERS ONLY
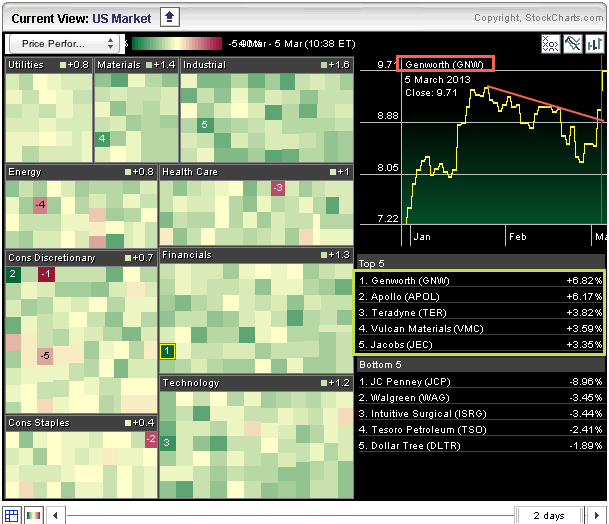
Genworth and Apollo Lead on the Sector Market Carpet
by Arthur Hill,
Chief Technical Strategist, TrendInvestorPro.com
The Sector Market Carpet is showing lots of green as stocks surge with a broad-based rally. All sectors are up with industrials, finance and technology leading the way. Genworth (GNW) is the biggest gainer in the S&P 500, and Apollo (APOL) sports the second largest gain.
Click this...
READ MORE
MEMBERS ONLY
Defensive Sectors, and XLY, Lead with New Highs
by Arthur Hill,
Chief Technical Strategist, TrendInvestorPro.com
You have to give the bulls credit for resilience. Stocks treaded water in the early going and then surged in the afternoon. The major index ETFs closed at or near their highs for the day. On the 60 minute charts, IWM broke falling channel resistance, SPY is challenging neckline resistance...
READ MORE
MEMBERS ONLY
Charts of Interest: ARIA, BBBY, CTSH, CTXS, F, PCS
by Arthur Hill,
Chief Technical Strategist, TrendInvestorPro.com
ARIA Forms Bull Wedge Near Breakout.
CTXS Bounces off Gap Support Zone.
Plus BBBY, CTXS, F, PCS
This commentary and charts-of-interest are designed to stimulate thinking. This analysis is
not a recommendation to buy, sell, hold or sell short any security (stock ETF or otherwise).
We all need to think...
READ MORE
MEMBERS ONLY
Delta and UAL Lead Airline ETF to another Breakout
by Arthur Hill,
Chief Technical Strategist, TrendInvestorPro.com
The Guggenheim Airline ETF (FAA) continues to lead the transports with another big move. Note that Delta (DAL) and United Continental Broke consolidations today. AMR has a falling wedge working and could be next.
Click this image for a live chart...
READ MORE
MEMBERS ONLY
Small-Caps Underperform for a Week - SPY Momentum Turns
by Arthur Hill,
Chief Technical Strategist, TrendInvestorPro.com
On a closing basis, the Dow SPDR (DIA) closed the week at its highest level in years. Even though Friday's intraday high did not exceed Thursday's intraday high, Friday's close was significant for DIA and the Dow Industrials. Or was it? Of the five...
READ MORE
MEMBERS ONLY
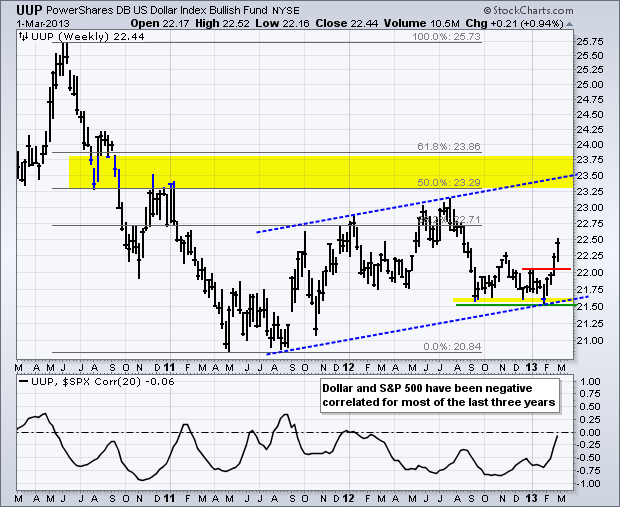
Dollar Breakout Could Foreshadow a Return to Risk-Off
by Arthur Hill,
Chief Technical Strategist, TrendInvestorPro.com
The Dollar Bullish ETF (UUP) extended its advance with a break above the mid November high this week and a fresh six month high. UUP is at levels not seen since August 2012 and this surge could weigh on stocks because the Dollar and stock market have been negatively correlated...
READ MORE
MEMBERS ONLY
Market Vectors Semiconductor ETF Forms Small Rising Wedge
by Arthur Hill,
Chief Technical Strategist, TrendInvestorPro.com
After a sharp decline last week, the Market Vectors Semiconductor ETF (SMH) formed with a small rising wedge the last six days. These are typically bearish continuation pataterns and a break below 34.5 would signal a continuation lower. The indicator window shows the KST momentum oscillator moving below its...
READ MORE
MEMBERS ONLY
Defensive Sectors Outperform as SPY Momentum Wanes
by Arthur Hill,
Chief Technical Strategist, TrendInvestorPro.com
The majority of indicators remain bullish, but offensive sector performance got a downtrend. The technology and consumer discretionary sectors underperformed in February, but the finance and industrials sectors outperformed. In addition, note that the defensive sectors outperformed in February. This combination points to risk-aversion in the stock market. The SPY...
READ MORE
MEMBERS ONLY
QQQ and IWM Turn Back at Resistance
by Arthur Hill,
Chief Technical Strategist, TrendInvestorPro.com
Stocks were strong in the first half of the day, but sold off in the second half, especially in the last hour. The Dow came within 15 points of its all time high and then fell over 90 points with the afternoon sell off. The senior average closed near its...
READ MORE
MEMBERS ONLY
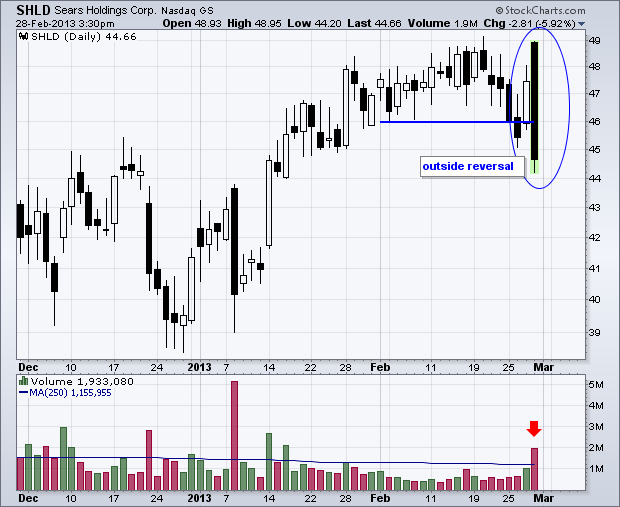
Sears Holdings Traces out Huge Outside Reversal Day
by Arthur Hill,
Chief Technical Strategist, TrendInvestorPro.com
Sears Holdings (SHLD) started the day strong, but sold off hard to form an outside reversal day. In fact, today's price action encompassed the high-low range of the last five days. This reversal also occurred on high volume to further reinforce resistance at 49.
Click this image for...
READ MORE
MEMBERS ONLY
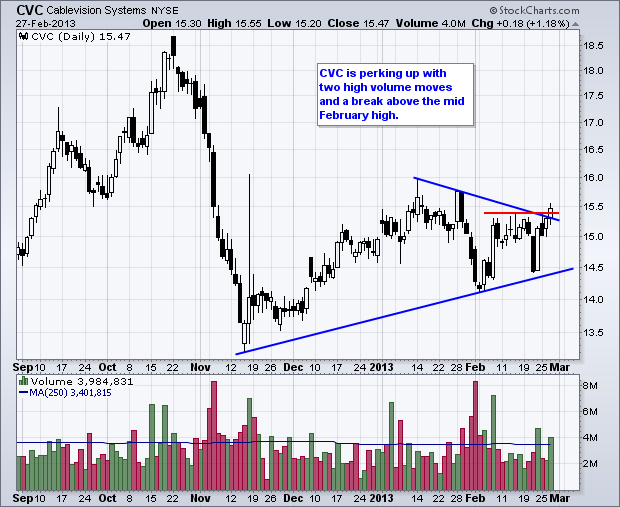
Charts of Interest: CVC, CY, IBM, USB, VRTX
by Arthur Hill,
Chief Technical Strategist, TrendInvestorPro.com
IBM Breaks Wedge Resistance with Good Volume.
VRTX Surges off Support with High Volume.
Plus CVC, CY, USB
This commentary and charts-of-interest are designed to stimulate thinking. This analysis is
not a recommendation to buy, sell, hold or sell short any security (stock ETF or otherwise).
We all need to...
READ MORE
MEMBERS ONLY
DIA Leads with a New High, but IWM and SPY Fall Short
by Arthur Hill,
Chief Technical Strategist, TrendInvestorPro.com
The Dow led the market on Wednesday with a surge above 14000. Despite some sizable moves in the major index ETFs, only the Dow SPDR (DIA) cleared its prior highs and closed at its highest level for the month. Note that SPY, RSP, MDY, IWM and QQQ have yet to...
READ MORE
MEMBERS ONLY
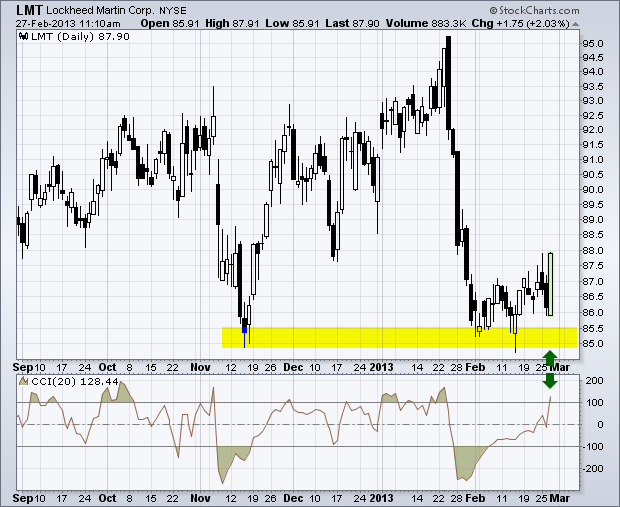
Lockheed Martin Crosses the Bullish CCI Scan
by Arthur Hill,
Chief Technical Strategist, TrendInvestorPro.com
Big defense contractors got slammed in late January as the market priced in a worst-case sequester scenario in about seven trading days. LMT firmed after this sharp decline and then surged with a long hollow candlestick on Wednesday. This move was strong enough to push CCI above 100 and trigger...
READ MORE
MEMBERS ONLY
IWM Firms with Doji - TLT Holds Breakout
by Arthur Hill,
Chief Technical Strategist, TrendInvestorPro.com
Stocks were quite oversold after Monday's big plunge and managed to bounce on Tuesday. Even though the market was ripe for this bounce, there were a few fundamental factors contributing to the rebound. Bernanke brought his doves to capital hill, the Home Construction iShares (ITB) surged almost 4%...
READ MORE
MEMBERS ONLY
Natural Gas Surges off Key Retracement
by Arthur Hill,
Chief Technical Strategist, TrendInvestorPro.com
Don't look now, but Natural Gas ($NATGAS) held support near the 62% retracement and broken resistance near 3.10 this year. $NATGAS bounced twice off this level with the second surge sending it above 3.40 this week. The US Natural Gas Fund (UNG) also held support from...
READ MORE
MEMBERS ONLY
Charts of Interest: CVX, DLTR, FISV, FLEX, HST, SKS, SNA, TIF
by Arthur Hill,
Chief Technical Strategist, TrendInvestorPro.com
CVX Forms Big Bearish Engulfing at Resistance.
DLTR Bases with Large Triangle
Plus FISV, FLEX, HST, SKS, SNA, TIF
This commentary and charts-of-interest are designed to stimulate thinking. This analysis is
not a recommendation to buy, sell, hold or sell short any security (stock ETF or otherwise).
We all need...
READ MORE