MEMBERS ONLY
Bullish Breadth Thrusts in 5 of the 6 Big Sectors
by Arthur Hill,
Chief Technical Strategist, TrendInvestorPro.com
There are 11 sectors in the S&P 500, but the big six are the only ones we need to be concerned with when making a broad market assessment. The big six account for a whopping 82.5% of the S&P 500, which leaves the other 5...
READ MORE
MEMBERS ONLY
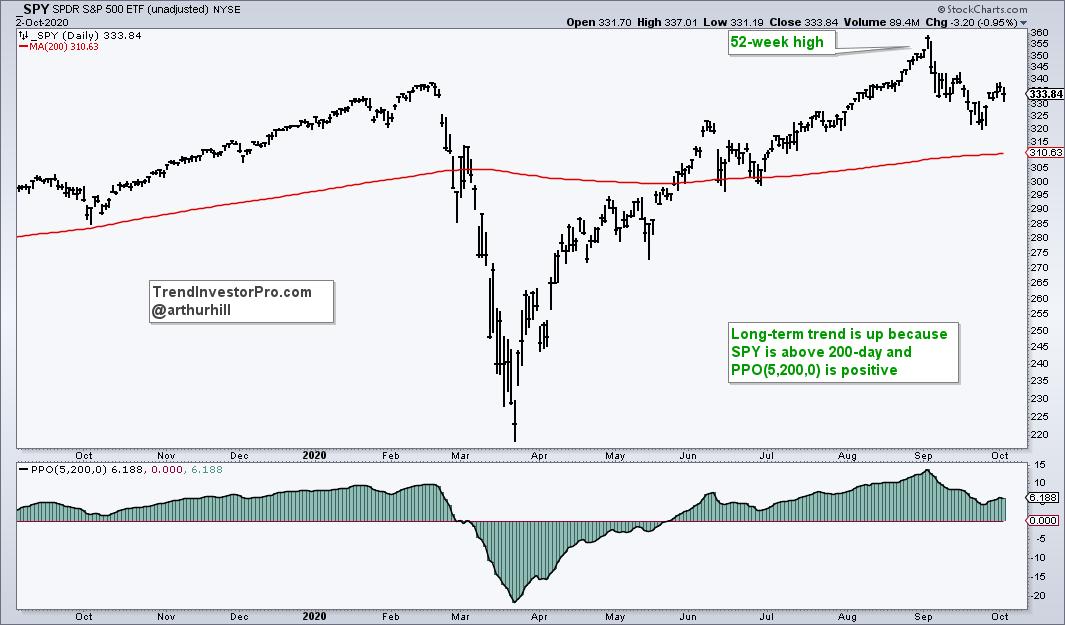
Mind the Gap in SPY
by Arthur Hill,
Chief Technical Strategist, TrendInvestorPro.com
The S&P 500 SPDR (SPY) gapped up on Monday and broke out of a classic correction pattern. The breakout is bullish, but the coast is not entirely clear. Here's what to watch going forward.
First, the long-term trend is up as SPY hit a new high...
READ MORE
MEMBERS ONLY
2 Equity ETFs Holding Up Well in September
by Arthur Hill,
Chief Technical Strategist, TrendInvestorPro.com
The S&P 500 SPDR is down around 6% this month and QQQ is down around 8%. These two hit new highs on September 2nd, plunged the next three trading days and then worked their way lower. Both are below their 50-day moving averages for the first time since...
READ MORE
MEMBERS ONLY
The Setup to Anticipate the Breakout - XME Example
by Arthur Hill,
Chief Technical Strategist, TrendInvestorPro.com
Chartists are often faced with a choice: wait for the breakout or anticipate using a mean-reversion setup. The Metals & Mining SPDR (XME) broke out of a bullish consolidation this week and the breakout signals a continuation of its long-term uptrend. Chartists keying off the mean-reversion setup could have anticipated...
READ MORE
MEMBERS ONLY
Silver Crosses Lose Some Shine
by Arthur Hill,
Chief Technical Strategist, TrendInvestorPro.com
There are fewer silver crosses in the major stock indexes and this shows less participation during the last leg higher, a situation that could foreshadow a correction.
A silver cross occurs when the 20-day EMA crosses above the 50-day EMA. DecisionPoint took this concept on step further and developed breadth...
READ MORE
MEMBERS ONLY
SPY: You Spin Me Right Round
by Arthur Hill,
Chief Technical Strategist, TrendInvestorPro.com
The S&P 500 SPDR (SPY) fell over 2% this week for the biggest weekly decline since June. The long-term trend is still up because SPY remains well above the rising 40-week SMA. However, a big Spinning Top candlestick formed last week and a volatility indicator ticked higher. Spinning...
READ MORE
MEMBERS ONLY
A Healthcare Stock Poised to End its Correction
by Arthur Hill,
Chief Technical Strategist, TrendInvestorPro.com
The Bollinger Band squeeze signals a volatility contraction that can lead to a volatility expansion. But which way? For directional clues, we need to analyze price action and other indicators. Henry Schein caught my eye because the stock has a Bollinger Band squeeze, a bullish chart pattern, an uptrend and...
READ MORE
MEMBERS ONLY
Trend Composite Turns Fully Bullish for Verizon
by Arthur Hill,
Chief Technical Strategist, TrendInvestorPro.com
Verizon (VZ) participated in the market surge from late March to mid April, but then stumbled with a decline into mid June. This stumble, however, looks like a classic correction and the stock broke out with a strong move over the last six weeks. In addition, the TIP Trend Composite,...
READ MORE
MEMBERS ONLY
New 52-week Highs Underwhelm, But Outpace New Lows
by Arthur Hill,
Chief Technical Strategist, TrendInvestorPro.com
The total number of new highs in the S&P 500, S&P MidCap 400 and S&P SmallCap 600 continues to underwhelm. Even so, new highs are still outpacing new lows and this is enough to keep the uptrend since late March going.
The first chart...
READ MORE
MEMBERS ONLY
Four Stocks Poised to Drive Healthcare Higher
by Arthur Hill,
Chief Technical Strategist, TrendInvestorPro.com
The Healthcare SPDR (XLV) is one of the strongest sectors in 2020. Even though it does not sport the biggest gain, XLV recorded a new high in July and some 80% of its components are above their 200-day EMAs. The new high points to a long-term uptrend and upside leadership,...
READ MORE
MEMBERS ONLY
RSI for Trend-Following and Momentum Strategies - Apple Example
by Arthur Hill,
Chief Technical Strategist, TrendInvestorPro.com
RSI is widely used as a momentum oscillator to identify overbought and oversold levels. A dive into the formula, however, reveals that RSI is quite well equipped for trend-following strategies. It can even be used to rank ETFs and stocks to find those with the strongest momentum.
The strategy basically...
READ MORE
MEMBERS ONLY
QQQ Goes on a Bender
by Arthur Hill,
Chief Technical Strategist, TrendInvestorPro.com
QQQ can do little wrong here in 2020, but the ETF is ripe for a corrective period as it becomes the most extended since 1999. Current conditions, while frothy, are not quite the same as they were in 2000 so I do not expect another crash. For those of us...
READ MORE
MEMBERS ONLY
A BB Breakout or the Dreaded Head Fake?
by Arthur Hill,
Chief Technical Strategist, TrendInvestorPro.com
There were a number of Bollinger Band squeeze plays over the last two weeks and also a number of breakouts. These breakouts are bullish until proven otherwise, but chartists should also be aware of the head fake. In his book, Bollinger on Bollinger Bands, John Bollinger puts it as follows:...
READ MORE
MEMBERS ONLY
Measuring the Balance of Power in the Equal-weight Sectors
by Arthur Hill,
Chief Technical Strategist, TrendInvestorPro.com
The 200-day SMA is a long-term trend indicator that chartists can use across the equal-weight sectors to measure the balance of power in the broader market. The more sectors trading above their 200-day SMAs, the more bullish the market. The more sectors trading below their 200-day SMAs, the more bearish...
READ MORE
MEMBERS ONLY
Stocks and Treasuries: The Yin and Yang of the Markets
by Arthur Hill,
Chief Technical Strategist, TrendInvestorPro.com
The 20+ Yr Treasury Bond ETF (TLT) retreated as stocks advanced from mid April to early June and then popped as stocks dropped this week. Bonds are the natural alternative to stocks and TLT appears to be forming a classic bullish continuation pattern.
Let's first compare performance for...
READ MORE
MEMBERS ONLY
Knowing When to Add Risk and When to Reduce Risk
by Arthur Hill,
Chief Technical Strategist, TrendInvestorPro.com
The S&P 500 is the most widely used benchmark for the US stock market and the 200-day SMA is perhaps the most widely used moving average. These two came together again in late May as the index crossed back above on May 27th. Today we will quantify the...
READ MORE
MEMBERS ONLY
A Bullish Continuation Pattern for a Sector with Strong Breadth
by Arthur Hill,
Chief Technical Strategist, TrendInvestorPro.com
Chartists can separate the leading sectors from the lagging sectors by sorting with various breadth indicators. The 200-day EMA is a long-term trend indicator that can also be used as a breadth indicator. A stock is in an uptrend when above the 200-day EMA and in a downtrend below. The...
READ MORE
MEMBERS ONLY
Quantifying the QQQ Effect on SPY
by Arthur Hill,
Chief Technical Strategist, TrendInvestorPro.com
We all know that many stocks in the Nasdaq 100 ETF (QQQ) are also part of the S&P 500 SPDR (SPY). In addition, it is clear that these QQQ stocks affect the performance of SPY. But how much exactly? Today we will answer that question and compare performance...
READ MORE
MEMBERS ONLY
Timing the S&P 500 Using the Bullish Percent Index
by Arthur Hill,
Chief Technical Strategist, TrendInvestorPro.com
StockCharts calculates and publishes the Bullish Percent Indexes for several major indexes and sectors. Just search for the term $BP to find them because all the symbols begin with these three characters. These indicators are not part of my breadth models for broad market timing, but I do follow them,...
READ MORE
MEMBERS ONLY
Strong April Seasonality Gives Way to May and June
by Arthur Hill,
Chief Technical Strategist, TrendInvestorPro.com
When it comes to analysis and trading signals, seasonality is behind price action in the pecking order of importance. In general, seasonal patterns carry most weight when they jibe with the underlying trend. For example, bullish seasonal patterns in an uptrend can provide a tailwind. Nevertheless, price action is still...
READ MORE
MEMBERS ONLY
Putting the Big Bounces into Perspective
by Arthur Hill,
Chief Technical Strategist, TrendInvestorPro.com
Despite a massive advance the last six weeks, the bulk of the evidence indicates that we are still in a bear market environment. The advance off the March low, while impressive on its own, still pales in comparison to the prior decline. The S&P 500 SPDR retraced around...
READ MORE
MEMBERS ONLY
Big Biotechs Make a Big Statement
by Arthur Hill,
Chief Technical Strategist, TrendInvestorPro.com
The two most popular biotech ETFs are leading the market this month and making big statements. Before looking at these two, note that they are quite different. The Biotech ETF (IBB) is dominated by large-cap biotechs with the top ten holdings accounting for over 50%. The Biotech SPDR (XBI), on...
READ MORE
MEMBERS ONLY
A Few Get Back to Positive, but Many Remain Beaten Down
by Arthur Hill,
Chief Technical Strategist, TrendInvestorPro.com
With a surge over the last 18 days, the S&P 500 reclaimed the 50-day moving average for the first time since February 21st. The move is truly remarkable, but the index remains well below the falling 200-day SMA. Moreover, a 28.5% surge in 18 days recovered just...
READ MORE
MEMBERS ONLY
Elevators, Oversold Bounces and Long Recoveries
by Arthur Hill,
Chief Technical Strategist, TrendInvestorPro.com
The S&P 500 went from a historic decline to a historic bounce to an above average drop. This key benchmark fell 33.9% in 23 days, surged 17.55% in three days and then dropped 5.25% the last four days. In fact, the index has experienced nine...
READ MORE
MEMBERS ONLY
Quantifying Leaders and Laggards on this Historic Bounce
by Arthur Hill,
Chief Technical Strategist, TrendInvestorPro.com
Chartists looking to measure relative performance based on retracements can use the Stochastic Oscillator to quantify these bounces. Way back on March 1st, I posted an article showing how Chartists can quantify downside retracements using Williams %R. For upside retracements or bounces that retrace a portion of the prior decline,...
READ MORE
MEMBERS ONLY
High-Low Percent Takes a Tumble - Plus The Essential Breadth Indicator ChartList
by Arthur Hill,
Chief Technical Strategist, TrendInvestorPro.com
The broad market environment is bearish and volatility remains high, even with stock alternatives, such as gold and bonds. This is hardly a conducive environment for trading or investing, but there are alternatives, such as a bear market project. This can be remodeling a room, finally clearing out the garage...
READ MORE
MEMBERS ONLY
Setting Expectations for Post-Crash Price Action
by Arthur Hill,
Chief Technical Strategist, TrendInvestorPro.com
The S&P 500 moved from a 52-week high to a 52-week low with lightening speed over the last three weeks. To capture the sharpness of this decline, I am showing a chart with the 3-week Rate-of-Change in the indicator window. At -18.78%, this is the deepest three...
READ MORE
MEMBERS ONLY
When Bullish Retracement Zones and Support become Questionable
by Arthur Hill,
Chief Technical Strategist, TrendInvestorPro.com
Support levels and bullish retracement zones are questionable, at best, in bear market environments. Why? Because the path of least resistance is down in a bear market. As such, the odds that a support level holds or a bullish retracement zone leads to a reversal are greatly reduced. The odds...
READ MORE
MEMBERS ONLY
Quantifying Retracements to Find Stocks and ETFs that Held Up Relatively Well During the Onslaught
by Arthur Hill,
Chief Technical Strategist, TrendInvestorPro.com
Looking for an indicator to find stocks and ETFs that held up the best last week? Look no further. Today I will show how to use a classic indicator to quantify last week's decline and rank names by their retracements.
In general, stocks bottomed in early October and...
READ MORE
MEMBERS ONLY
Bank ETF Gets a Bounce, but <BR>Falling Yields Could Spoil the Party
by Arthur Hill,
Chief Technical Strategist, TrendInvestorPro.com
After falling for over a year, the Regional Bank ETF (KRE) finally got its mojo back in the fourth quarter of 2019 and broke out to new highs. The ETF then became overextended in mid December and fell back to the 200-day SMA here in February. A potentially bullish setup...
READ MORE
MEMBERS ONLY
Applying the Dow Theory Principle of Confirmation to Measure Sector Participation
by Arthur Hill,
Chief Technical Strategist, TrendInvestorPro.com
Dow Theory applies the principle of confirmation to confirm primary trends. Charles Dow used the Dow Industrials and Dow Transports to confirm the primary trend for the broader market. The primary trend is up, and confirmed, when the Industrials and Transports both exceed their prior highs and record higher highs....
READ MORE
MEMBERS ONLY
Removing the Amazon Effect from XLY - Plus the Mother of All Cup-with-Handle Patterns
by Arthur Hill,
Chief Technical Strategist, TrendInvestorPro.com
Amazon is by far the biggest component in the Consumer Discretionary SPDR and its recent breakout bodes well for the ETF. The new highs in XLY and AMZN this month, however, did not carry over to the Equal-weight Consumer Discretionary ETF (RCD). RCD removes the Amazon effect by treating all...
READ MORE
MEMBERS ONLY
A Bullish Hat-Trick for the Aerospace & Defense ETFs - But One is Seriously Lagging
by Arthur Hill,
Chief Technical Strategist, TrendInvestorPro.com
There are three ETFs covering the defense and aerospace group and all three recorded new highs. Even though these ETFs cover the same industry group and have similar price charts, they are quite different when we look under the hood and one is seriously underperforming the other two.
The Aerospace...
READ MORE
MEMBERS ONLY
Another Triple 90% Down Day - What is it and what does it mean for stocks going forward?
by Arthur Hill,
Chief Technical Strategist, TrendInvestorPro.com
Selling pressure was extremely broad in Friday with all sectors declining and more than ninety percent of stocks in the S&P 500, S&P MidCap 400 and S&P SmallCap 600 declining. While this kind of broad selling pressure creates a short-term oversold condition, it also...
READ MORE
MEMBERS ONLY
S&P 500 Channels 2018 and Opens a Box of Chocolates
by Arthur Hill,
Chief Technical Strategist, TrendInvestorPro.com
Signs of a correction were building for some time and it now appears that the long awaited corrective period is here. The S&P 500, in particular, is following the script from January 2018 quite closely. After a steady advance from October to December, signs of excess started appearing...
READ MORE
MEMBERS ONLY
A Moment of Truth for the Russell 2000 ETF
by Arthur Hill,
Chief Technical Strategist, TrendInvestorPro.com
The Russell 2000 ETF (IWM) broke out of a pennant formation last week and then fell sharply this week. This puts price back in the pennant and near its make or break level.
Flags and pennants are short-term continuation patterns that form after a sharp move. Bullish versions represent the...
READ MORE
MEMBERS ONLY
Despite Recent Underperformance, the Treasury Bond ETF (TLT) is Starting to Look Interesting
by Arthur Hill,
Chief Technical Strategist, TrendInvestorPro.com
The stock market started its latest run to infinity (and beyond) in mid August and the 20+ Yr Treasury Bond ETF (TLT) just happened to peak a week or so later. Stocks and bonds were largely on the same page from February to August as both moved higher. Correlation changed...
READ MORE
MEMBERS ONLY
REIT SPDR Holds Key Moving Average as its Biggest Components Spring to Life
by Arthur Hill,
Chief Technical Strategist, TrendInvestorPro.com
Ten of the eleven sector SPDRs are positive over the last three months. The Real Estate SPDR (XLRE) is the only sector sporting a loss (~.75%), but I am not concerned with relative weakness because the price chart looks bullish overall. Note that XLRE was the leading sector in early...
READ MORE
MEMBERS ONLY
Putting Declines into Perspective to Find Opportunities - Plus an Opportunity in the Tech Sector
by Arthur Hill,
Chief Technical Strategist, TrendInvestorPro.com
2019 was quite the year with many stocks moving sharply higher from January to July-August. In particular, several Technology stocks moved higher during this period and then corrected into October. We can see this pattern reflected in the Equal-Weight Technology ETF (RYT) as it advanced over 40% and then corrected...
READ MORE
MEMBERS ONLY
2019: A Year Filled with Distractions
by Arthur Hill,
Chief Technical Strategist, TrendInvestorPro.com
2019 was a year with lots of distractions, and yet the S&P 500 recorded 52-week highs in six of the last nine months. The index surged 17.7% the first four months and recorded its first 52-week high in late April. It then finished strong with a new...
READ MORE