MEMBERS ONLY
SPY Bounces off Short-Term Support - GLD Surges
by Arthur Hill,
Chief Technical Strategist, TrendInvestorPro.com
Stocks rebounded across the board with the hardest hit groups getting the biggest pops. The Nasdaq 100 ETF (QQQ) led the way with a 1.38% bounce. Eight of nine sectors were up with energy leading the way on the heels of a big oversold bounce in crude. The utilities...
READ MORE
MEMBERS ONLY
PC Related Stocks are Having a Tough Time on the PerfChart
by Arthur Hill,
Chief Technical Strategist, TrendInvestorPro.com
The PerfChart below shows three month performance for two chip makers (Intel and AMD), two PC-related companies (Dell and Hewlett Packard) and mister softy (Microsoft). Only Microsoft is up during this period, and just barely. The others are having a really difficult time, even with the S&P...
READ MORE
MEMBERS ONLY
SPY Tests Short-Term Support as IWM Breaks Support
by Arthur Hill,
Chief Technical Strategist, TrendInvestorPro.com
Stocks continued lower with modest losses in the major index ETFs. The Nasdaq 100 ETF (QQQ) led the way lower with a .81% decline. Eight of nine sectors moved lower with energy and technology leading the way. The defensive sectors held up the best with the utilities sector providing the...
READ MORE
MEMBERS ONLY
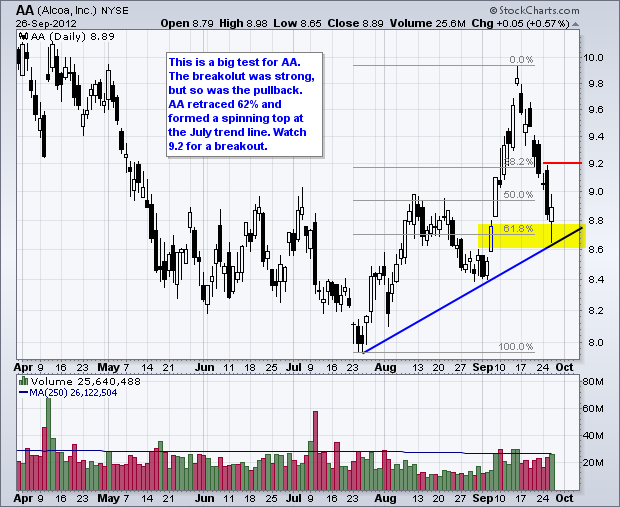
Charts of Interest: AA, AMX, DLTR, MMM, MSFT, NVDA
by Arthur Hill,
Chief Technical Strategist, TrendInvestorPro.com
AA Returns to Breakout for Big Test.
AMX Firms with Good Upside Volume.
Plus DLTR, MMM, MSFT, NVDA
This commentary and charts-of-interest are designed to stimulate thinking. This analysis is not a recommendation to buy, sell, hold or sell short any security (stock ETF or otherwise). We all...
READ MORE
MEMBERS ONLY
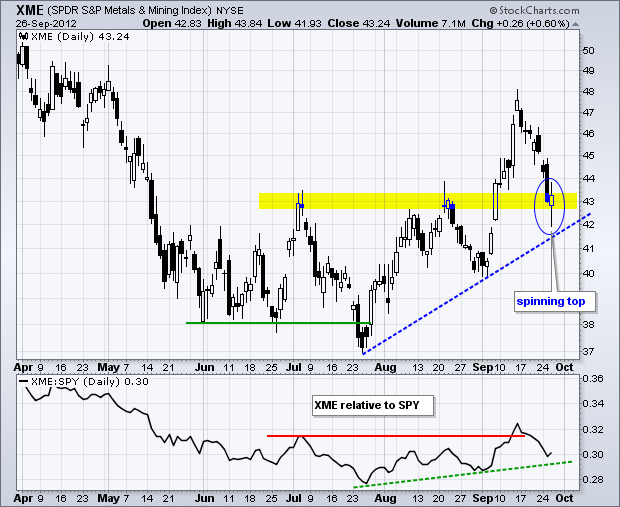
Metals & Mining SPDR Forms Spinning Top At Broken Resistance
by Arthur Hill,
Chief Technical Strategist, TrendInvestorPro.com
The battle for the breakout is on as the Metals & Mining SPDR (XME) declined to broken resistance and formed a big spinning top. These candlesticks show serious indecision. XME broke resistance in early September and is now trying to decide if this breakout is worth holding or not. Watch...
READ MORE
MEMBERS ONLY
IWM and QQQ Start to Lead Lower - TLT Extends Uptrend
by Arthur Hill,
Chief Technical Strategist, TrendInvestorPro.com
Stocks ended their meandering ways with some downside direction on Tuesday. The Nasdaq 100 ETF (QQQ) and Russell 2000 ETF (IWM) led the way lower with losses around 1.4%. All nine sectors were lower with the Technology SPDR (XLK) and Finance SPDR (XLF) leading the way. The defensive sectors...
READ MORE
MEMBERS ONLY
Gold Miners Junior forms Gap-Doji-Gap Reversal
by Arthur Hill,
Chief Technical Strategist, TrendInvestorPro.com
After a big run from late July to mid September, the Junior Gold Miners ETF (GDXJ) formed a bearish candlestick reversal over the last 4-5 days. First, there was the gap and doji. This signaled sudden indecision after a big jump. Second, selling pressure followed this indecision as the...
READ MORE
MEMBERS ONLY
QQQ Gaps Down - TLT Holds Short-Term Uptrend
by Arthur Hill,
Chief Technical Strategist, TrendInvestorPro.com
Stocks continued their meandering ways on Monday. There is, however, a slight downward slant in this meandering. IWM and SPY peaked on 14-Sept and worked their way lower the last six days. QQQ, which marches to the Apple beat, is trading below the 14-Sep levels, but has been...
READ MORE
MEMBERS ONLY
Charts: ADM, APOL, CMS, CNL, TE, TEVA, TYC, WCRX, XRAY
by Arthur Hill,
Chief Technical Strategist, TrendInvestorPro.com
AMAT Breaks Support with Gap.
TE Surges on Good Volume.
Plus ADM, APOL, CMS, CNL, TEVA, TYC, WCRX, XRAY
This commentary and charts-of-interest are designed to stimulate thinking. This analysis is not a recommendation to buy, sell, hold or sell short any security (stock ETF or otherwise). We...
READ MORE
MEMBERS ONLY
SPY Forms Bearish Meeting Lines Candlestick Pattern
by Arthur Hill,
Chief Technical Strategist, TrendInvestorPro.com
The S&P 500 ETF (SPY) formed a rare bearish candlestick reversal pattern over the last two days. The Bearish Meeting Lines pattern forms with a white candlestick and a black candlestick that have relatively equal closes. In particular, the black candlestick reflects a strong open and a weak...
READ MORE
MEMBERS ONLY
SPY Extends Stall as USO Breaks Down
by Arthur Hill,
Chief Technical Strategist, TrendInvestorPro.com
Last week was the week that was not. Stocks surged on Thursday, September 13th, and then stalled the next six days. This indecisive period started as SPY formed a shooting start on Friday, September 14th. The ETF formed small candlesticks on Monday, Tuesday and Wednesday. Thursday's open was...
READ MORE
MEMBERS ONLY
Dow Transports Tests Major Support Level and Dow Theory
by Arthur Hill,
Chief Technical Strategist, TrendInvestorPro.com
The Dow Transports surged to resistance last week and plunged to support this week. Overall, the junior Average has been stuck in a trading range since mid June with support at 4900 and resistance around 5250. A break below 4900 would be clearly bearish for the Average and negative for...
READ MORE
MEMBERS ONLY
Indicator Summary Remains Positive as Stocks Stall
by Arthur Hill,
Chief Technical Strategist, TrendInvestorPro.com
With new highs last week and flat trading this week, there is no change in the indicator summary. Even though the bulk of the evidence remains bullish, I am concerned with overbought conditions and some extremes starting to appear in the sentiment indicators. The $VIX moved below 15% and the...
READ MORE
MEMBERS ONLY
SMH Breaks Flag Support - GLD Forms Pennant
by Arthur Hill,
Chief Technical Strategist, TrendInvestorPro.com
Thursday marked the fourth uneventful day this week as stocks finished mixed yet again. The Dow Industrials SPDR (DIA) and S&P 100 ETF (OEF) edged higher, but the Russell 2000 ETF (IWM) and S&P MidCap SPDR (MDY) closed modestly lower. In fact, we have definitely seen...
READ MORE
MEMBERS ONLY
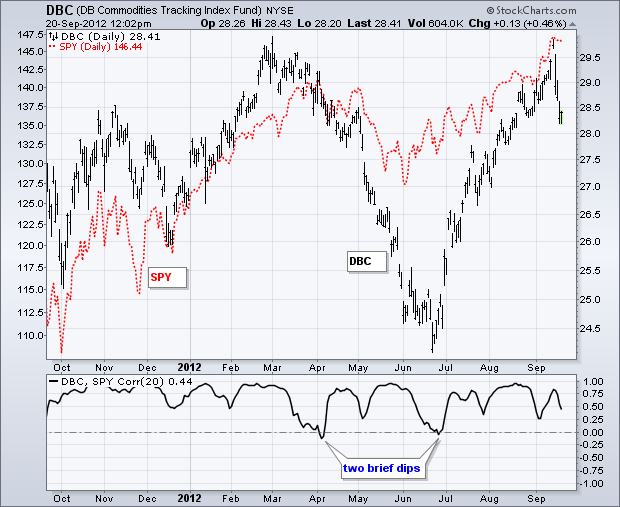
Stocks and Commodities Show Strong Positive Correlation
by Arthur Hill,
Chief Technical Strategist, TrendInvestorPro.com
The S&P 500 ETF (SPY) and the Commodity Index Fund ($DBC) have been positively correlated for almost all of the last 12 months. As the indicator window shows, the Correlation Coefficient (SPY,DBC) dipped into negative territory only twice and spent most of the time above .50. The...
READ MORE
MEMBERS ONLY
SPY Stumbles after Flag Break - USO Breaks Support
by Arthur Hill,
Chief Technical Strategist, TrendInvestorPro.com
Stocks finished the day mixed on Wednesday as indecision extended for the third day running. The Russell 2000 ETF (IWM) edged lower, while the S&P 500 ETF (SPY) closed fractionally higher. The sectors were mixed with six up and three down. The Consumer Discretionary SPDR (XLY) led the...
READ MORE
MEMBERS ONLY
Charts of Interest: BOOM, CIEN, DAN, INTU, NKE
by Arthur Hill,
Chief Technical Strategist, TrendInvestorPro.com
The Noose Narrows for BOOM.
Downside Volume Expands for NKE.
Plus CIEN, DAN, INTU
This commentary and charts-of-interest are designed to stimulate thinking. This analysis is not a recommendation to buy, sell, hold or sell short any security (stock ETF or otherwise). We all need to think for...
READ MORE
MEMBERS ONLY
Oversold XLU Triggers Triple Bottom Breakdown on P&F Chart
by Arthur Hill,
Chief Technical Strategist, TrendInvestorPro.com
The Utilities SPDR (XLU) is by far the weakest of the nine sector SPDRs right now. The P&F chart below uses daily price data and each box is valued at .30%. The ETF broke the Bullish Support Line in August, consolidated and then broke below the prior two...
READ MORE
MEMBERS ONLY
SPY Forms Falling Flag - GLD Consolidates at High Level
by Arthur Hill,
Chief Technical Strategist, TrendInvestorPro.com
The stock index ETFs continued to drift on Tuesday. After the surge from Thursday afternoon to Friday morning, stocks have been drifting for almost three days. Such a drift is not uncommon after a big move. These consolidations give the market time to digest its gains and provide the bulls...
READ MORE
MEMBERS ONLY
Norfolk Southern Falls Sharply From Resistance
by Arthur Hill,
Chief Technical Strategist, TrendInvestorPro.com
Norfolk Southern (NSC) is a railroad company and a key part of the Dow Transports. The chart below shows NSC hitting resistance around 75 and falling over 1% today. Notice that MACD barely made it back in positive territory on the last bounce. Another downturn from here would surely turn...
READ MORE
MEMBERS ONLY
SPY Could be in the Fifth of the Fifth, but Uptrend Rules for Now
by Arthur Hill,
Chief Technical Strategist, TrendInvestorPro.com
The major index ETFs are in uptrends and overbought. In general, it is much better to pick bottoms than tops in uptrend. Even though SPY, QQQ and IWM are overbought and ripe for a pullback, picking a short-term top is challenging when the bigger trend is clearly up. Overbought...
READ MORE
MEMBERS ONLY
Charts: BA, CHK, DAL, NVDA, POT, SBUX, TYC
by Arthur Hill,
Chief Technical Strategist, TrendInvestorPro.com
BA Underperforms with Support Break.
POT Challenges Channel Resistance.
Plus CHK, DAL, NVDA, POT, SBUX, TYC
This commentary and charts-of-interest are designed to stimulate thinking. This analysis is not a recommendation to buy, sell, hold or sell short any security (stock ETF or otherwise). We all need to...
READ MORE
MEMBERS ONLY
Eight of Nine Sector Bullish Percent Indices are Trending Higher
by Arthur Hill,
Chief Technical Strategist, TrendInvestorPro.com
The Bullish Percent Index (BPI) shows the percentage of stocks on Point & Figure buy signals within a specific group. Even though bulls have the edge when the BPI is above 50%, chartists also need to watch the direction of the BPI. The image below shows six sector BPI charts...
READ MORE
MEMBERS ONLY
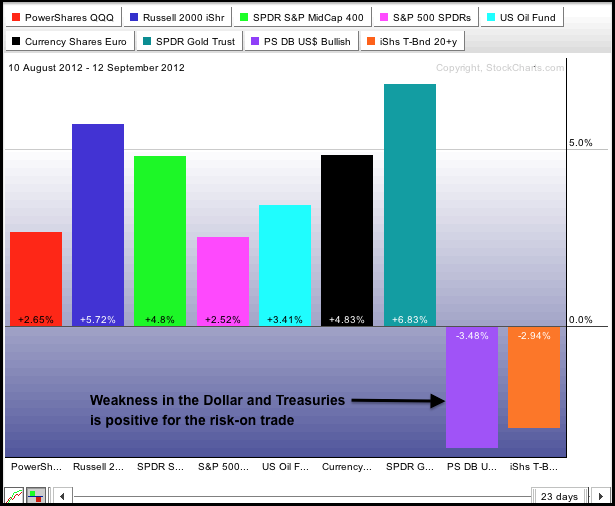
Stocks are Overbought and Dollar/Treasuries are Oversold
by Arthur Hill,
Chief Technical Strategist, TrendInvestorPro.com
Is it really this easy? Does another round of quantitative easing insure higher equity prices over the next few months? Well, the stock market agrees as the major index ETFs hit new highs last week and remain in clear uptrends. Also note that stocks were strong during prior periods of...
READ MORE
MEMBERS ONLY
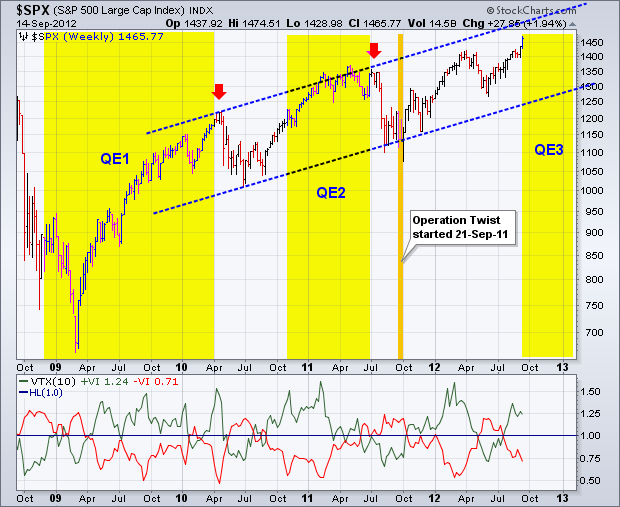
Quantitative Easing and the S&P 500 Since 2008
by Arthur Hill,
Chief Technical Strategist, TrendInvestorPro.com
Stocks surged on Thursday after the Fed announced another round of quantitative easing, and extended their gains on Friday. Obviously, the stock market is pleased with the announcement. The chart below shows the S&P 500 since September 2008 and the yellow areas mark the beginning-end of the...
READ MORE
MEMBERS ONLY
Several 52-week Highs Grace the Technical Alerts Page
by Arthur Hill,
Chief Technical Strategist, TrendInvestorPro.com
StocksCharts.com has a new technical alerts page that shows key milestones for dozens of ETFs and indices. On Thursday, September 13th, note that 10 securities recorded new 52-week highs. These include the Nasdaq, Russell 2000, Dow, S&P 500 and six sector SPDRs.
Click this image for...
READ MORE
MEMBERS ONLY
New Highs Reinforce Bullish Indicators
by Arthur Hill,
Chief Technical Strategist, TrendInvestorPro.com
With new highs in the major index ETFs, there is little doubt where the bulk of the evidence lies. The bulls are clearly in charge of this market right now. The NYSE AD Line hit a new high, the NYSE AD Volume Line is near its spring high and NYSE...
READ MORE
MEMBERS ONLY
Dollar Becomes Even More Oversold as Stocks Surge
by Arthur Hill,
Chief Technical Strategist, TrendInvestorPro.com
Judging from the reaction, it appears that the stock market is quite happy with a third round of quantitative easing. The major index ETFs surged with the S&P 500 ETF (SPY) and Dow Industrials SPDR (DIA) gaining around 1.5%. All sectors were up with the Finance SPDR...
READ MORE
MEMBERS ONLY
Semiconductor ETF Tests Two Key Moving Averages SMH
by Arthur Hill,
Chief Technical Strategist, TrendInvestorPro.com
After a big surge above 33, the Market Vectors Semiconductor ETF (SMH) peaked in mid August and declined back to support in the 32.50 area. Support here stems form broken resistance, the rising 200-day SMA and the rising 50-day SMA. A successful test and break above 33...
READ MORE
MEMBERS ONLY
Weakness in Treasuries and the Dollar is Positive for Stocks
by Arthur Hill,
Chief Technical Strategist, TrendInvestorPro.com
Stocks meandered again on Wednesday and then closed with small gains. All of the major index ETFs were up with the S&P MidCap 400 SPDR (MDY) leading the way (up a mere .52%). Six of the nine sectors were higher with the Energy SPDR (XLE) and Technology SPDR...
READ MORE
MEMBERS ONLY
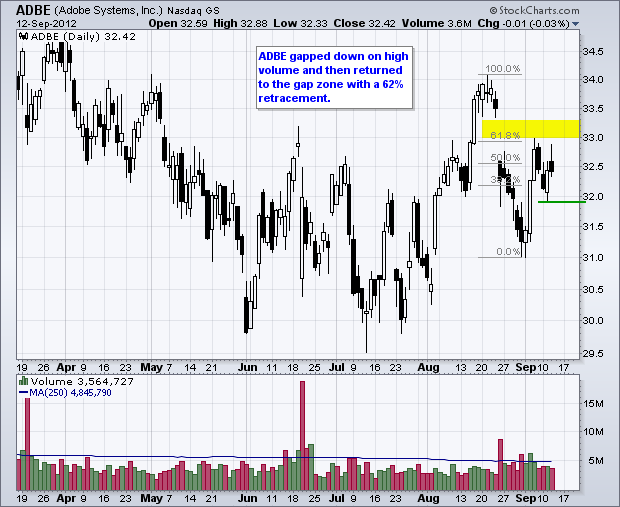
Charts of Interest: ADBE, GRMN, LUV, QCOM, SKUL
by Arthur Hill,
Chief Technical Strategist, TrendInvestorPro.com
ADBE Hits Resistance in Gap Zone.
LUV Forms Triangle after Surge.
Plus GRMN, QCOM, SKUL
This commentary and charts-of-interest are designed to stimulate thinking. This analysis is not a recommendation to buy, sell, hold or sell short any security (stock ETF or otherwise). We all need to think...
READ MORE
MEMBERS ONLY
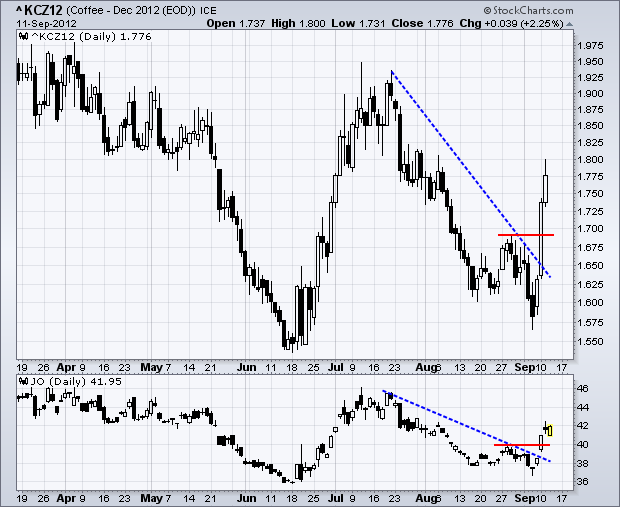
Coffee Surges off Support with Big Move
by Arthur Hill,
Chief Technical Strategist, TrendInvestorPro.com
The chart in the main window shows December Coffee Futures ($KCZ12) finding support above the June low and surging above the late August high. The indicator window shows the Coffee ETN (JO) with a similar pattern. These breakouts are bullish as long they hold. A move back below the breakout...
READ MORE
MEMBERS ONLY
QQQ Falls Back as Apple Event Looms
by Arthur Hill,
Chief Technical Strategist, TrendInvestorPro.com
Stocks meandered around in positive territory on Monday and ended the day with small gains. A little indecision is understandable given the recent gains and the news flow over the next few days. Key happenings include the German constiutional court ruling and the Apple event today, the FOMC policy statement...
READ MORE
MEMBERS ONLY
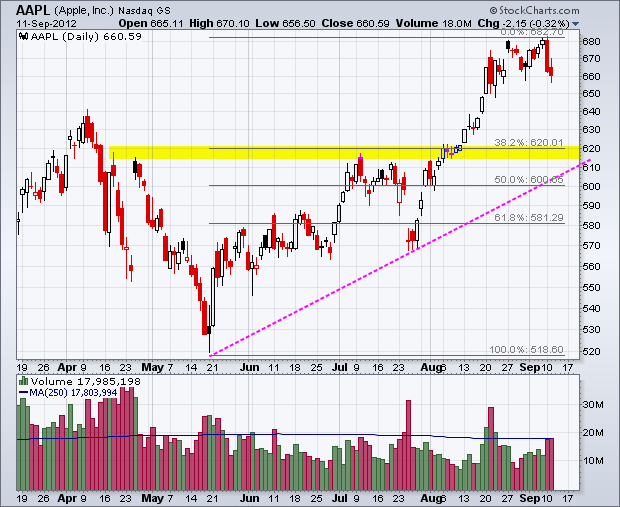
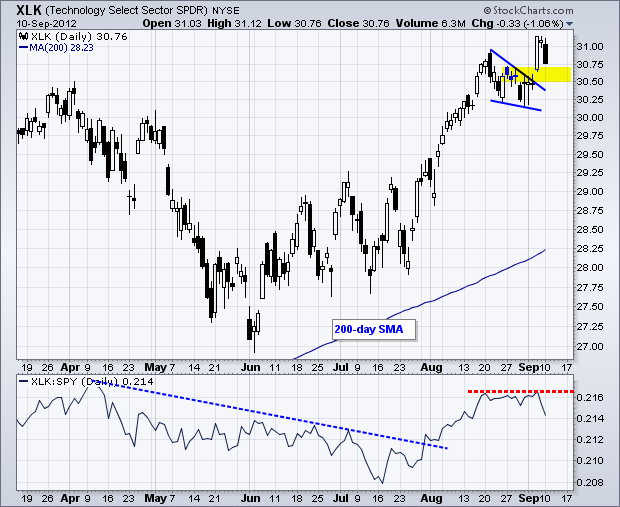
XLK Starts Underperforming - TLT Hits Key Retracement
by Arthur Hill,
Chief Technical Strategist, TrendInvestorPro.com
Stocks moved lower on Monday as traders booked some profits from last week's rally. The Nasdaq 100 ETF led the way lower as Apple's big event approaches. Apple investors appear to be getting cold feet as the stock fell over 2% on Monday. The Russell 2000...
READ MORE
MEMBERS ONLY
Charts: BOOM, BRCM, CSX, DUK, KLAC, MCHP, MDR
by Arthur Hill,
Chief Technical Strategist, TrendInvestorPro.com
BOOM forms large descending triangle.
KLAC gaps and forms bear flag.
Plus BRCM, CSX, DUK, MCHP, MDR
This commentary and charts-of-interest are designed to stimulate thinking. This analysis is not a recommendation to buy, sell, hold or sell short any security (stock ETF or otherwise). We all need...
READ MORE
MEMBERS ONLY
Dollar Extends Downtrend and Becomes Oversold
by Arthur Hill,
Chief Technical Strategist, TrendInvestorPro.com
Stocks extended their gains on Friday and the S&P 500 finished with its biggest weekly gain since early July. This key benchmark index cleared its spring highs and closed at a 52-week high on Friday. Five of the nine sector SPDRs were up on Friday. The technology...
READ MORE
MEMBERS ONLY
Dow Challenges Spring Highs on 30pt Point & Figure Chart
by Arthur Hill,
Chief Technical Strategist, TrendInvestorPro.com
The P&F chart below shows the Dow Industrials using 30 points per box and a three box reversal method. With the August dip and September surge, the Dow is challenging the prior highs and tracing out a large inverse head-and-shoulders pattern. A break above these highs...
READ MORE
MEMBERS ONLY
Arch Coal Leads Resurgent Coal Group
by Arthur Hill,
Chief Technical Strategist, TrendInvestorPro.com
The coal group has been one of the worse performers this year, but coal stocks moved sharply higher the last two days. Arch Coal (ACI) is showing some signs of life with a falling wedge breakout on three days of good volume. The July-August highs mark the next resistance...
READ MORE
MEMBERS ONLY
Net New Highs Surge on the NYSE and Nasdaq
by Arthur Hill,
Chief Technical Strategist, TrendInvestorPro.com
With a big surge on Thursday, stocks broke out of their funk and the indicator summary improved a notch. Techs continue to lead the market overall. The Nasdaq AD Line broke triangle resistance, Nasdaq Net New Highs surged to their highest levels since early July and the Technology SPDR (XLK)...
READ MORE
MEMBERS ONLY
SPY Breaks Wedge Resistance with Gap - USO Tests Support
by Arthur Hill,
Chief Technical Strategist, TrendInvestorPro.com
A mixed up Wall Street turned into a raving bull as stocks surged ahead of today's employment report. Rumor has it that Super Mario, Draghi, not Gabelli, inspired the bulls. It kind of makes the employment report an after thought. Consensus calls for non-farm payrolls to add...
READ MORE