MEMBERS ONLY
Gold and Oil ETFs Lead the Week
by Arthur Hill,
Chief Technical Strategist, TrendInvestorPro.com
The PerfChart below shows the performance for five intermarket ETFs. The Gold SPDR (GLD) and the US Oil Fund (USO) sport the biggest gains and are clearly leading the group. The 20+ year Bond ETF (TLT) and US Dollar Fund (UUP) have the smallest gains and are lagging. Such relative...
READ MORE
MEMBERS ONLY
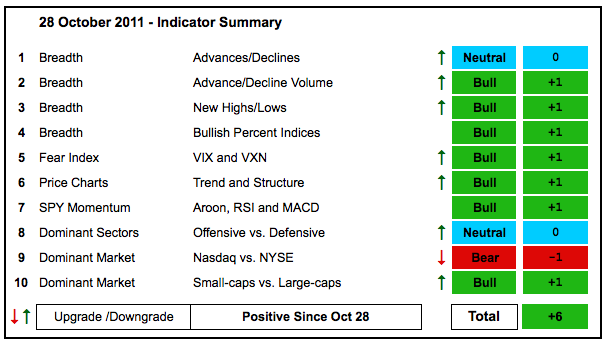
Nasdaq Weighs on Indicator Summary
by Arthur Hill,
Chief Technical Strategist, TrendInvestorPro.com
The indicator summary remains positive, but breadth is split with the Nasdaq showing less strength. After some weakness early in the week, stocks rebounded on Wednesday-Thursday and the major index ETFs are largely holding their October breakouts. This selling pressure was enough to push Nasdaq net new highs into negative...
READ MORE
MEMBERS ONLY
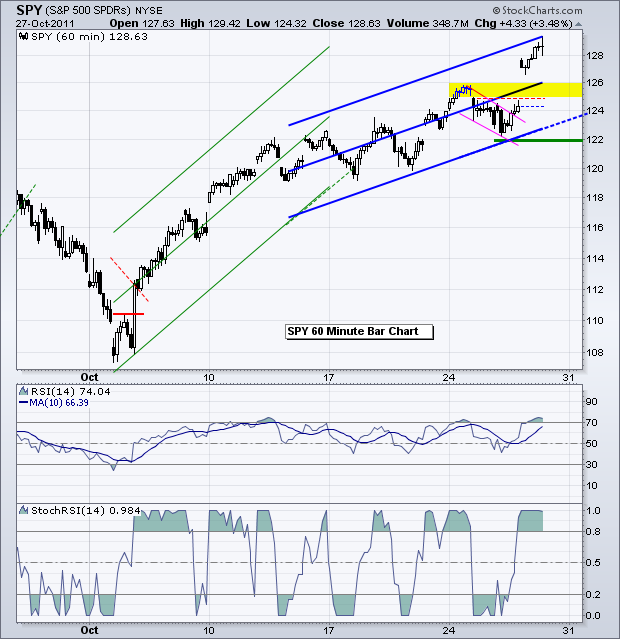
TLT and UUP Form Bullish Continuation Patterns
by Arthur Hill,
Chief Technical Strategist, TrendInvestorPro.com
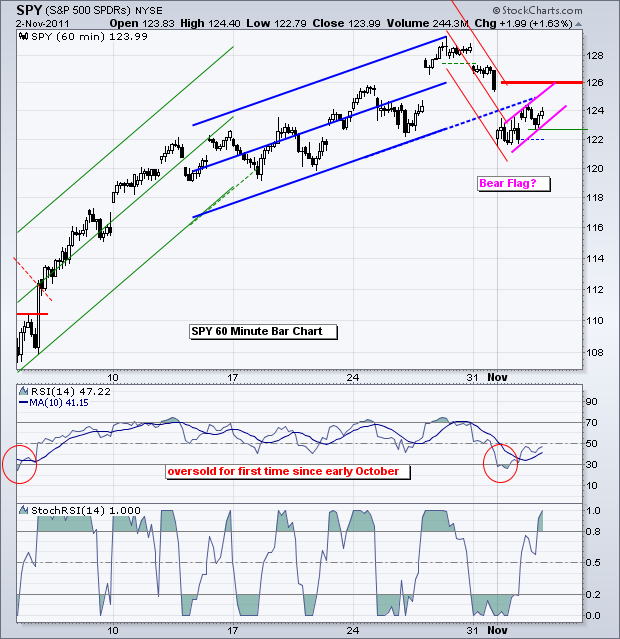
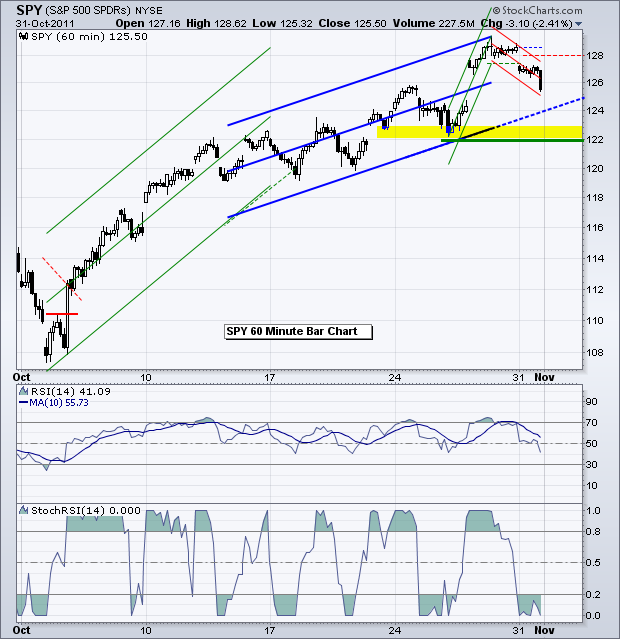
And now for the employment report...Friday's market is at the mercy of the employment report, or rather Wall Street's reaction to the report. The S&P 500 ETF (SPY) bounced off medium-term support in the 122-124 area with a move above 126 the last...
READ MORE
MEMBERS ONLY
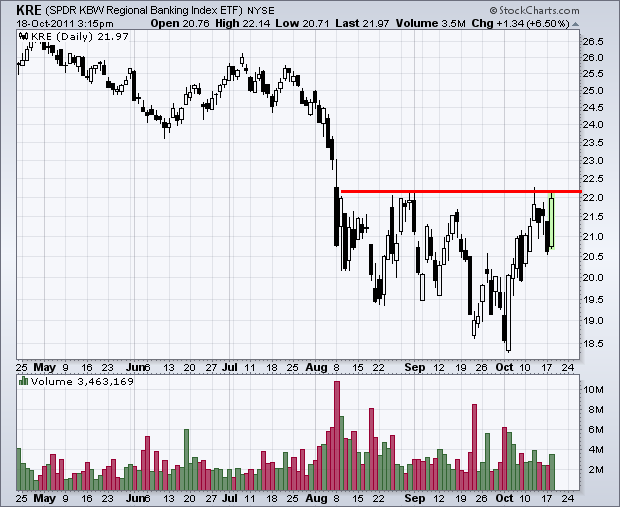
Broken Resistance Turns Support for Regional Bank SPDR
by Arthur Hill,
Chief Technical Strategist, TrendInvestorPro.com
The Regional Bank SPDR (KRE) broke resistance with the October surge and broken resistance turned into support. This is a basic tenet of technical analysis. The throwback to broken resistance held (so far) as the ETF bounced back above 23 on Wednesday.
Click this chart for a live image...
READ MORE
MEMBERS ONLY
Gold Holds Support as Bonds and the Dollar Surge
by Arthur Hill,
Chief Technical Strategist, TrendInvestorPro.com
A couple of wrenches, which were thrown out of left field, landed in the flywheel on Monday and Tuesday. While I am not sure the MF Global debacle and Greek referendum are totally to blame for the two day meltdown, there is no questioning the extent of recent selling pressure....
READ MORE
MEMBERS ONLY
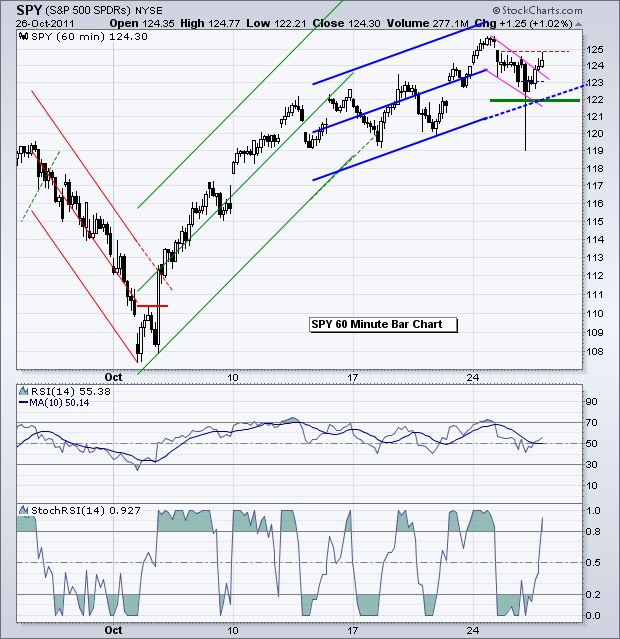
QQQ and IWM Consolidated at Support with Rising Flags
by Arthur Hill,
Chief Technical Strategist, TrendInvestorPro.com
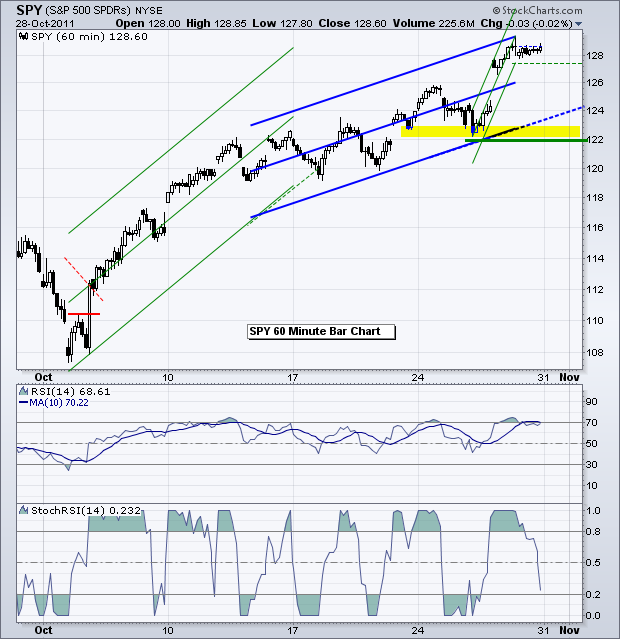
The S&P 500 ETF (SPY) broke support with a gap down and then consolidated around 122-124. This zone marks support on the daily chart. Broken resistance from the late August and mid September peaks turns support on this chart. On the 60-minute chart, the rise over the last...
READ MORE
MEMBERS ONLY
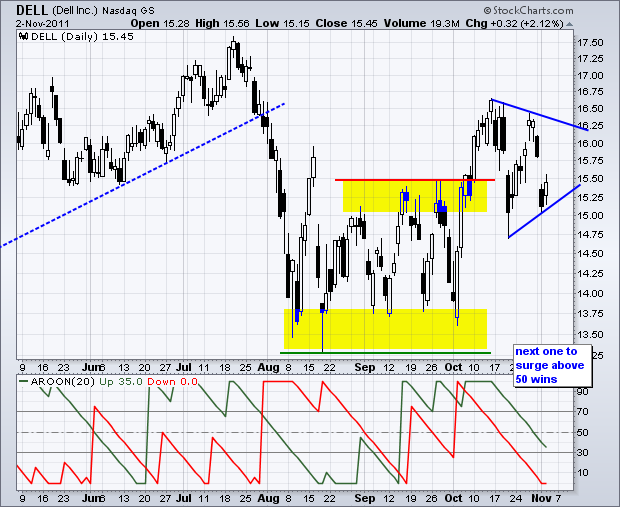
Charts of Interest: DELL, FNSR, MRVL, PEP, SBUX, WFC
by Arthur Hill,
Chief Technical Strategist, TrendInvestorPro.com
FNSR Breaks Wedge Trendline with Volume.
PEP Consolidates after Surge.
SBUX Gaps Down and the Gap Remains Unfilled.
Plus DELL, MRVL, WFC
This commentary and charts-of-interest are designed to stimulate thinking. This analysis is not a recommendation to buy, sell, hold or sell short any security (stock ETF or otherwise)...
READ MORE
MEMBERS ONLY
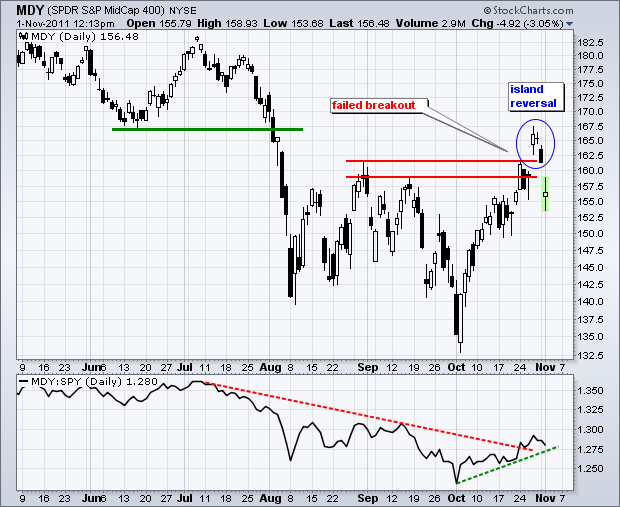
A Failed Breakout and Island Reversal for MDY
by Arthur Hill,
Chief Technical Strategist, TrendInvestorPro.com
With a gap down and sharp decline the last two days, the S&P MidCap 400 SPDR (MDY) failed to hold the resistance breakouts around 160. Also notice that the ETF formed an island reversal, Last Thursday's gap was countered by today's gap to create...
READ MORE
MEMBERS ONLY
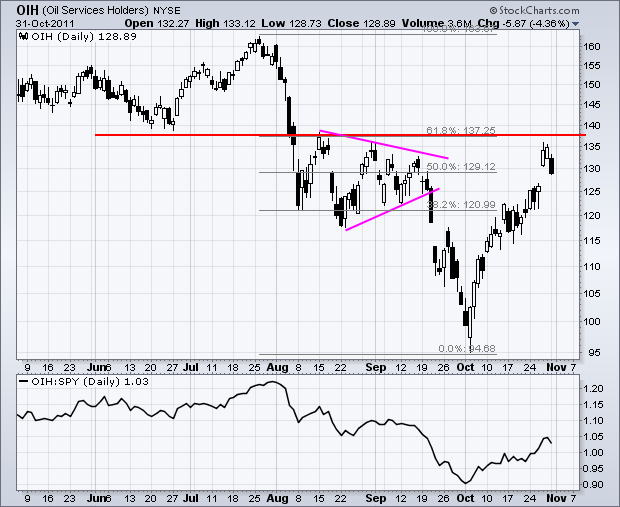
Oil Service HOLDRS Runs into Resistance after Gap
by Arthur Hill,
Chief Technical Strategist, TrendInvestorPro.com
The Oil Service HOLDRS (OIH) surged over 30% in October and hit resistance in the 137 area. Resistance here stems from broken support and the August highs. This level also marks a 61.80% retracement of the prior decline and the ETF is quite overbought after the October run.
Click...
READ MORE
MEMBERS ONLY
Markets Make a Hard Risk-off Turn on Monday
by Arthur Hill,
Chief Technical Strategist, TrendInvestorPro.com
The market made a statement on Monday. After a big risk-on move last week, the market made a hard turn towards risk-off on Monday. It is just one day, but a bad week would likely suggest that the medium-term bullish signals seen over the last two weeks have been negated....
READ MORE
MEMBERS ONLY
Charts of Interest: AAPL, BAX, GME, NXY, SPLS
by Arthur Hill,
Chief Technical Strategist, TrendInvestorPro.com
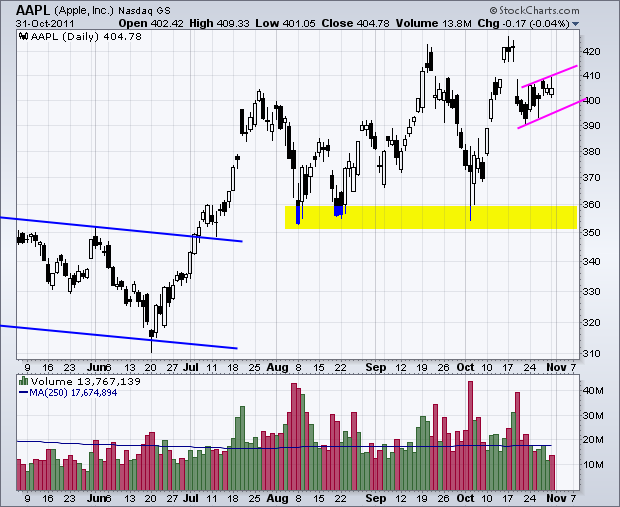
AAPL Forms Bear Flag.
GME Forms Shooting Star Near Resistance.
Upside Volume Surges for NXY.
Plus BAX and SPLS
This commentary and charts-of-interest are designed to stimulate thinking. This analysis is not a recommendation to buy, sell, hold or sell short any security (stock ETF or otherwise). We all need...
READ MORE
MEMBERS ONLY
Stocks Become Overbought as Big Economic Week Looms
by Arthur Hill,
Chief Technical Strategist, TrendInvestorPro.com
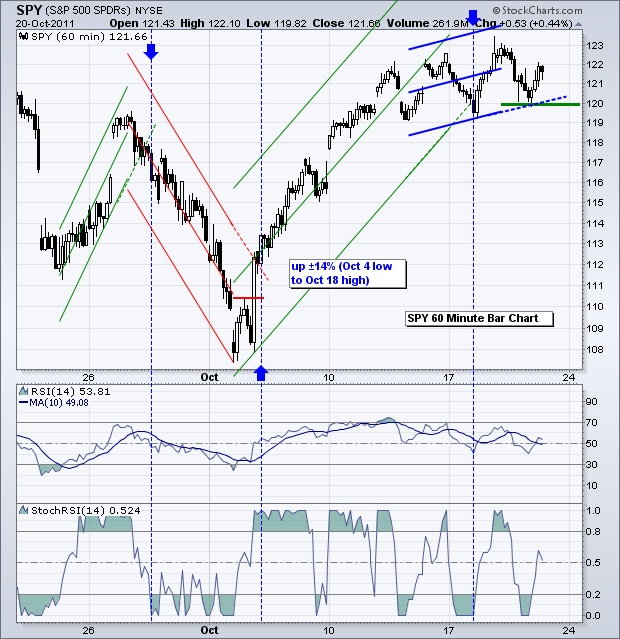
First, note that stocks remain in strong uptrends since the October 4th reversals. Second, the major index ETFs are quite overbought. IWM is up over 24% the last 19 days. SPY is up almost 17% and QQQ is up just over 15%. These are huge gains in just four weeks....
READ MORE
MEMBERS ONLY
October is Clearly Risk-On Month with SPY and USO Leading
by Arthur Hill,
Chief Technical Strategist, TrendInvestorPro.com
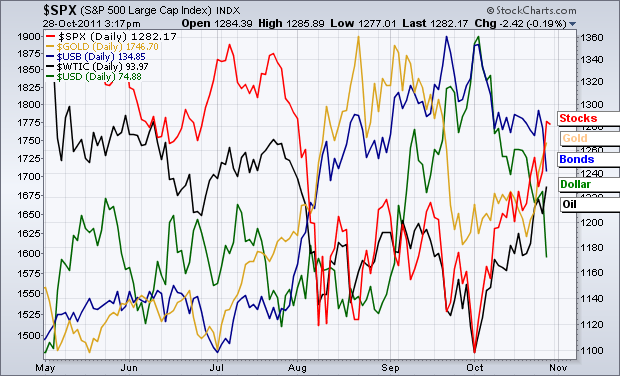
Chartists can measure the market's risk tolerance by comparing the simple line charts for four ETFs. The S&P 500 ETF (SPY) and US Oil Fund (USO) rise when risk is "on", while the 20+ year Bond ETF (TLT) and US Dollar Fund (UUP) rise...
READ MORE
MEMBERS ONLY
Indicator Summary Surges into Positive Territory
by Arthur Hill,
Chief Technical Strategist, TrendInvestorPro.com
As noted last week, another strong move in the stock market would likely turn the indicator summary positive. That is indeed what we got, especially with Thursday's surge. The NYSE AD Line and Nasdaq AD Volume Line surged through resistance levels. New 52-week highs expanded as the cumulative...
READ MORE
MEMBERS ONLY
Stocks Surge to Extend Uptrends and Overbought Conditions
by Arthur Hill,
Chief Technical Strategist, TrendInvestorPro.com
Stocks surged on the open and closed strong with all boats rising. Small-caps and mid-caps led the advance, which shows a strong appetite for risk. All sectors were up with the Finance SPDR (XLF) surging almost 6%. Whether short covering or new buying, Thursday's advance is setting the...
READ MORE
MEMBERS ONLY
Indecision Creeps into the Steel ETF
by Arthur Hill,
Chief Technical Strategist, TrendInvestorPro.com
The Steel ETF (SLX) surged above its mid October high with a big move on Monday, but turned indecisive on Tuesday and Wednesday. Notice how Tuesday's candlestick was completely within the range of Monday's. The pattern here is a Harami. This indecision extended as Wednesday'...
READ MORE
MEMBERS ONLY
Trading Turns Choppy, but SPY Uptrend Holds
by Arthur Hill,
Chief Technical Strategist, TrendInvestorPro.com
Stocks started the day weak with large-cap techs leading the way lower early Wednesday. QQQ opened with a move below 56.5 and was down some 1.7% at one point. However, the bulls showed their resilience as stocks rallied back by the close. QQQ returned to positive territory. Small-caps...
READ MORE
MEMBERS ONLY
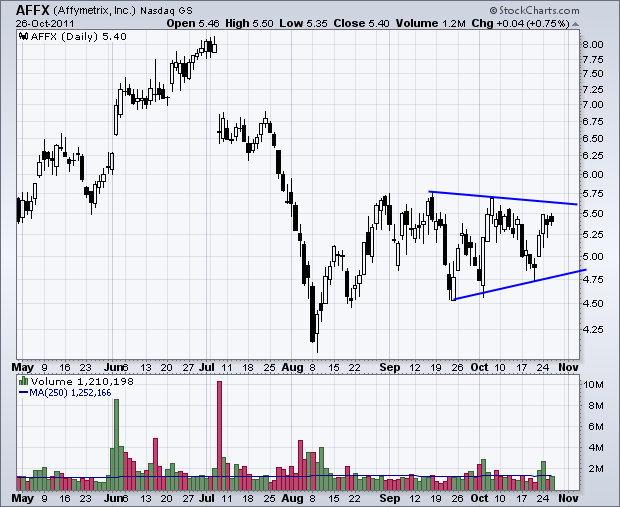
Charts of Interest: AFFX, AKAM, AMKR, MDR, SLB, WFT
by Arthur Hill,
Chief Technical Strategist, TrendInvestorPro.com
Careful, it is still earnings season.
AKAM Forms Pennant after Big Surge.
AMRK Consolidates with Triangle.
SLB Forms Bull Flag after Trendline Break.
Plus AFFX, MDR, WFT
This commentary and charts-of-interest are designed to stimulate thinking. This analysis is not a recommendation to buy, sell, hold or sell short any...
READ MORE
MEMBERS ONLY
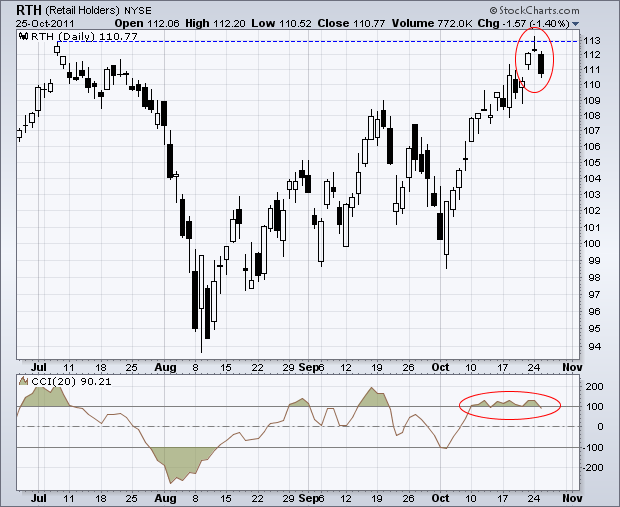
Retail HOLDRS Forms Evening Doji Star Reversal
by Arthur Hill,
Chief Technical Strategist, TrendInvestorPro.com
After a surge to the early July high, the Retail HOLDRS (RTH) formed a rare evening doji star. This bearish candlestick reversal pattern features a white candlestick, a doji and a long black candlestick. There are gaps on either side of the doji. This doji has a long upper shadow,...
READ MORE
MEMBERS ONLY
Stocks Fall Sharply as Treasuries and Gold Break Out
by Arthur Hill,
Chief Technical Strategist, TrendInvestorPro.com
Do yourself a favor. Don't read about the EU summit. As Mickey Blue Eyes might say: Fuggedaboutit! Focus on the price charts. All known information is reflected in the charts. In fact, there is also likely a little bit of unknown information in the charts as well. Stocks...
READ MORE
MEMBERS ONLY
Ciena Fails to Hold Breakout
by Arthur Hill,
Chief Technical Strategist, TrendInvestorPro.com
Sometimes a failed signal is as good as a signal. Ciena (CIEN) broke resistance with a surge above 12.50 on Friday-Monday, but failed to hold this breakout after Tuesday's high-volume decline. A long black candlestick formed as the stock opened slightly lower, moved down throughout the day...
READ MORE
MEMBERS ONLY
Stocks Extend Gains, but Treasuries Firm
by Arthur Hill,
Chief Technical Strategist, TrendInvestorPro.com
It is getting close to crunch time for the EU. How many times have we heard this before? Anyhow, yet another deadline is approaching and there are still rifts between Germany and France on the size, scope and leverage for the bailout fund. Stocks extended their advances on Monday with...
READ MORE
MEMBERS ONLY
Charts of Interest: AMX, CHS, NTAP, POT, STI, SWKS, TMO
by Arthur Hill,
Chief Technical Strategist, TrendInvestorPro.com
AMX Breaks Flag Resistance with Volume.
CHS Bounces off Flag Support.
STI Surges to Challenge Resistance.
Plus NTAP, POT, SWKS, TMO
This commentary and charts-of-interest are designed to stimulate thinking. This analysis is not a recommendation to buy, sell, hold or sell short any security (stock ETF or otherwise). We...
READ MORE
MEMBERS ONLY
Eaton Corp Breaks Pennant Resistance with Volume
by Arthur Hill,
Chief Technical Strategist, TrendInvestorPro.com
There were a lot of consolidation breakouts the last two days. After a surge the first week and a half of October, many stocks and ETFs consolidated for a week or so. With strength the last two days, these same stocks and ETFs are breaking consolidation resistance. The chart below...
READ MORE
MEMBERS ONLY
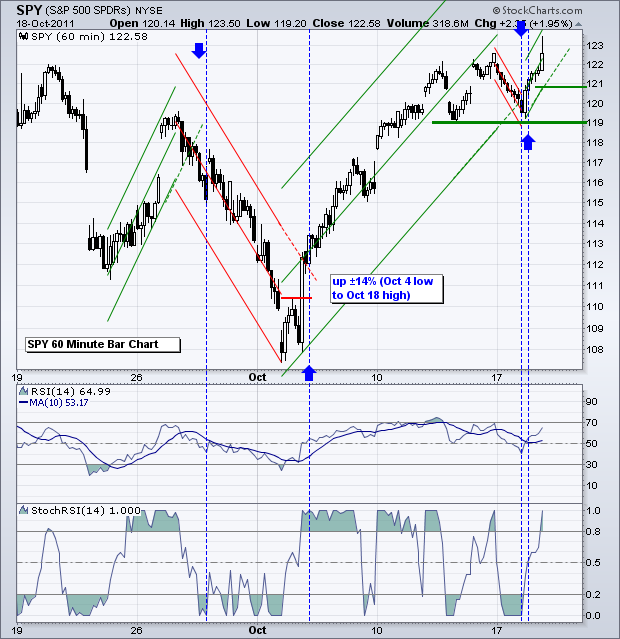
SPY Breaks Mid October High as Treasuries Move Lower
by Arthur Hill,
Chief Technical Strategist, TrendInvestorPro.com
Stocks opened strong with a gap on Friday morning, consolidated and then closed strong. With another advance, the S&P 500 ETF (SPY) moved to a new high for the move as it broke above its mid October highs. The Russell 2000 ETF (IWM) is challenging its mid October...
READ MORE
MEMBERS ONLY
Sector Rotations Show a Split Market Since July
by Arthur Hill,
Chief Technical Strategist, TrendInvestorPro.com
The Sector PerfChart below shows the performance for four sectors relative to the S&P 500. The Technology ETF (XLK) and the Consumer Discretionary SPDR (XLY) have been outperforming the S&P 500 since July 11th, while the Industrials SPDR (XLI) and Finance SPDR (XLF) have been underperforming....
READ MORE
MEMBERS ONLY
NYSE AD Line and Nasdaq AD Line Challenge Resistance
by Arthur Hill,
Chief Technical Strategist, TrendInvestorPro.com
The October rally stalled over the last few days and many charts show that this stall is occurring at important levels. The S&P 500 ETF (SPY) and Dow Industrials SPDR (DIA) are both stalling at resistance from the late August highs. The NYSE AD Line and Nasdaq AD...
READ MORE
MEMBERS ONLY
Stocks, Bonds and Dollar Remain Range Bound
by Arthur Hill,
Chief Technical Strategist, TrendInvestorPro.com
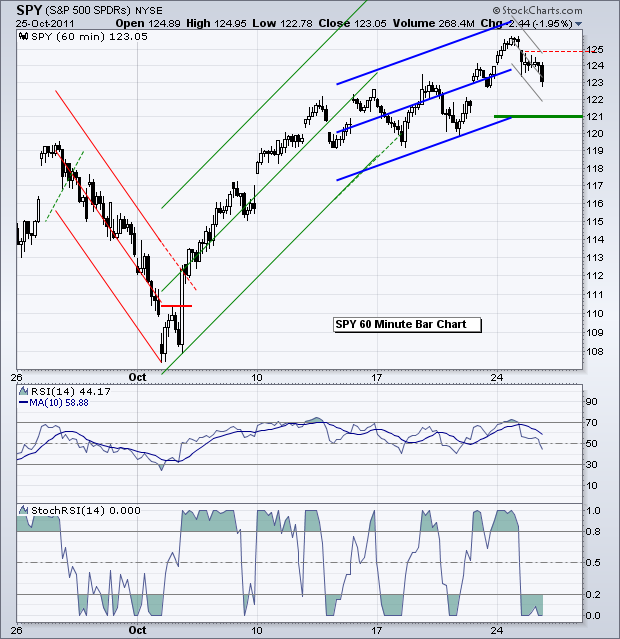
Short-term trading remains choppy as stocks bounce within a range. Playing the swings within this range is not suited for 60-minute charts. Chartists wishing to play these swings should turn to 10 or 15 minute charts. Thursday's SPY chart showed the swings within the trading range (119-123). It...
READ MORE
MEMBERS ONLY
Market Carpet Highlights Leaders in the Finance Sector
by Arthur Hill,
Chief Technical Strategist, TrendInvestorPro.com
The Finance SPDR (XLF) was leading the market higher late Thursday afternoon. Chartists can check in on the Sector Market Carpet to find the leaders within a particular sector. First, click on the sector heading to isolate the sector. Second, right click with the mouse and choose "Show Ticker...
READ MORE
MEMBERS ONLY
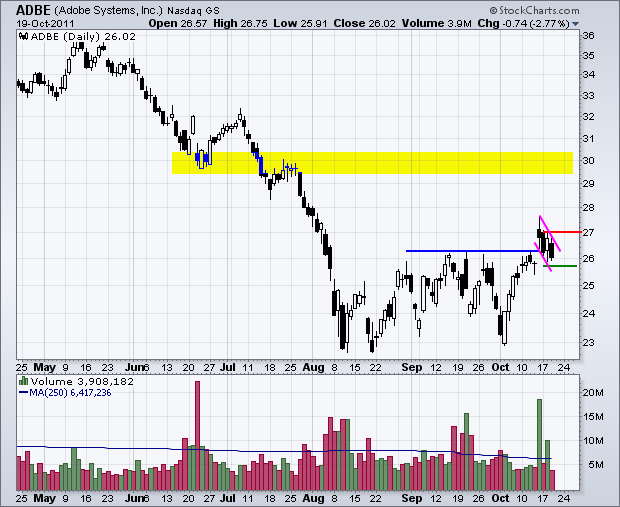
Charts of Interest: ADBE, AGU, DE, HSIC, MDT
by Arthur Hill,
Chief Technical Strategist, TrendInvestorPro.com
ADBE Forms Falling Flag after Surge.
AGU Forms Bearish Engulfing in Resistance Zone.
MDT Breaks Flag/Wedge Resistance with Volume.
Plus DE and HSIC...
READ MORE
MEMBERS ONLY
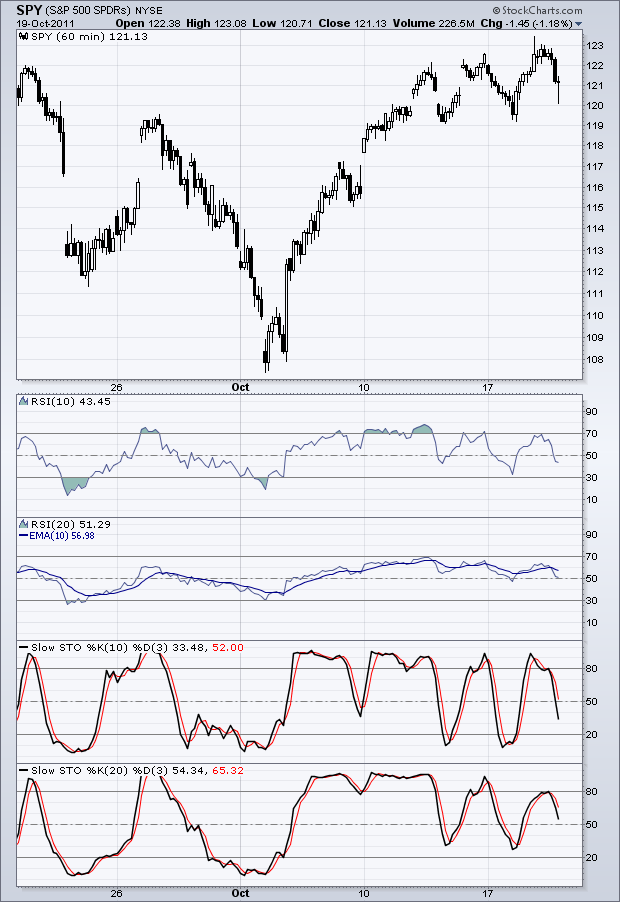
Late Declines Reverse Upswings in SPY and USO
by Arthur Hill,
Chief Technical Strategist, TrendInvestorPro.com
Indicators settings confront chartists with a conundrum. The number of periods used for an indicator affects the speed and the number of signals. For example, 20-period RSI will cross the centerline (50) fewer times than 10-period RSI. 20-period Stochastics will become overbought/oversold less often than 10-period Stochastics. There is...
READ MORE
MEMBERS ONLY
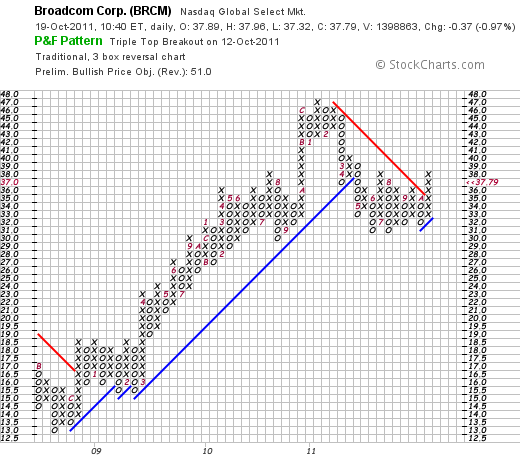
Broadcom Triggers Triple Top Breakout on P&F Chart
by Arthur Hill,
Chief Technical Strategist, TrendInvestorPro.com
Broadcom (BRCM) triggered a Triple Top Breakout with a move above the September highs on the P&F chart. The stock shows two resistance levels with two X-Columns peaking in the 37 box. The break above the 38 box also broke the Bearish Resistance Line. More P&F...
READ MORE
MEMBERS ONLY
Stocks Recover Immediately after Weak Open
by Arthur Hill,
Chief Technical Strategist, TrendInvestorPro.com
Stocks continued weak with a lower open on Tuesday, but quickly reversed and moved sharply higher the rest of the day. Selling pressure was limited to the first 30 minutes as the S&P 500 dipped below 1192 by 10AM. Things quickly changed. By 11AM, the S&P...
READ MORE
MEMBERS ONLY
Regional Bank SPDR Challenges Resistance with Big Move
by Arthur Hill,
Chief Technical Strategist, TrendInvestorPro.com
A day after failing at resistance just a day ago, the Regional Bank SPDR (KRE) is right back challenging the late summer highs. KRE dropped below 21 with a sharp decline on Monday, but surged back above 21.50 with an even bigger move on Tuesday. Volume also expanded and...
READ MORE
MEMBERS ONLY
Stocks Loose Momeumtem as Bonds and Dollar Firm
by Arthur Hill,
Chief Technical Strategist, TrendInvestorPro.com
Momentum is changing as RSI and StochRSI moved into bear mode for IWM, QQQ and SPY. As noted last week, StochRSI is one of the most sensitive momentum oscillators, which means it is prone to false signals (whipsaws). StochRSI is the Stochastic Oscillator formula applied to RSI values. This makes...
READ MORE
MEMBERS ONLY
Charts of Interest: ANF, CHRW, CHS, ESRX, FL, PLCE, SKS
by Arthur Hill,
Chief Technical Strategist, TrendInvestorPro.com
Careful out there. It is earnings seaon.
CHRW Traces out ABC Zigzag Advance.
ESRX Surges and Forms Bull Flag.
FL Consolidates after Oversold Bounce.
Plus ANF, CHS, PLCE, SKS
This commentary and charts-of-interest are designed to stimulate thinking. This analysis is not a recommendation to buy, sell, hold or sell...
READ MORE
MEMBERS ONLY
Caterpillar Forms Bearish Engulfing at Key Retracement
by Arthur Hill,
Chief Technical Strategist, TrendInvestorPro.com
Caterpillar came across the Predefined Scans page with a Bearish Engulfing pattern. This page is updated throughout the day so chartists can find patterns as they happen. CAT formed a Bearish Engulfing with an open above 84 and close below 82. Notice that this intraday reversal formed at a key...
READ MORE
MEMBERS ONLY
Risk-on Environment Remains, but Moves Getting Extended
by Arthur Hill,
Chief Technical Strategist, TrendInvestorPro.com
The markets remain in RISK-ON mode. This is bullish for the Euro, stocks, commodities and, perhaps, gold. This is bearish for the Dollar and Treasuries. Even though the short-term trends are getting extended, we have yet to see reversals that would suggest an end to this risk-on environment. Earnings season...
READ MORE
MEMBERS ONLY
US DOLLAR INDEX TEST BREAKOUT WITH THROWBACK
by Arthur Hill,
Chief Technical Strategist, TrendInvestorPro.com
The US Dollar Index ($USD) was hit hard this week with a 2.2% decline. Weakness in the Dollar buoyed oil and stocks, which have been negatively correlated with the greenback. Dollar weakness and Euro strength is also associated with the risk-on trade. Despite this week's decline, the...
READ MORE
MEMBERS ONLY
XLY and XLK Lead with Move above September High
by Arthur Hill,
Chief Technical Strategist, TrendInvestorPro.com
As of Thursday's close, the Technology ETF (XLK), Consumer Discretionary SPDR (XLY) and Utilities SPDR (XLU) were the only sectors SPDRs trading above their September 15th closing high. The S&P 500 was still just below, while the Finance SPDR (XLF) was well below (3.26%). This...
READ MORE