MEMBERS ONLY
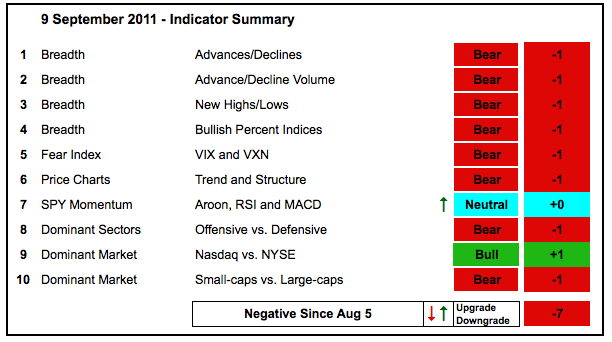
Indicator Summary Remains Deep in the Red
by Arthur Hill,
Chief Technical Strategist, TrendInvestorPro.com
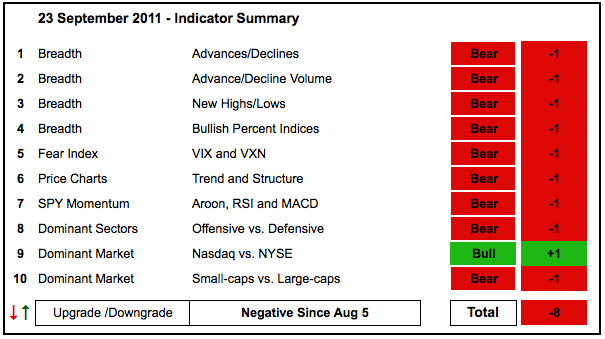
Needless to say, the indicator summary remains decidedly negative. With another sharp move lower this week, the SPY momentum indicators moved from neutral to bearish. The Nasdaq AD Line and NYSE AD Volume Line hit new lows this week. The volatility indices surged above 40 to confirm high levels of...
READ MORE
MEMBERS ONLY
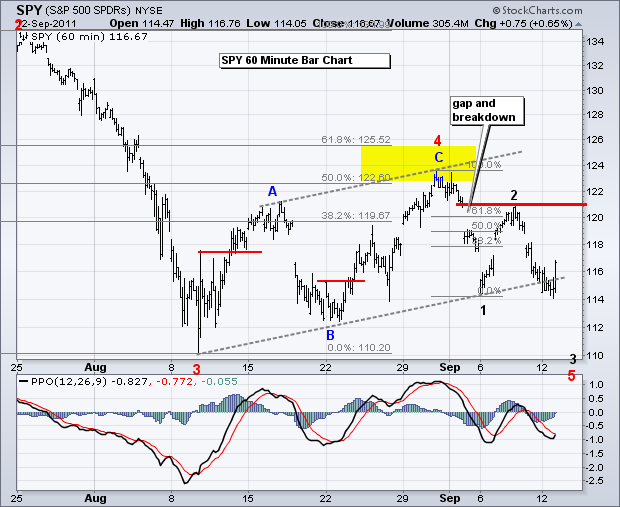
Stock and Oil Gap Sharply Lower as Bonds and the Dollar Surge
by Arthur Hill,
Chief Technical Strategist, TrendInvestorPro.com
Looks like everyone ran for the exit at the same time, whatever the reason. The S&P 500 ETF (SPY) broke below the early September lows with a plunge below 112 intraday. There was a big gap below 114, an intraday dip below 112 and a last hour surge...
READ MORE
MEMBERS ONLY
Consumer Staples Show a Few Gainers
by Arthur Hill,
Chief Technical Strategist, TrendInvestorPro.com
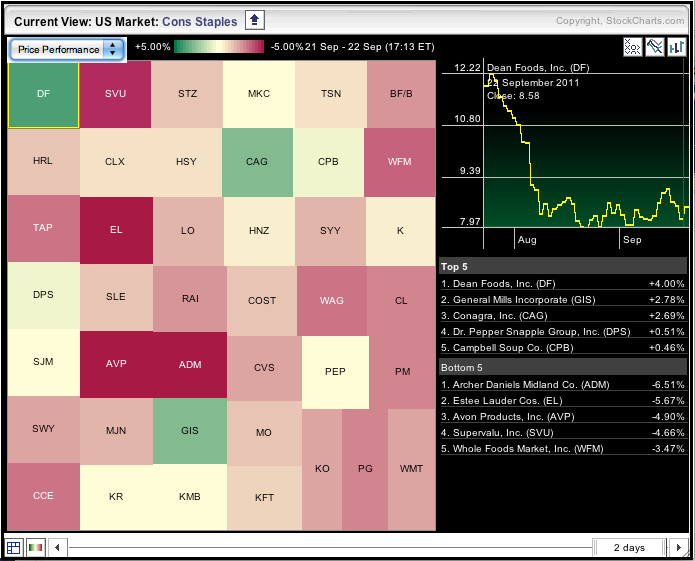
Stocks were down sharply on Thursday with all sectors moving lower on the day. There were, however, a few select pockets of strength. These can be found by looking for shades of green in the market carpet. The image below shows the Consumer Staples sectors with a few gainers.
Click...
READ MORE
MEMBERS ONLY
SPY and GLD Extend Downtrends as UUP and TLT Surge
by Arthur Hill,
Chief Technical Strategist, TrendInvestorPro.com
It is getting ugly. Asian and European stocks are down sharply. Gold, the Euro and oil are also down. The Dollar and US Treasuries are the only positive spots. It is a classic flight to safety or move to the risk-off trade. The Fed pretty much echoed the sentiments of...
READ MORE
MEMBERS ONLY
Altera Forms Pennant after Surge to Resistance
by Arthur Hill,
Chief Technical Strategist, TrendInvestorPro.com
Altera (ALTR) is at its make-or-break point. The stock surged to the August highs with a rather strong move last week. This advance met resistance as the stock pulled back with a pennant last four days. Either the stock will fail at resistance or break out of the pennant to...
READ MORE
MEMBERS ONLY
Small-caps Show Weakness as GLD Maintains Wedge
by Arthur Hill,
Chief Technical Strategist, TrendInvestorPro.com
In an about face, stocks started the day strong and sold off in the final hour. Perhaps even more telling, small-caps led the way lower with the Russell 2000 ETF (IWM) loosing 1.55% on the day. This is a negative sign to see small-caps lead lower. These stocks (companies)...
READ MORE
MEMBERS ONLY
Small-caps Get Cold Feet ahead of Fed
by Arthur Hill,
Chief Technical Strategist, TrendInvestorPro.com
Stocks sold off in the final hour with small-caps leading the way lower. As the market summary page shows, the S&P SmallCap 600 ($SML) and the Russell 2000 ($RUT) led the afternoon decline with losses greater than 1.5% on the day.
Click this image for a live...
READ MORE
MEMBERS ONLY
SPY Recovers after Weak Open and GLD Forms Falling Wedge
by Arthur Hill,
Chief Technical Strategist, TrendInvestorPro.com
Stocks started the day weak, but surged in the final hour on rumors of a Greek debt deal involving the European Central Bank (ECB), IMF and the European Commission. Gee, maybe we can find a few more organizations to throw into this rumor. In any case, these rumors and "...
READ MORE
MEMBERS ONLY
Apple Powers QQQ Higher with Strong Positive Correlation
by Arthur Hill,
Chief Technical Strategist, TrendInvestorPro.com
As Apple goes, so goes the Nasdaq 100 ETF (QQQ). Wall Street used to say the same thing about GM during its heyday. Apple surged to a new 52-week high and powered QQQ higher on Monday. The indicator window shows the Correlation Coefficient trading above .90 since mid August.
Click...
READ MORE
MEMBERS ONLY
HS Pattern Takes Shape in SPY as GLD Forms Falling Wedge
by Arthur Hill,
Chief Technical Strategist, TrendInvestorPro.com
It could be a wild week in the markets. First, stock futures are pointing to a sharply lower open. The Euro and oil are trading lower, while bonds and the Dollar are trading higher. Second, the Fed starts its two-day meeting on Tuesday with a policy statement on Wednesday afternoon....
READ MORE
MEMBERS ONLY
UTILITIES ARE STRONGEST SECTOR OVER LAST 50 DAYS
by Arthur Hill,
Chief Technical Strategist, TrendInvestorPro.com
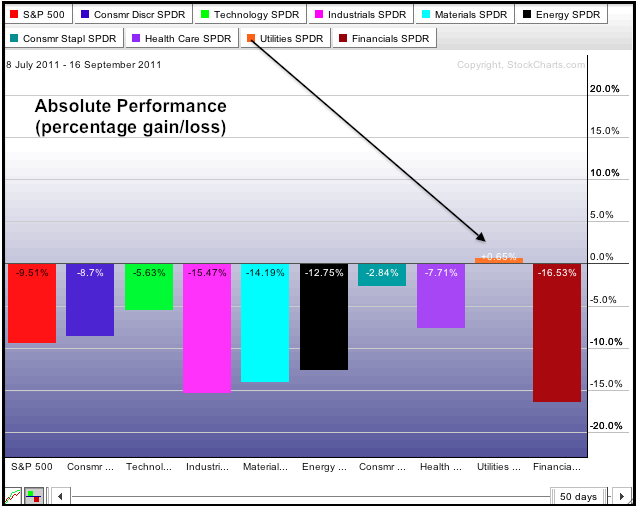
The S&P 500 peaked in early July and declined sharply into early August. There has been a rebound from this low, but all sectors are still down since July 8th - except one. The Utilities SPDR (XLU) is the only sector SPDR showing a gain since July 8th....
READ MORE
MEMBERS ONLY
Utilities SPDR Forms Inverse Head-and-Shoulders Pattern
by Arthur Hill,
Chief Technical Strategist, TrendInvestorPro.com
The Utilities SPDR (XLU) continues to hold up well as it challenges its May-August highs with an inverse Head-and-Shoulders pattern. This also happens to be a bullish continuation pattern. Yes, a Head-and-Shoulders can mark a continuation. Also note that the pattern since late July looks like a cup-with-handle. Either way,...
READ MORE
MEMBERS ONLY
Indicator Summary Remains Negative as Stocks Trade Flat
by Arthur Hill,
Chief Technical Strategist, TrendInvestorPro.com
The indicator summary remains unchanged. Except for the Nasdaq 100 ETF (QQQ) and large techs, stocks have been moving sideways the last several weeks. QQQ is trading at its highest level since August 3rd, but the other major index ETFs remain below their August 31st highs. The same can be...
READ MORE
MEMBERS ONLY
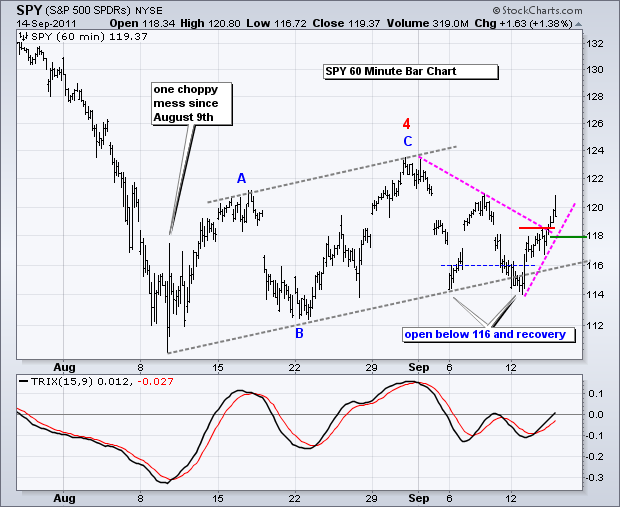
Stocks Extend Short-Term Uptrend as Gold Breaks Support
by Arthur Hill,
Chief Technical Strategist, TrendInvestorPro.com
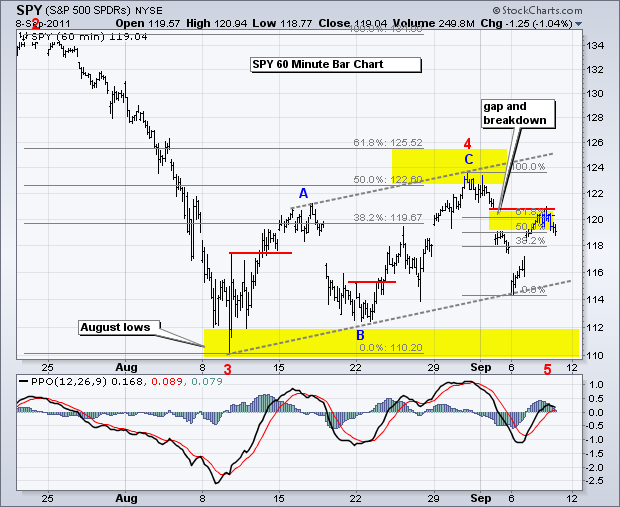
As noted earlier, I view the decline from late July to early August as an impulse move. This means it is a strong move that is part of a bigger trend. In this case it is down. The choppy advance since the second week of August looks like a corrective...
READ MORE
MEMBERS ONLY
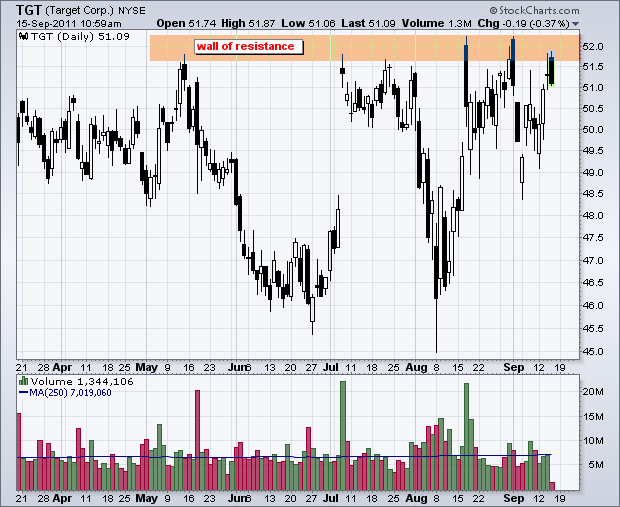
Target Hits a Wall of Resistance
by Arthur Hill,
Chief Technical Strategist, TrendInvestorPro.com
Target (TGT) surged to resistance in the 51.5-52 area for the third time in five weeks and formed a long black candlestick. A black (filled) candlestick means the close or current price is below the open. This means TGT opened at 51.74 on Thursday and moved lower after...
READ MORE
MEMBERS ONLY
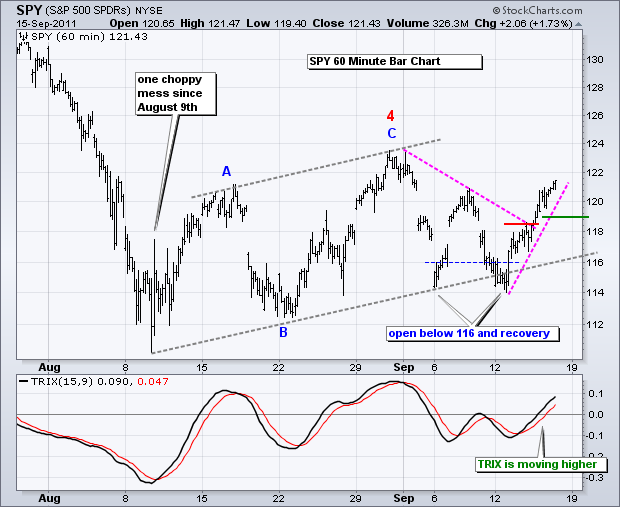
SPY Breaks Short-Term Resistance to Start Upswing
by Arthur Hill,
Chief Technical Strategist, TrendInvestorPro.com
The market is getting knee-deep in hollow rhetoric. Yesterday, Sarkozy and Merkel said they are "convinced that the future of Greece is in the euro zone". Gee, what a surprise. Chinese Premier Wen Jiabao stated that China will do everything in its power to preserve the Euro and...
READ MORE
MEMBERS ONLY
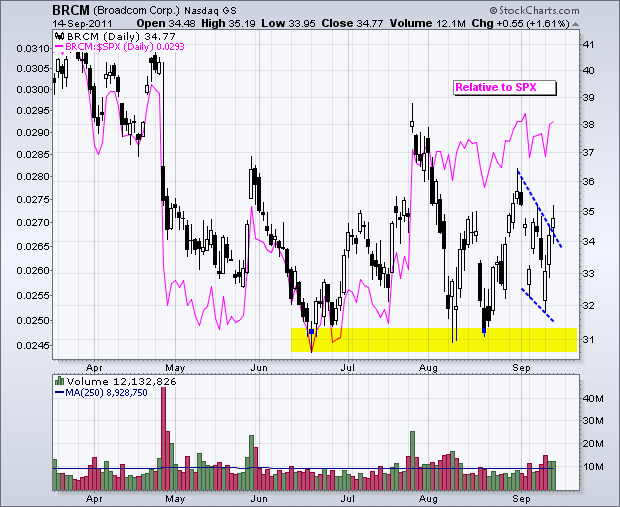
Charts of Interest: BRCM, CVX, DDS, DE, GFI, SVU
by Arthur Hill,
Chief Technical Strategist, TrendInvestorPro.com
BRCM Shows Relative Strength.
DE Forms Falling Wedge Correction.
SVU Forms Bullish Pennant after Surge.
Plus CVX, DDS, GFI
This commentary and charts-of-interest are designed to stimulate thinking. This analysis is not a recommendation to buy, sell, hold or sell short any security (stock ETF or otherwise). We all need...
READ MORE
MEMBERS ONLY
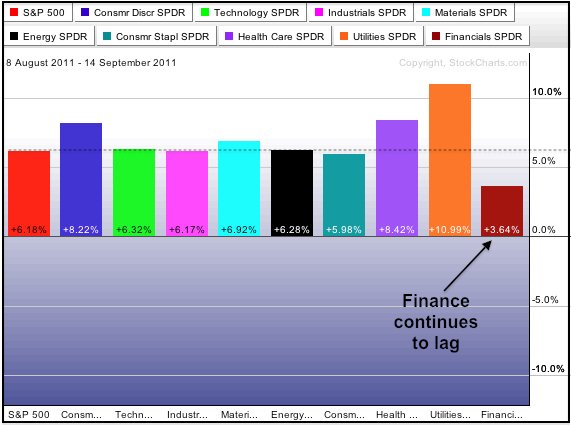
Finance Sector Continues to Lag
by Arthur Hill,
Chief Technical Strategist, TrendInvestorPro.com
Stocks put together a pretty good rally over the last five weeks, but the finance sector continues to show relative weakness. The chart below shows the S&P Sector PerfChart with the percentage gain for the nine sectors and the S&P 500. All nine sectors are keeping...
READ MORE
MEMBERS ONLY
SPY Forms Falling Wedge as GLD Traces a Triangle
by Arthur Hill,
Chief Technical Strategist, TrendInvestorPro.com
Stocks managed a half-hearted bounce on Tuesday for the second up day in a row. This is not bad considering the news backdrop (European debt and banks). Technical analysts are not so much interested in the news, but rather the market's reaction to the news. An advance on...
READ MORE
MEMBERS ONLY
Maxim Breaks August High with Strong Move
by Arthur Hill,
Chief Technical Strategist, TrendInvestorPro.com
Maxim is leading a resurgent semiconductor group with a big surge over the last six days. The stock broke above its August high and exceeded the May trendline. Volume also picked up on the breakout.
Click this image for a live chart...
READ MORE
MEMBERS ONLY
Late Surge Does Not Affect Current Trend for Stocks
by Arthur Hill,
Chief Technical Strategist, TrendInvestorPro.com
After meandering in negative territory most of the day, stocks surged in the final hour to close with small gains. Rumors were swirling that China was going to buy Greece. That's a joke. Expect more market moving rumors as this crisis unfolds. The Russell 2000 ETF (IWM) and...
READ MORE
MEMBERS ONLY
Charts: ADBE, AES, ARUN, DELL, JWN, LTD, LULU, PG
by Arthur Hill,
Chief Technical Strategist, TrendInvestorPro.com
ADBE Consolidates after Gap Up.
DELL Forms Piercing Line at Support.
JWN Hits Resistance at Key Retracement.
Plus AES, ARUN, LTD, LULU, PG
This commentary and charts-of-interest are designed to stimulate thinking. This analysis is not a recommendation to buy, sell, hold or sell short any security (stock ETF or...
READ MORE
MEMBERS ONLY
Altera Forms Big Bullish Engulfing Pattern
by Arthur Hill,
Chief Technical Strategist, TrendInvestorPro.com
Semiconductor stocks showed some relative strength on Monday. Altera (ALTR) participated with a big bullish engulfing on high volume. This is the second high-volume advance in the last five trading days. Look for follow through above resistance at 38 for confirmation.
Click this image for a live chart...
READ MORE
MEMBERS ONLY
Euro Woes Weigh on Stocks and Oil
by Arthur Hill,
Chief Technical Strategist, TrendInvestorPro.com
European banks are in the spot light on Monday. First, speculation is rising that Greece will finally default. Second, the debt agencies are poised to downgrade a number of European (mainly French) banks. Third, there is a clear rift in the European Central Bank (ECB) after the surprise resignation of...
READ MORE
MEMBERS ONLY
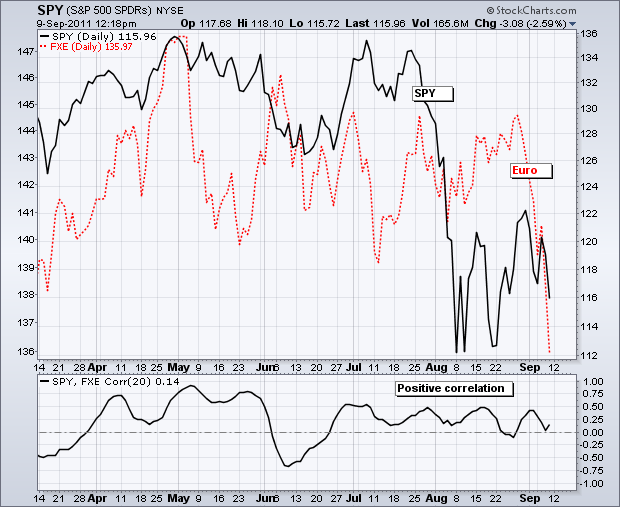
Stocks and Euro Fall Together as Correlation Coefficient Remains Positive $SPY $FXE
by Arthur Hill,
Chief Technical Strategist, TrendInvestorPro.com
The S&P 500 ETF (SPY) and the Euro Currency Trust (FXE) moved sharply lower the last two weeks with the Euro leading the way. FXE is trading below its summer lows and SPY may be about to follow suit. The indicator window shows the SPY:FXE Correlation Coefficient....
READ MORE
MEMBERS ONLY
Drifting Stock Market Leaves Indicator Summary Negative
by Arthur Hill,
Chief Technical Strategist, TrendInvestorPro.com
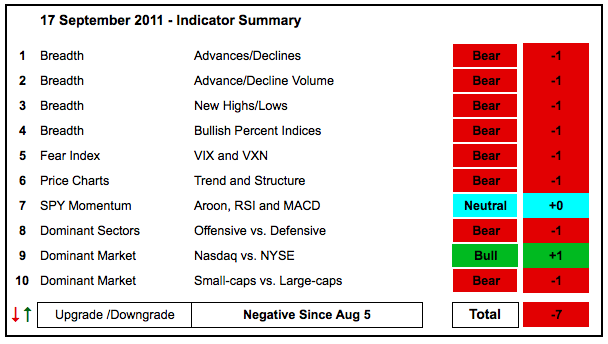
One indicator group was upgraded in the indicator summary. With a surge in the Aroon Oscillator (20), SPY momentum was upgraded from bearish to neutral. The rest remains unchanged, very unchanged. Stocks have been edging higher with choppy trading the last five weeks. This amounts to a consolidation after a...
READ MORE
MEMBERS ONLY
SPY Stalls at Key Retracement as Oil Forms Ascending Triangle
by Arthur Hill,
Chief Technical Strategist, TrendInvestorPro.com
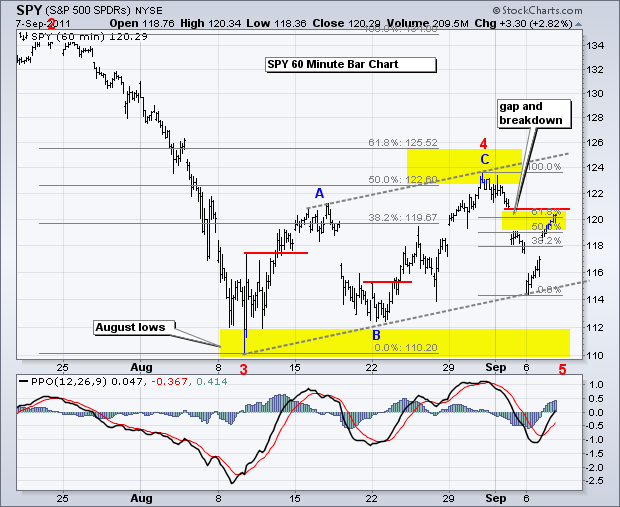
Stimulus-response. The stock market is like an ameba reacting to stimulus pokes from Washington, the Fed and the European Central Bank. Even though nothing is concrete, the market is certainly expecting some stimulus down the road. Sometimes the expectations are better than the real thing. Stocks remain in an uptrend...
READ MORE
MEMBERS ONLY
Steel ETF Remains Range Bound
by Arthur Hill,
Chief Technical Strategist, TrendInvestorPro.com
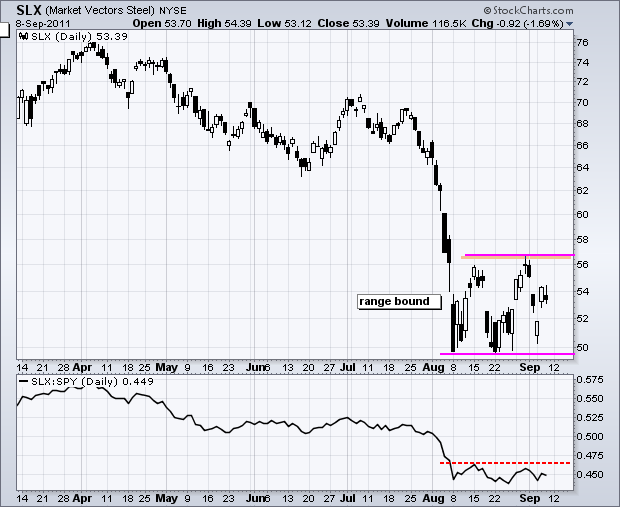
Like many other ETFs and stocks, the Steel ETF (SLX) has been range bound since the early August breakdown. The ETF plunged to 50 in early August and then moved into a trading range the last five weeks. Watch the range boundaries for the next directional clue.
Click this image...
READ MORE
MEMBERS ONLY
Stocks Extend Oversold Surge as GLD Forms Island Reversal
by Arthur Hill,
Chief Technical Strategist, TrendInvestorPro.com
All this stimulus talk has stimulated the bulls. Charles Evens, head of the Chicago Fed, called on stimulus to cut the unemployment rates. Obama will no doubt offer some sort of stimulus plan to create more jobs. The FOMC is also likely to join the party with some sort of...
READ MORE
MEMBERS ONLY
Charts of Interest: CSCO, GGB, MA, NVDA, SVU, WFR
by Arthur Hill,
Chief Technical Strategist, TrendInvestorPro.com
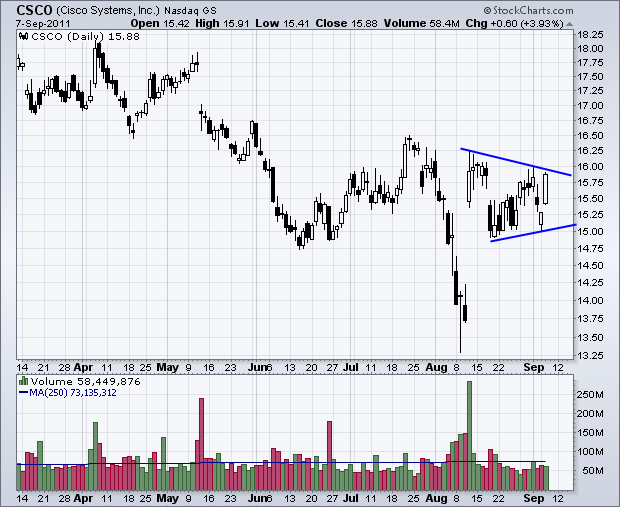
CSCO Forms Pennant after Early August Surge.
MA Breaks Triangle Resistance.
NVDA Gaps above Resistance on Big Volume.
Plus GGB, SVU and WFR.
This commentary and charts-of-interest are designed to stimulate thinking. This analysis is not a recommendation to buy, sell, hold or sell short any security (stock ETF or...
READ MORE
MEMBERS ONLY
Junk Bond ETF Hits Key Retracement with Rising Wedge
by Arthur Hill,
Chief Technical Strategist, TrendInvestorPro.com
The High-Yield Bond SPDR (JNK) broke major support along with the S&P 500 in early August and then rebounded the last five weeks. This rebound formed a rising wedge and retraced 61.80% of the prior decline. Even though the 5-week trend is up, retracement resistance and the...
READ MORE
MEMBERS ONLY
SPY Bounces off Lower Trendline of Rising Channel
by Arthur Hill,
Chief Technical Strategist, TrendInvestorPro.com
A better-than-expected ISM Services report and oversold conditions gave way to a post-open bounce on Monday. The Nasdaq 100 ETF (QQQ) closed a penny higher, but the rest of the major index ETFs closed with small losses. Eight of the nine sectors were down. Only the Healthcare SPDR (XLV) managed...
READ MORE
MEMBERS ONLY
Amazon Flexes Its Muscle by Moving Higher
by Arthur Hill,
Chief Technical Strategist, TrendInvestorPro.com
Stocks rebounded after a sharply lower open on Tuesday, but remain in negative territory overall. Amazon (AMZN) is bucking this trend with a 2+ percent gain. Gaining in the face of weakness shows relative strength.
Click this image for a live chart....
READ MORE
MEMBERS ONLY
Stocks Remain Weak Despite Swiss Intervention
by Arthur Hill,
Chief Technical Strategist, TrendInvestorPro.com
The financial markets are rather chaotic this morning. I say this because there was a dramatic about-face around 4AM ET when the Swiss National Bank announced a "floor" for the Euro. In effect, the Swiss said they would not tolerate a Euro/Swiss rate below 1.20 (1....
READ MORE
MEMBERS ONLY
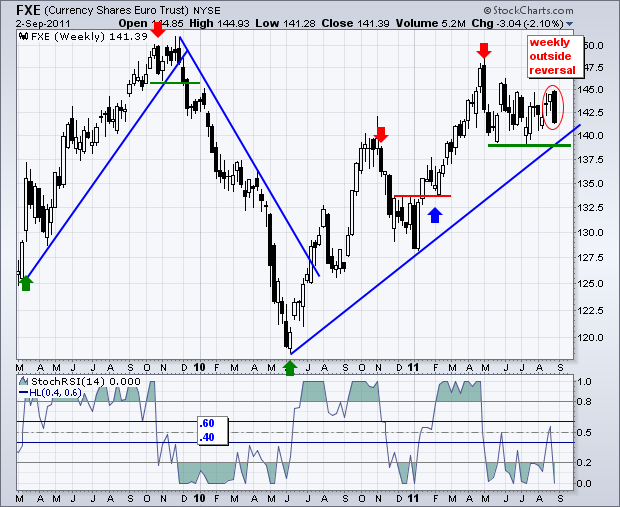
EURO TRUST FORGES OUTSIDE REVERSAL WEEK
by Arthur Hill,
Chief Technical Strategist, TrendInvestorPro.com
The Euro Currency Trust (FXE) opened strong on Monday, but moved lower throughout the week and closed near its low for forge an outside reversal. An outside reversal occurs when the high is above the prior high and the low is below the prior low. A close below the prior...
READ MORE
MEMBERS ONLY
Gold Miners ETF Hits 52-week High
by Arthur Hill,
Chief Technical Strategist, TrendInvestorPro.com
Even though the Gold Miners ETF (GDX) is underperforming gold, it is outperforming the stock market and hitting a fresh 52-week high. The GDX:GLD price relative remains in a downtrend, but the GDX:SPY price relative broke out in July to start an uptrend. After hitting resistance in the...
READ MORE
MEMBERS ONLY
Indicators Improve, but Summary Remains Negative
by Arthur Hill,
Chief Technical Strategist, TrendInvestorPro.com
There is no change in the indicator summary. Many indicators improved over the last few weeks as the major index ETFs broke above their mid August highs. However, this improvement looks like a bear market rally. Net New Highs recovered with a move back to the zero lines. The Bullish...
READ MORE
MEMBERS ONLY
Dollar Breaks Resistance as SPY Backs off Retracement Zone
by Arthur Hill,
Chief Technical Strategist, TrendInvestorPro.com
After an ISM pop in the morning, stocks were hit with a dose of selling pressure and closed weak. Even though the ISM Index was better-than-expected, it was still weak overall and at a two year low. Anything above 50 indicates expansion, but a reading of 50.6 indicates little...
READ MORE
MEMBERS ONLY
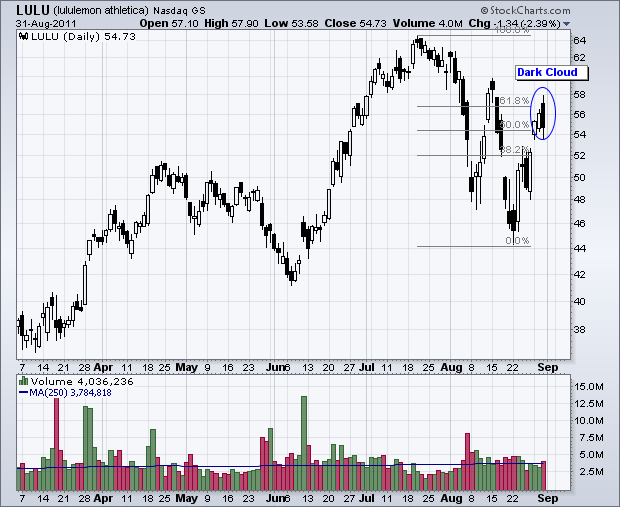
Lululemon Forms Dark Cloud at Key Retracement
by Arthur Hill,
Chief Technical Strategist, TrendInvestorPro.com
High flyer Lululemon (LULU) surged over 20% the last seven days, but hit a resistance zone around 57 with a Dark Cloud pattern. Notice that this area also marks a 61.80% retracement of the July-August decline. A move below the gap at 53 would confirm the Dark Cloud pattern....
READ MORE
MEMBERS ONLY
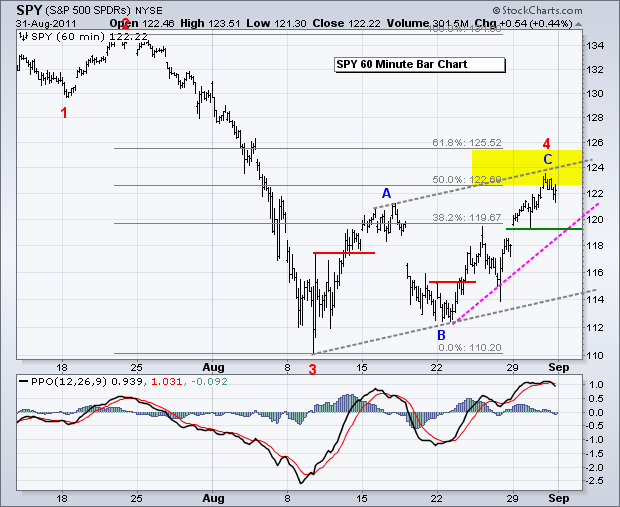
SPY Hits Retracement Zone Resistance as Dollar Strengthens
by Arthur Hill,
Chief Technical Strategist, TrendInvestorPro.com
The bulls weakened a bit on Wednesday, but stocks still managed gains overall. There were pockets of weakness with the Russell 2000 ETF (IWM) and Technology ETF (XLK) edging lower. The Finance SPDR (XLF) continued its run with a 1.29% gain to lead all sectors. Semis were under pressure...
READ MORE