MEMBERS ONLY
QQQ and IWM Lead Market Lower with Support Breaks
by Arthur Hill,
Chief Technical Strategist, TrendInvestorPro.com
Most of the action on Monday took place outside of the S&P 500 ETF (SPY). In particular, the Nasdaq 100 ETF (QQQ) broke support with a sharp decline led by large-cap tech stocks. Apple (AAPL) and Google were down over 2% and Amazon (AMZN) was down almost...
READ MORE
MEMBERS ONLY
Charts of Interest: ANF, FAST, HD, MAS, SBUX, STT
by Arthur Hill,
Chief Technical Strategist, TrendInvestorPro.com
FAST Forms Tight Triangle. HD Nears Support Zone. STT Stalls at Key Retracement. Plus ANF, MAS, SBUX
This commentary and charts-of-interest are designed to stimulate thinking. This analysis is not a recommendation to buy, sell, hold or sell short any security (stock ETF or otherwise). We all need...
READ MORE
MEMBERS ONLY
Steel ETF Tests Double Top Low
by Arthur Hill,
Chief Technical Strategist, TrendInvestorPro.com
The Steel ETF (SLX) traced out a double top with two relatively equal highs this year. The intermittent low formed in March to mark key support for this pattern. SLX closed right at this low on Friday for an important test. A break below this level would confirm the double...
READ MORE
MEMBERS ONLY
Battle of the Consolidations for SPY IWM and QQQ
by Arthur Hill,
Chief Technical Strategist, TrendInvestorPro.com
Today we will just go straight to the 60-minute charts to review the current consolidations in the Nasdaq 100 ETF (QQQ), Russell 2000 ETF (IWM) and S&P 500 ETF (SPY). Stocks became overbought after surging from mid April to early May. These overbought conditions were worked off...
READ MORE
MEMBERS ONLY
Energy Sector Weighs on Amex in May
by Arthur Hill,
Chief Technical Strategist, TrendInvestorPro.com
Of the five broad market indices, the Amex is the weakest due to declines in energy related shares this month. The Amex is heavily weighted towards the energy sector. The NY Composite ($NYA) is the second weakest index. $NYA is heavily weighted towards the finance sector, which has also been...
READ MORE
MEMBERS ONLY
Fewer Net New Highs Could Foreshadow a Correction
by Arthur Hill,
Chief Technical Strategist, TrendInvestorPro.com
Some signs of weakness are creeping into the market, but the bulk of the evidence remains bullish at this point. The major index ETFs recorded 52-week highs in April, the NYSE AD Line hit a 52-week high this week and the Nasdaq AD Volume Line is challenging its...
READ MORE
MEMBERS ONLY
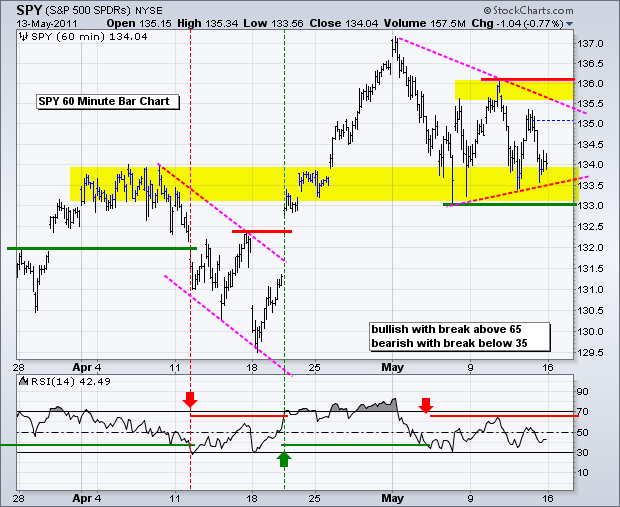
SPY Forms Triangle Just Above Support Zone
by Arthur Hill,
Chief Technical Strategist, TrendInvestorPro.com
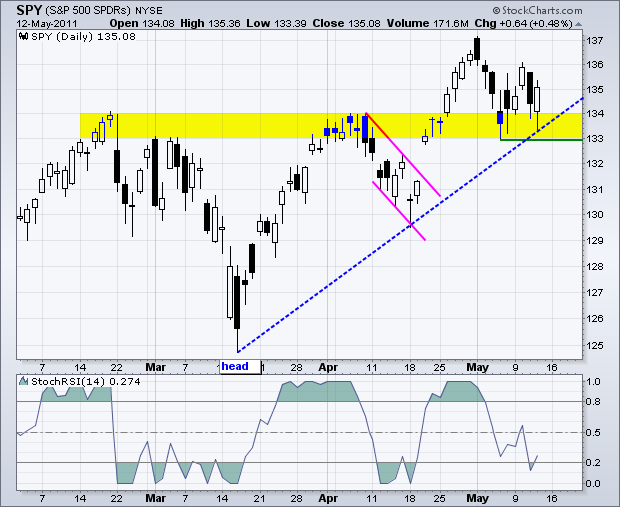
There is no change on the daily chart, which remains in an uptrend overall. SPY broke a resistance zone and this zone turned into a short-term support zone. So far, the support zone is holding as the ETF bounced off the 133-134 area twice in the last two...
READ MORE
MEMBERS ONLY
Parallel Aroon Indicators Reflect Consolidation in LMT
by Arthur Hill,
Chief Technical Strategist, TrendInvestorPro.com
Even though Lockheed Martin (LMT) edged higher the last few weeks, both Aroon Up (green) and Aroon (down) moved lower. Also notice that they are parallel and relatively close together. This affirms the consolidation in LMT. The first indicator to move above 50 will trigger the next signal. You can...
READ MORE
MEMBERS ONLY
Risk Off Trade Returns as SPY Fails after Short Bounce
by Arthur Hill,
Chief Technical Strategist, TrendInvestorPro.com
Stocks are moving in sync with the Euro and commodities, both of which have been falling this month. The Euro is under pressure with concerns over Greek debt. Oil is under pressure because the Dollar is rising and stocks have weakened this month. US Treasuries are attracting money as a...
READ MORE
MEMBERS ONLY
Charts of Interest: AN, CVX, GE, JPM, LEN, LMT, RTN, TIF
by Arthur Hill,
Chief Technical Strategist, TrendInvestorPro.com
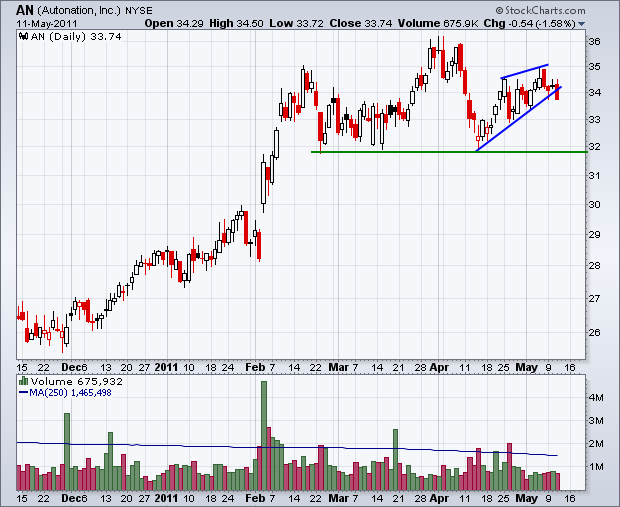
AN Breaks Wedge Support.
JPM Breaks Pennant Support.
RTN Consolidates after Support Break.
Plus CVX, GE,LEN, LMT, TIF
See ChartSchool article on Aroon for more details.
***********************************************
This commentary and charts-of-interest are designed to stimulate thinking. This analysis is not a recommendation to buy, sell, hold or sell...
READ MORE
MEMBERS ONLY
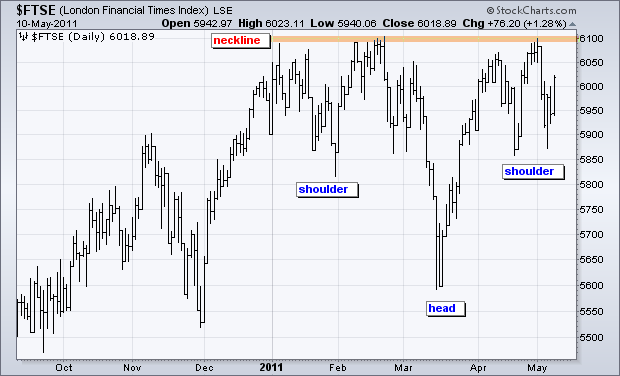
FTSE Forms Inverse Head-and-shoulders Pattern
by Arthur Hill,
Chief Technical Strategist, TrendInvestorPro.com
The London FTSE 100 ($FTSE) found support near its January-February lows over the last few weeks. With a deeper dip in March, an inverse head-and-shoulders pattern is taking shape in 2011. A break above 6100 (neckline) would signal a continuation higher.
Click this image for a live...
READ MORE
MEMBERS ONLY
SPY Gets Bounce off Broken Resistance
by Arthur Hill,
Chief Technical Strategist, TrendInvestorPro.com
There is no change on the daily chart as SPY affirmed support at 133 with a bounce over the last few days. On the 60-minute chart, SPY pulled back rather sharply after the breakout surge last week, but ultimately held support and moved above 135.5 today. The short-...
READ MORE
MEMBERS ONLY
Commodity ETF Gets Oversold Bounce off Support $DBC
by Arthur Hill,
Chief Technical Strategist, TrendInvestorPro.com
After becoming oversold last week, the DB Commodity Index Fund ($DBC) bounced off support with a long white candlestick. Notice that an inverted hammer formed on Friday as RSI dipped below 30 (oversold). Broken support turns into the first resistance area around 30.50.
Click this image for a live...
READ MORE
MEMBERS ONLY
Charts: AAPL, ADBE, AMKR, CPWR, FISV, JBL, SSP, SYK, TIN
by Arthur Hill,
Chief Technical Strategist, TrendInvestorPro.com
ADBE Breaks Wedge Trendline. CPWR Consolidates after Gap. FISV Forms Pennant after Sharp Decline. AAPL, AMKR, FISV, JBL, SSP, SYK, TIN
***********************************************
This commentary and charts-of-interest are designed to stimulate thinking. This analysis is not a recommendation to buy, sell, hold or sell short any security (stock ETF or...
READ MORE
MEMBERS ONLY
SPY Gets Small Bounce off Broken Resistance
by Arthur Hill,
Chief Technical Strategist, TrendInvestorPro.com
There is no real change on the daily chart as SPY continues to firm at broken resistance, which turns into support. The ETF formed two spinning tops on Thursday-Friday and a small white candlestick on Monday. The bounce was rather feeble, but support is holding nonetheless. So far the...
READ MORE
MEMBERS ONLY
Energy Goes from Leader to Laggard $XLE
by Arthur Hill,
Chief Technical Strategist, TrendInvestorPro.com
The Energy SPDR (XLE) is still one of the leading sectors in 2011, but the ETF has started showing relative weakness over the last 30 trading days. The PerfChart below shows XLE as the weakest of the nine sectors since March 25th. All sectors are up, but XLE is down...
READ MORE
MEMBERS ONLY
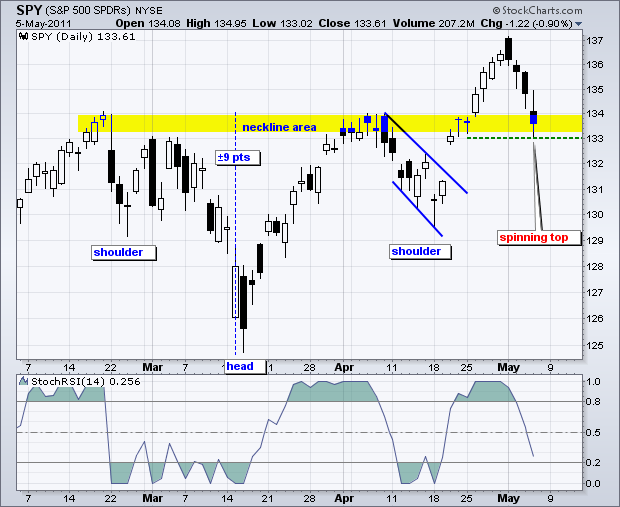
SPY Firms with Two Spinning Tops at Support
by Arthur Hill,
Chief Technical Strategist, TrendInvestorPro.com
SPY declined to support and firmed with two spinning tops at the end of the week. These candlesticks have relatively long shadows with a small body. The shadows represent the high and low, while the body represents the open and close. Even though SPY firmed with these spinning tops, we...
READ MORE
MEMBERS ONLY
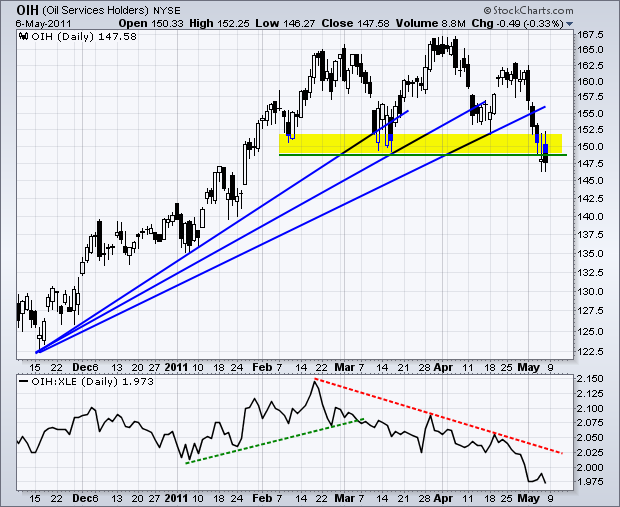
OIH Breaks Support as it Leads XLE Lower
by Arthur Hill,
Chief Technical Strategist, TrendInvestorPro.com
The Oil Service HOLDRS (OIH) is leading the energy sector lower with a break below the March lows. There are two bearish patterns working on the OIH price chart. First, OIH hit resistance in the 162.5-167.5 area with three reaction highs and then broke below support with...
READ MORE
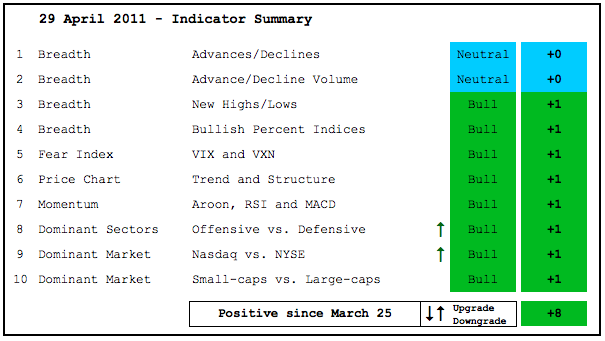
MEMBERS ONLY
Indicator Summary Remains Positive Despite Concerns
by Arthur Hill,
Chief Technical Strategist, TrendInvestorPro.com
The bulk of the evidence remains bullish, but there are signs of dissent brewing out there. The bulls control the trends as the major index ETFs hit new highs in April. The AD Volume Lines are also strong and the Net New Highs Lines have yet to break down. Relative...
READ MORE
MEMBERS ONLY
Indicator Summary Update on Saturday, May 7th
by Arthur Hill,
Chief Technical Strategist, TrendInvestorPro.com
I will wait for Friday's reaction to the employment report before updating the indicator summary. The breadth charts and intermarket charts will also be updated on Saturday morning....
READ MORE
MEMBERS ONLY
SPY Forms Spinning Top in Support Zone
by Arthur Hill,
Chief Technical Strategist, TrendInvestorPro.com
Admittedly, the decline over the last four days has been sharper than expected for a mere pullback. This decline started right after Monday's gap open around 137. On a high to low basis, the ETF moved from 137 to 133 in just four days (almost 3%). And now...
READ MORE
MEMBERS ONLY
SPY on the Verge of Weekly Bearish Engulfing Pattern
by Arthur Hill,
Chief Technical Strategist, TrendInvestorPro.com
With a strong open on Monday and weakness the rest of the week, the S&P 500 ETF (SPY) formed a long black candlestick that engulfed the prior white candlestick. The week is not yet finished because Friday remains. A close below last week's open would forge...
READ MORE
MEMBERS ONLY
Euro Plunges after New High
by Arthur Hill,
Chief Technical Strategist, TrendInvestorPro.com
The Euro Currency Trust (FXE) hit a new 52-week high Wednesday, but gave it all back with a sharp decline early Thursday. As of 11AM ET Thursday, FXE is down around 2% from Wednesday's high. That's quite a drop. Support, however, is near as the...
READ MORE
MEMBERS ONLY
SPY Nears Support Zone with Falling Flag
by Arthur Hill,
Chief Technical Strategist, TrendInvestorPro.com
SPY continued its throwback with a close below 135 and the third down day in a row. This does nothing to change the medium-term trend, which remains up. The gap and flag breakout started it all and the inverse head-and-shoulders breakout forged a new 52-week high....
READ MORE
MEMBERS ONLY
Charts of Interest: AAPL, CSCO, F, FFIV, KLAC, MSFT, NTAP
by Arthur Hill,
Chief Technical Strategist, TrendInvestorPro.com
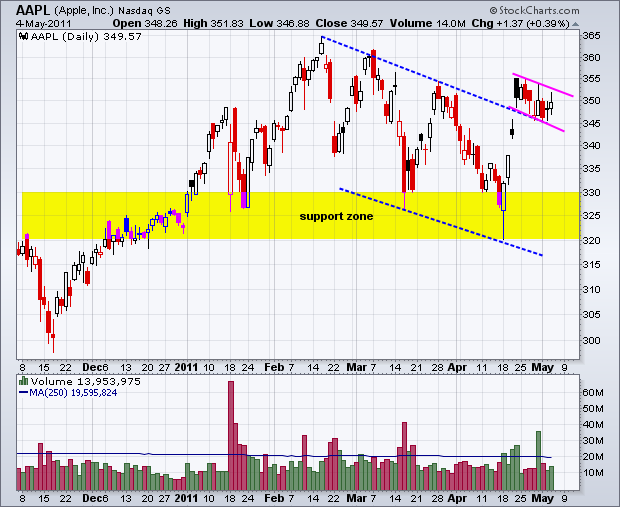
AAPL Forms Bull Flag after Breakout.
KLAC Firms at Fibonacci Retracement.
CSCO Traces out Pennant Consolidation.
Plus F, FFIV,MSFT,NTAP.
***********************************************
This commentary and charts-of-interest are designed to stimulate thinking. This analysis is not a recommendation to buy, sell, hold or sell short any security (stock ETF or...
READ MORE
MEMBERS ONLY
Hanging Man and Bearish Engulfing Weigh on XLF
by Arthur Hill,
Chief Technical Strategist, TrendInvestorPro.com
After a bounce off support in April, the Finance SPDR (XLF) came under pressure with a hanging man at the end of April and a bearish engulfing at the beginning of May. These two bearish candlesticks affirm resistance from the early May high. It is possible that a falling flag...
READ MORE
MEMBERS ONLY
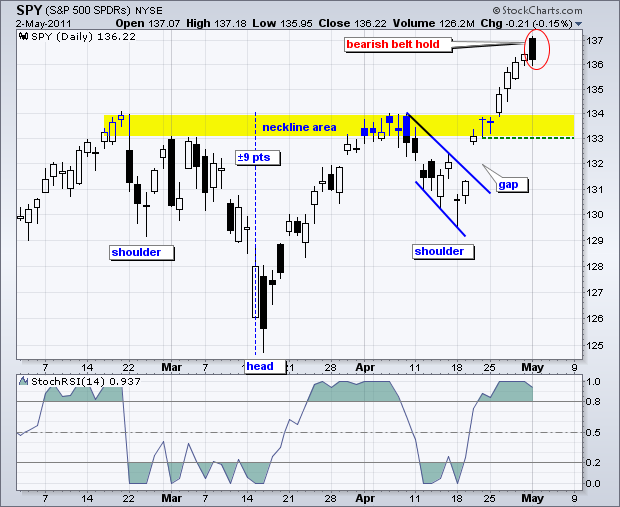
SPY Moves into Throwback Mode
by Arthur Hill,
Chief Technical Strategist, TrendInvestorPro.com
SPY followed through on Monday's bearish Belt Hold candlestick with a decline on Tuesday. The ETF dipped all the way to 135, but a late afternoon bounce pushed it back to 135.73 by the close. The decline to 135 was not a very deep dip - yet buyers...
READ MORE
MEMBERS ONLY
HBAN Battles Resistance with a little Relative Strength
by Arthur Hill,
Chief Technical Strategist, TrendInvestorPro.com
After going nowhere for two months, Huntington Bancshares (HBAN) is once again battling consolidation resistance. The stock has been stuck between 6.3 and 6.9 since the beginning of March. With the market down sharply on Tuesday, the stock is showing some resilience with a small gain. A break...
READ MORE
MEMBERS ONLY
SPY Forms Bearish Belt Hold Pattern
by Arthur Hill,
Chief Technical Strategist, TrendInvestorPro.com
Despite a strong open and weak close on Monday, the overall picture for SPY remains unchanged. A bearish Belt Hold formed on Monday. These are long black candlesticks that form after an advance. Neckline resistance from the inverse head-and-shoulders breakout turns into the first support zone to watch...
READ MORE
MEMBERS ONLY
Charts of Interest: ACI, BSX, CAKE, GCI, LEN, NFLX
by Arthur Hill,
Chief Technical Strategist, TrendInvestorPro.com
ACI Forms Bear Wedge. CAKE Gaps Down from Resistance. GCI Breaks Flag Resistance. Plus BSX,LEN and NFLX.
-----------------------------------------------------------------------------
This commentary and charts-of-interest are designed to stimulate thinking. This analysis is not a recommendation to buy, sell, hold or sell short any security (stock ETF or otherwise). We all...
READ MORE
MEMBERS ONLY
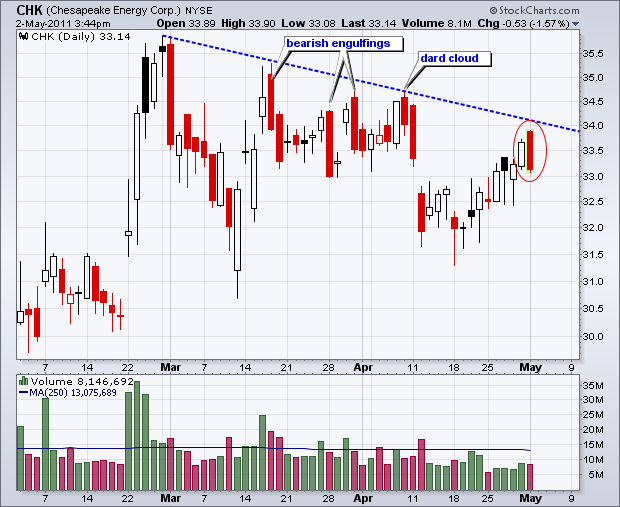
Bearish Engulfing Patterns Pile up for $CHK
by Arthur Hill,
Chief Technical Strategist, TrendInvestorPro.com
After surging in late February, Chesapeake (CHK) worked its way lower with three bearish engulfings and a dark cloud pattern. The April bounce above 33.5 may be stymied as the stock formed another bearish engulfing on Monday. Check out our bearish engulfing scan for more.
Click this image for...
READ MORE
MEMBERS ONLY
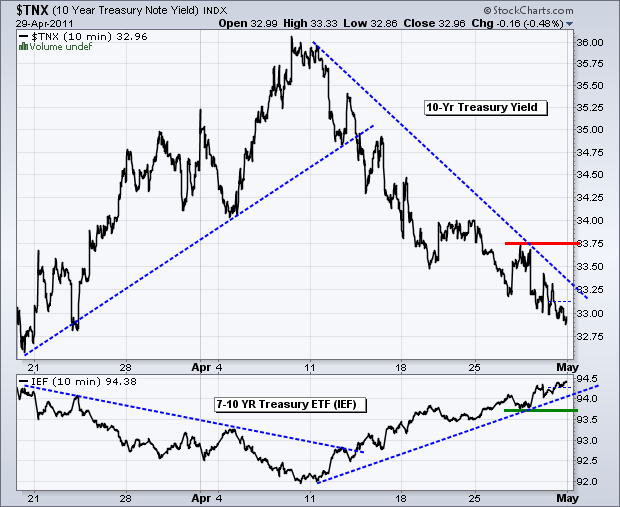
Stocks and Bonds Show No Weakness
by Arthur Hill,
Chief Technical Strategist, TrendInvestorPro.com
It is a strange pairing, but stocks and bonds are both in strong uptrends. We can also throw in strong uptrends for gold, oil and the Euro. The Dollar is the one left out in the cold with a strong downtrend. The rally in bonds is a bit perplexing. QE2...
READ MORE
MEMBERS ONLY
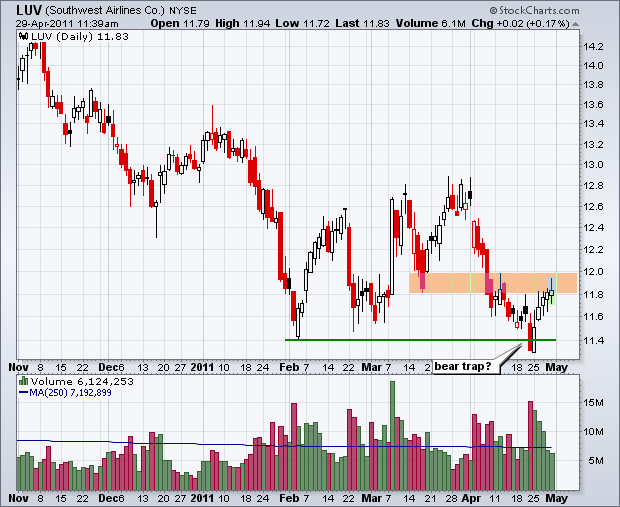
LUV Forges Bear Trap with Failed Support Break
by Arthur Hill,
Chief Technical Strategist, TrendInvestorPro.com
Southwest Airlines (LUV) broke support with high volume in late April, but quickly recovered this support break with a surge back above 11.60 the last few days. Despite this quick recovery, signs of indecision are showing with the upper shadows in the candlesticks. There is a resistance zone around...
READ MORE
MEMBERS ONLY
Relative Strength in Techs Boosts Indicator Summary
by Arthur Hill,
Chief Technical Strategist, TrendInvestorPro.com
Even though the finance sector remains a laggard, newfound relative strength in technology is picking up the slack. Led by semis, the Nasdaq and the Technology ETF (XLK) surged almost 5% the last seven trading days. Renewed leadership from techs is a positive for the market overall. There is some...
READ MORE
MEMBERS ONLY
SPY Builds on Breakouts
by Arthur Hill,
Chief Technical Strategist, TrendInvestorPro.com
There is no change on the daily chart or 60-minute chart as SPY extends after its breakouts. Broken neckline resistance becomes the first support level to watch on the daily chart.
Key Economic Reports/Events:
Fri - Apr 29 - 08:30 - Personal Income and Spending
Fri - Apr 29 - 09:45...
READ MORE
MEMBERS ONLY
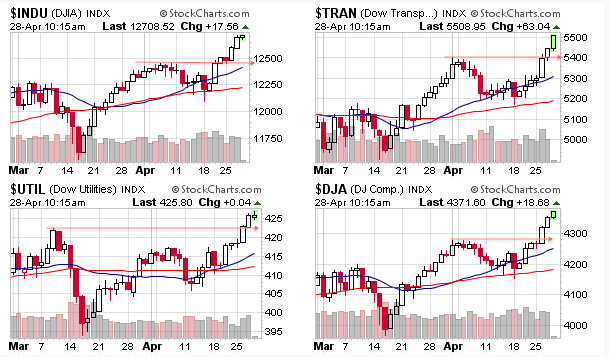
All Four Dow Averages Hit New Highs
by Arthur Hill,
Chief Technical Strategist, TrendInvestorPro.com
The Dow Industrials, Dow Transports, Dow Utilities and Dow Composite all broke above their March-April highs and recorded 52-week highs this week. From a Dow Theory stand point, the new highs in the Industrials and Transports are especially promising because they affirm the uptrend.
Click this image for...
READ MORE
MEMBERS ONLY
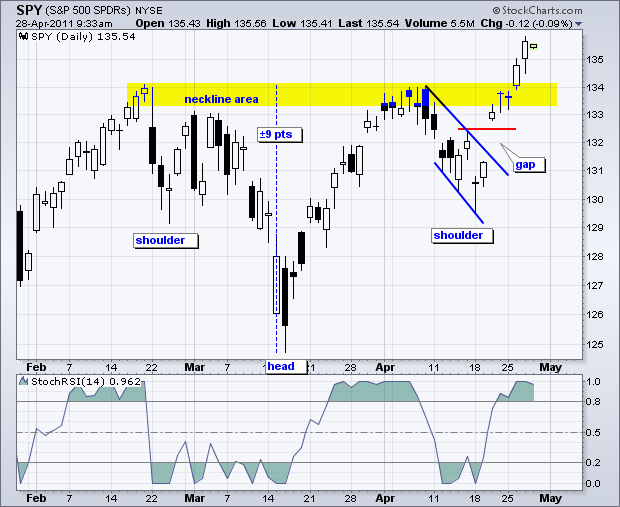
Neckline Resistance Turns First Support for SPY
by Arthur Hill,
Chief Technical Strategist, TrendInvestorPro.com
There is no change on the daily chart. The S&P 500 ETF (SPY) broke above neckline resistance that extends from late February to early April. This is another 52-week high that simply re-affirms the long-term uptrend. Traditionally, broken resistance turns into support. This suggests that...
READ MORE
MEMBERS ONLY
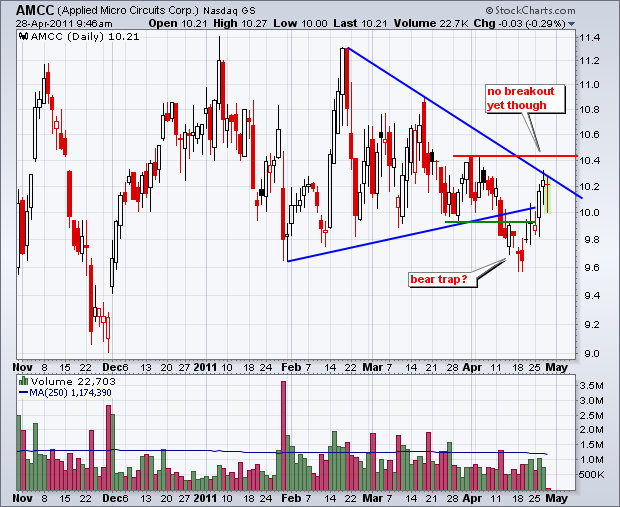
Charts: AMCC, ASEI, GCI, IDCC, ISRG, ORLY, PNRA
by Arthur Hill,
Chief Technical Strategist, TrendInvestorPro.com
ASEI Hits Broken Resistance with Wedge. GCI Surges on Big Volume and then Consolidates. PNRA Declines on High Volume. Plus AMCC,IDCC,ISRG,ORLY
-----------------------------------------------------------------------------
This commentary and charts-of-interest are designed to stimulate thinking. This analysis is not a recommendation to buy, sell, hold or sell short any security...
READ MORE
MEMBERS ONLY
Semiconductor HOLDRS Challenges 2011 Highs SMH
by Arthur Hill,
Chief Technical Strategist, TrendInvestorPro.com
It all started with the Intel earnings effect five days ago as the Semiconductor HOLDRS (SMH) gapped above 35. After stalling for two days, the ETF continued hiher and is now challenging the February-March highs. Semis are starting to show relative strength again and this bodes well for techs....
READ MORE
MEMBERS ONLY
SPY Breaks Neckline Resistance ahead of Fed Announcement
by Arthur Hill,
Chief Technical Strategist, TrendInvestorPro.com
Please note that Thursday's commentary will be posted a little later in the morning (between 9 and 10AM ET). With a strong open and strong close, the S&P 500 ETF (SPY) broke above neckline resistance that extends from late February to early April. This is another...
READ MORE