MEMBERS ONLY
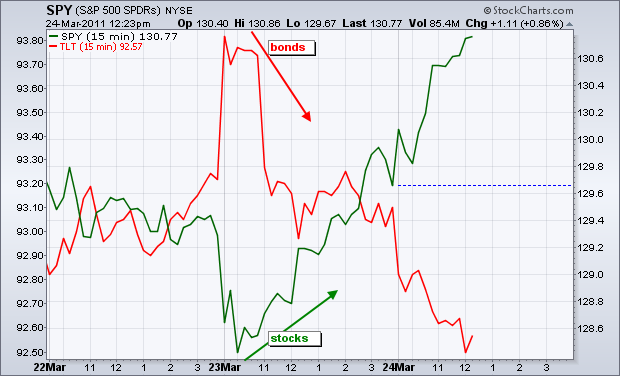
Stocks and Bonds Go Their Separate Ways
by Arthur Hill,
Chief Technical Strategist, TrendInvestorPro.com
After a gap down and weak open on Wednesday, the stock bulls found their wind and pushed stocks higher. At the same time, the bond bulls lost their wind as the 20+ year Bond ETF (TLT) moved sharply lower.
Click this image for a live chart...
READ MORE
MEMBERS ONLY
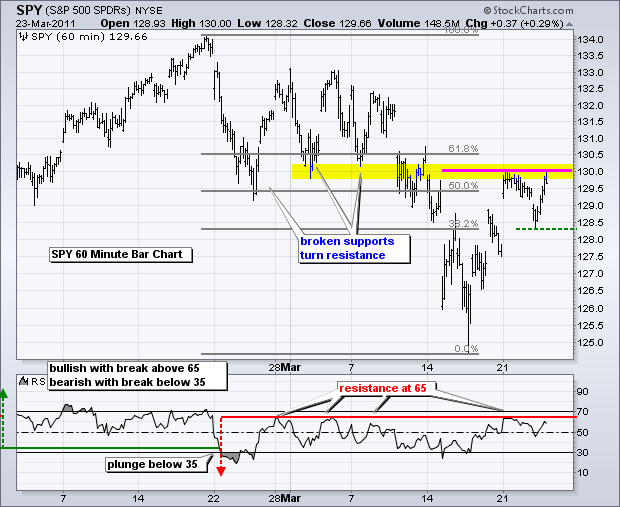
SPY Battles Broken Support and Key Retracement
by Arthur Hill,
Chief Technical Strategist, TrendInvestorPro.com
The bulls simply refuse to give up. SPY opened lower with a gap below 129, but the bulls quickly entered the market and pushed stocks higher. SPY surged back to Monday's high, DIA exceeded Monday's high and tech stocks showed relative strength on Wednesday. With yesterday&...
READ MORE
MEMBERS ONLY
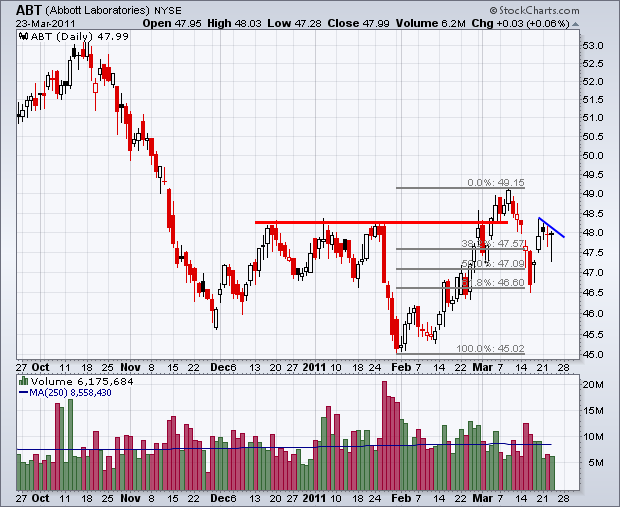
Charts of Interest: ABT, ACI, ATVI, DELL, F, MSFT, XLF, XRT
by Arthur Hill,
Chief Technical Strategist, TrendInvestorPro.com
ABT Bounces off Key Retracement. ACI Challenges Resistance. MSFT Breaks Wedge Trendline. Plus ATVI, DELL, F, XLF, XRT
-----------------------------------------------------------------------------
This commentary and charts-of-interest are designed to stimulate thinking. This analysis is not a recommendation to buy, sell, hold or sell short any security (stock ETF or otherwise). We all need...
READ MORE
MEMBERS ONLY
Comparing Candlesticks for SPY and $SPX - SPY Reflects a True Open
by Arthur Hill,
Chief Technical Strategist, TrendInvestorPro.com
Even though the S&P 500 and the S&P 500 ETF (SPY) track quite well over the medium-term and long-term, daily candlestick action can be quite different. The S&P 500 is an index that prints a price seconds after the market open. More often than...
READ MORE
MEMBERS ONLY
Retail SPDR Holds Support with Bullish Wedge $XRT
by Arthur Hill,
Chief Technical Strategist, TrendInvestorPro.com
The Retail SPDR (XRT) held up quite well in March as broken resistance turned into support at 47.5 the last few weeks. After a surge in early February, a falling wedge evolved and the ETF established resistance at 49.10 this week. A move above this level would break...
READ MORE
MEMBERS ONLY
A Bull Flag or Failure at Resistance for SPY
by Arthur Hill,
Chief Technical Strategist, TrendInvestorPro.com
On the daily chart, SPY surged from ±125 to ±130 with two black candlesticks and a small white candlestick. There were three strong opens, but the ETF moved lower after the first two gaps (Thursday-Friday) and barely advanced after Monday's gap. As noted yesterday, this is uninspiring candlestick...
READ MORE
MEMBERS ONLY
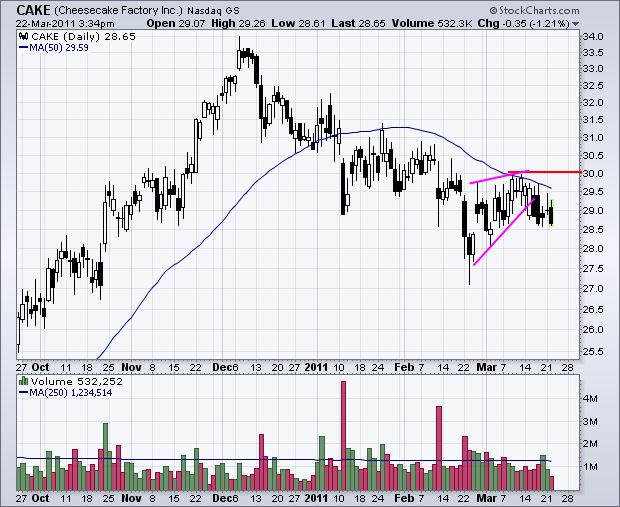
CAKE Meets Resistance at the 50-day SMA
by Arthur Hill,
Chief Technical Strategist, TrendInvestorPro.com
Sometimes the 50-day SMA works like a charm for support/resistance and other times not. Cheesecake Factory (CAKE) appears to be in the former category. The stock formed a rising wedge in March, met resistance at the 50-day last week and turned lower the last four days.
Click this image...
READ MORE
MEMBERS ONLY
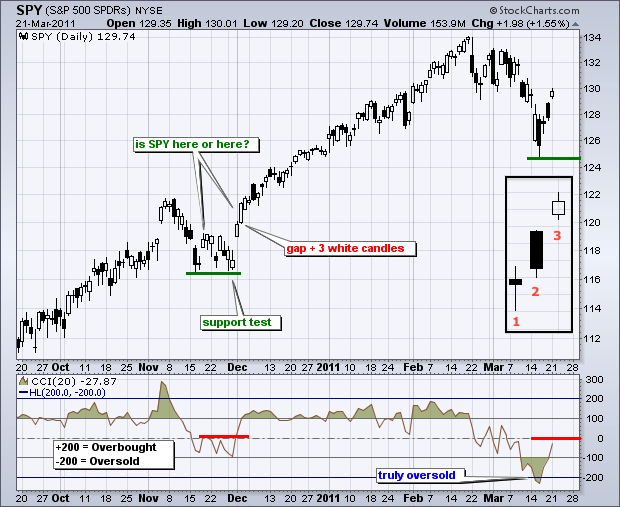
SPY Bounces to Resistance with Uninspiring Candlesticks
by Arthur Hill,
Chief Technical Strategist, TrendInvestorPro.com
SPY surged over the last three days, but the last three candlesticks show hesitation that could foreshadow a test of last week's lows. Looking back at November, we can see a gap and then a test of the mid November lows with a pullback later that month. The...
READ MORE
MEMBERS ONLY
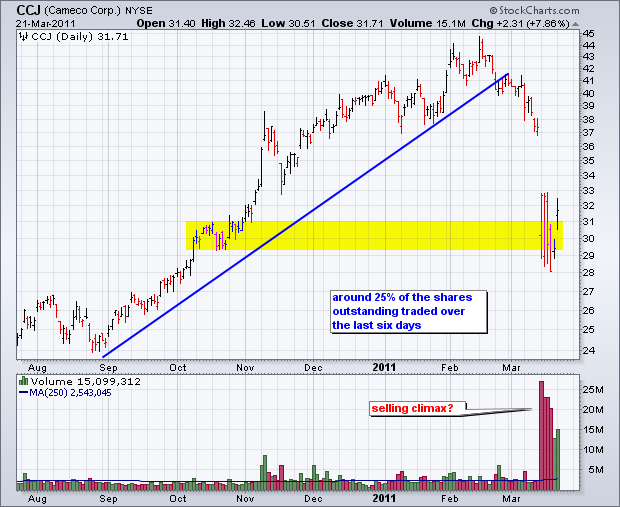
Charts: CCJ, CL, CRM, DHI, F, NVDA, RHT, X
by Arthur Hill,
Chief Technical Strategist, TrendInvestorPro.com
CCJ Trades 25% of Float. CL Surges off Gap Support. CRM Firms at Key Retracement. Plus DHI, F, NVDA, RHT and X
-----------------------------------------------------------------------------
This commentary and charts-of-interest are designed to stimulate thinking. This analysis is not a recommendation to buy, sell, hold or sell short any security (stock ETF or...
READ MORE
MEMBERS ONLY
Intuit Forges Higher Low with High Volume Gap Up
by Arthur Hill,
Chief Technical Strategist, TrendInvestorPro.com
Intuit (INTU) surged on Friday with a nice gap on the highest volume of the month. With a higher low forming around 48, the overall uptrend remains in place. As they say on the London Tube: mind the gap. This gap is bullish as long as it holds. A move...
READ MORE
MEMBERS ONLY
Broken Supports Mark First Resistance for Oversold Bounce
by Arthur Hill,
Chief Technical Strategist, TrendInvestorPro.com
Even though the indicator summary turned negative on Friday (minus 3) for the first time since September 3rd, the decline over the last four weeks is still considered a correction within a bigger uptrend. This 6% decline follows a 13.5% advance since late November and a 30% advance since...
READ MORE
MEMBERS ONLY
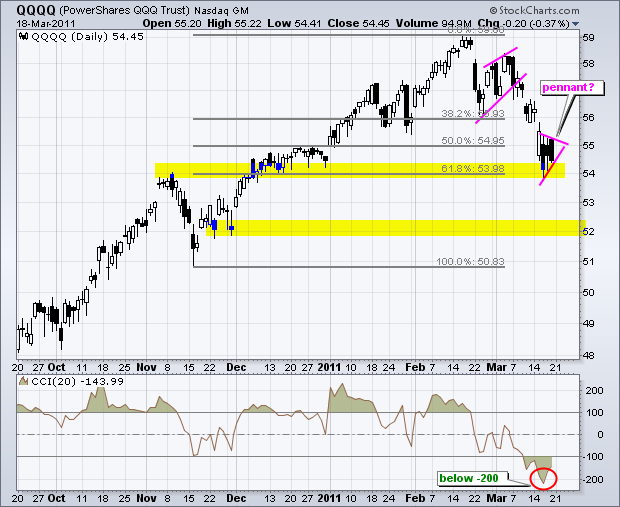
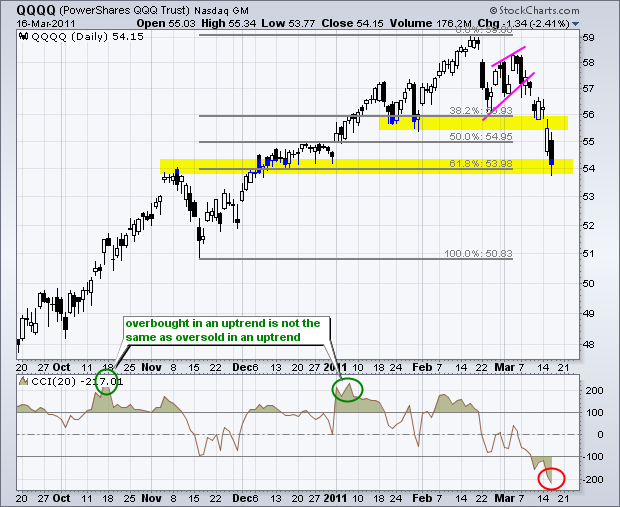
QQQQ and IWM Form Pennants at Potential Support Levels
by Arthur Hill,
Chief Technical Strategist, TrendInvestorPro.com
With big declines on Wednesday, the Nasdaq 100 ETF (QQQQ) and the Russell 2000 ETF (IWM) both became oversold and hit potential support zones. The first chart shows QQQQ hitting support around 54 after an 8+ percent decline the last few weeks. This decline pushed the Commodity Channel Index (CCI)...
READ MORE
MEMBERS ONLY
DJ Stoxx 50 Index Hits Support from Key Retracement
by Arthur Hill,
Chief Technical Strategist, TrendInvestorPro.com
After falling off the cliff the last few weeks, the DJ Stoxx 50 Index hit support from a familiar retracement. The decline to around 2460 retraced 62% of the prior advance. There is also support in this area from the October-November lows. The European stock index bounced off support on...
READ MORE
MEMBERS ONLY
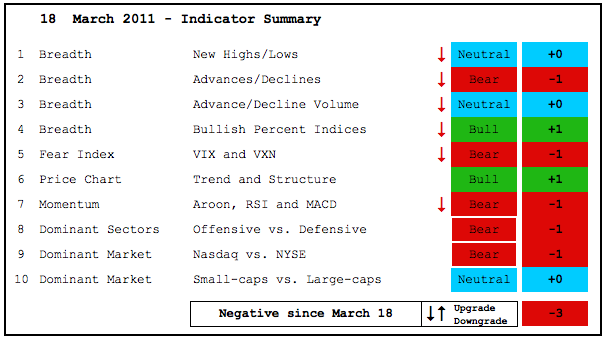
Indicator Summary Turns Negative
by Arthur Hill,
Chief Technical Strategist, TrendInvestorPro.com
After a positive run from September 3rd, the indicator summary turned negative this week with six indicator downgrades. At this point, I still view the recent decline as a correction within a bigger uptrend. However, we do not know how this correction will unfold or how long it will last....
READ MORE
MEMBERS ONLY
Estimating Resistance for an Oversold Bounce in SPY
by Arthur Hill,
Chief Technical Strategist, TrendInvestorPro.com
The analysis in this daily report on Art's Charts is short-term oriented, which can be from a few days to a few weeks. Medium and long-term analysis can be found in the Market Message, which is produced by John Murphy and myself. The Friday indicator summary on Art&...
READ MORE
MEMBERS ONLY
Retail SPDR Tests Resistance Breakout with Falling Wedge
by Arthur Hill,
Chief Technical Strategist, TrendInvestorPro.com
After breaking resistance with a surge in early February, the Retail SPDR (XRT) returned to the breakout with a decline the last few weeks. This decline is tracing out a falling wedge pattern. Support is at hand from broken resistance, but a move above wedge resistance is needed to reverse...
READ MORE
MEMBERS ONLY
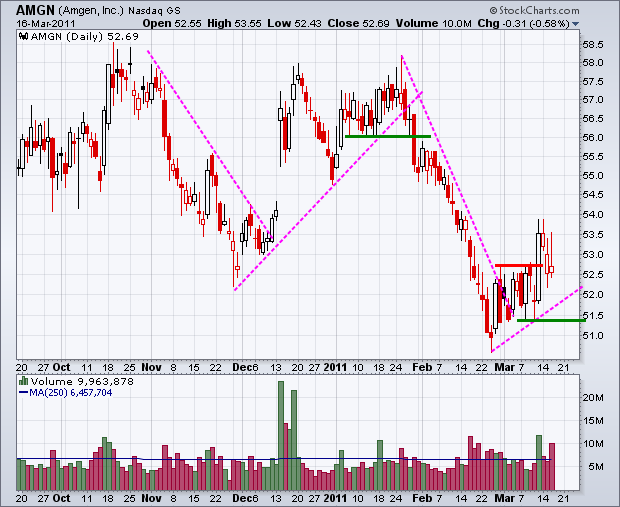
Charts: AMGN, ANF, DHI, FFIV, NVDA, OLN
by Arthur Hill,
Chief Technical Strategist, TrendInvestorPro.com
AMGN Holds Trendline Break. ANF Forms Small Pennant. FFIV Battles Support. Plus DHI, NVDA and OLN.
-----------------------------------------------------------------------------
This commentary and charts-of-interest are designed to stimulate thinking. This analysis is not a recommendation to buy, sell, hold or sell short any security (stock ETF or otherwise). We all need to think...
READ MORE
MEMBERS ONLY
QQQQ and IWM Hit Support Zones as SPY Becomes Oversold
by Arthur Hill,
Chief Technical Strategist, TrendInvestorPro.com
There is no change to the short-term evidence, which remains bearish. However, the major index ETFs are oversold again and near support levels that could give way to a bounce. The first chart shows the Nasdaq 100 ETF (QQQQ) hitting the 62% retracement mark and support from broken resistance around...
READ MORE
MEMBERS ONLY
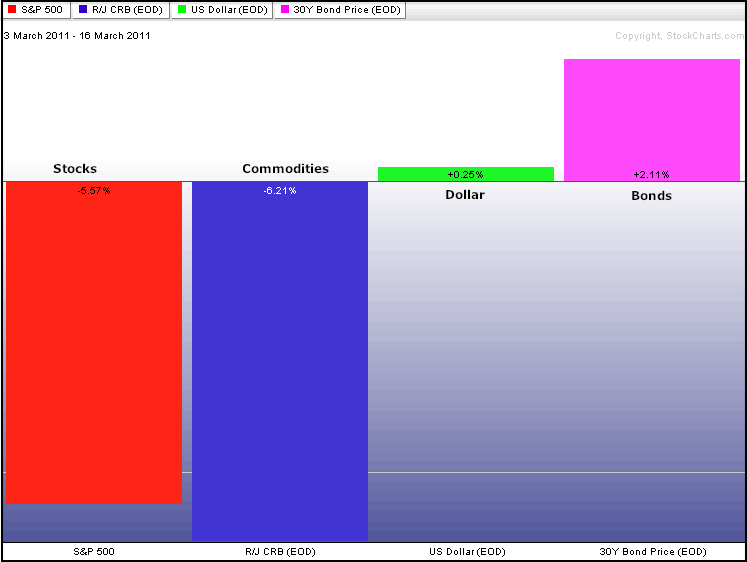
Bonds Benefit from Weakness in Stocks and Commodities
by Arthur Hill,
Chief Technical Strategist, TrendInvestorPro.com
John Murphy's Intermarket Study PerfChart shows money moving out of stocks and commodities over the last two weeks. Weakness in the CRB Index gave a little lift to the Dollar and a flight-to-safety provided a serious lift for bonds.
Click this image for a live chart...
READ MORE
MEMBERS ONLY
SPY Forms Long White Candle near First Support Zone
by Arthur Hill,
Chief Technical Strategist, TrendInvestorPro.com
The S&P 500 ETF (SPY) opened with a huge gap down, but rallied after this gap to form a long white candlestick. Notice that the ETF opened in the 38-50% retracement zone and closed above the 38% retracement mark. This move reinforces the 128 area as the first...
READ MORE
MEMBERS ONLY
Homebuilders Buck the Trend with a Nice Gain
by Arthur Hill,
Chief Technical Strategist, TrendInvestorPro.com
The Home Construction iShares (ITB) opened weak with a gap below 13, but recovered its early losses and closed with a 1.07% gain on the day. Not bad considering the circumstances. The overall trend since mid January remains down, but there is a big support battle raging around 13....
READ MORE
MEMBERS ONLY
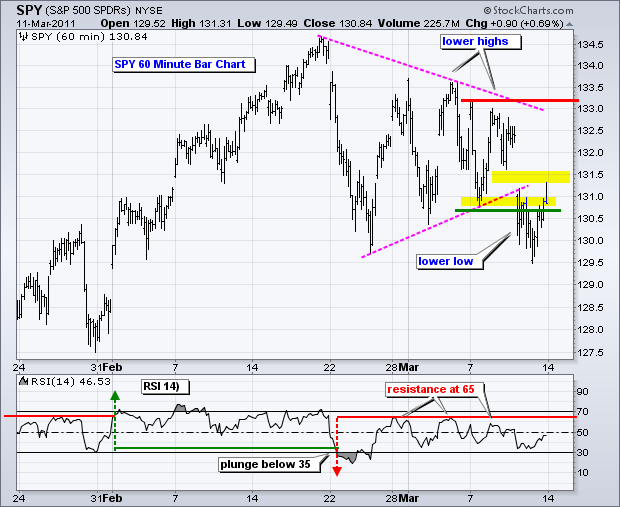
Setting the Next Support Zone for SPY
by Arthur Hill,
Chief Technical Strategist, TrendInvestorPro.com
There is no change in the overall assessment. The majority of short-term evidence remains bearish. Bearish evidence started building when RSI on the 30-minute chart plunged below 30 on February 22nd. Bearish evidence expanded as Nasdaq breadth indicators turned bearish on February 23rd and NYSE indicator followed suit on March...
READ MORE
MEMBERS ONLY
Charts: AWR,ERTS,HOG, IR,SCMR,THQI,USG,WHR
by Arthur Hill,
Chief Technical Strategist, TrendInvestorPro.com
Charts: AWR Bounces off Support. ERTS Forms Bull Wedge. WHR Forms Bear Flag. Plus HOG, IR, SCMR, THQI and USG
-----------------------------------------------------------------------------
This commentary and charts-of-interest are designed to stimulate thinking. This analysis is not a recommendation to buy, sell, hold or sell short any security (stock ETF or otherwise). We...
READ MORE
MEMBERS ONLY
DOG Breaks Falling Trendline as the Aroon(Up) Surges
by Arthur Hill,
Chief Technical Strategist, TrendInvestorPro.com
Unsurprisingly, the ProShares Short Dow 30 Fund (DOG) moved lower as the market trended higher from September to February. As with November, the ETF is making another reversal attempt as it broke the late August trendline and Aroon(Up) surged above 90. This positive develop remains in force as long...
READ MORE
MEMBERS ONLY
Short-term Breadth and RSI Remain Bearish for SPY
by Arthur Hill,
Chief Technical Strategist, TrendInvestorPro.com
The majority of the short-term evidence remains bearish. Bearish evidence started building when RSI on the 30-minute chart plunged below 30 on February 22nd. Despite a few sharp bounces, the indicator never made it back above 65 and remains in bear mode. Bearish evidence expanded when short-term breadth broke down...
READ MORE
MEMBERS ONLY
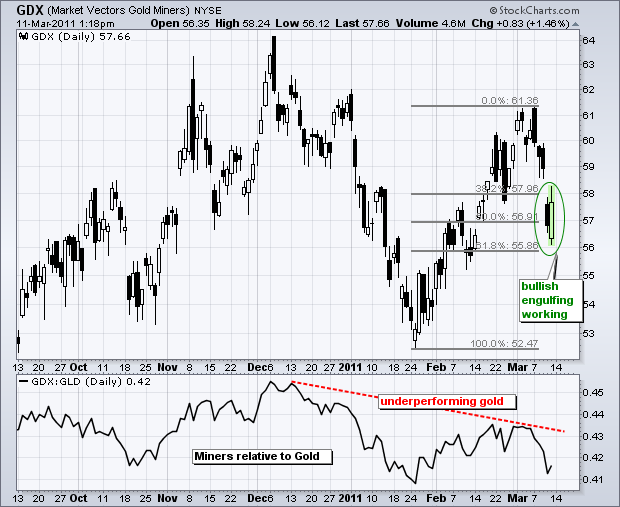
Gold Miners ETF Attempts Bullish Engulfing at Key Retracement
by Arthur Hill,
Chief Technical Strategist, TrendInvestorPro.com
After a sharp decline the first four days of the week, the Gold Miners ETF (GDX) quickly firmed on Friday with a bullish engulfing taking shape Friday afternoon (1:18PM). Also note that this pattern formed with a low at the 62% retracement mark. Despite the promise for a bounce,...
READ MORE
MEMBERS ONLY
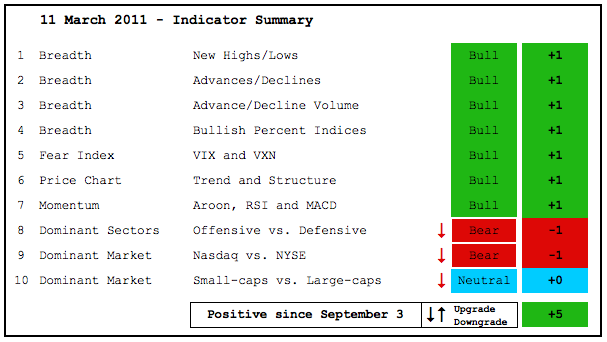
Indicator Summary Takes a Hit, But Remains Positive
by Arthur Hill,
Chief Technical Strategist, TrendInvestorPro.com
The indicator summary is a medium-term vehicle designed to measure an array of indicators. The sum total identifies periods of strength when positive and weakness when negative. This sum total is not a leading indicator and not immune to whipsaws. The sum total will not turn negative until there is...
READ MORE
MEMBERS ONLY
Setting a Short-Term Target for SPY
by Arthur Hill,
Chief Technical Strategist, TrendInvestorPro.com
The final piece of the short-term puzzle finally came through as SPY broke support with a gap and sharp decline. RSI was already in bear mode after a plunge below 30 and three failures below 70. Breadth turned bearish on Monday as the 10-day SMAs for Net Advances (NYSE/Nasdaq)...
READ MORE
MEMBERS ONLY
Market Carpet Reveals Gainers within a Sea of Red
by Arthur Hill,
Chief Technical Strategist, TrendInvestorPro.com
Stocks are down sharply as of this writing, but there are a few bucking the trend with gains. Chartists can find such rogue stocks with the Sector Market Carpet. The green squares show the gainers and the top five are listed to the right. Starbucks is leading with break above...
READ MORE
MEMBERS ONLY
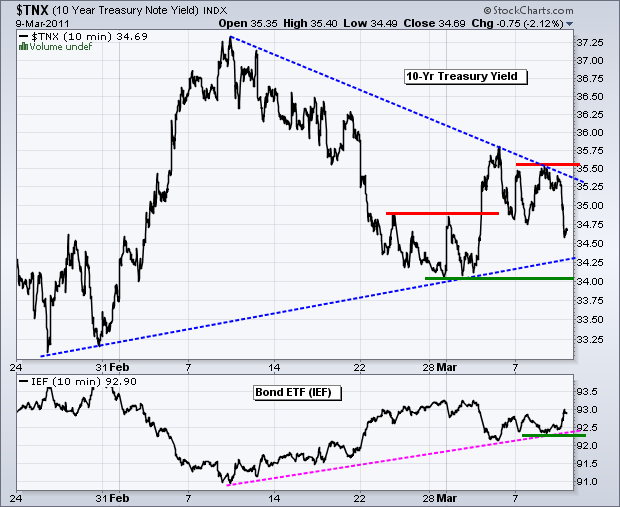
IWM and QQQQ Diverge as SPY Hangs in the Balance
by Arthur Hill,
Chief Technical Strategist, TrendInvestorPro.com
There appear to be some changes afoot in the intermarket arena that could have a negative effect on stocks. We already know about the surge in oil and commodity prices. With a sharp decline on Wednesday, the 10-year Treasury Yield ($TNX) failed to hold last week's surge and...
READ MORE
MEMBERS ONLY
Charts of Interest: CL, IMN, JNJ, LIFE, SPG
by Arthur Hill,
Chief Technical Strategist, TrendInvestorPro.com
CL Breaks Surges above Wedge Trendline. IMN Forms Bullish Consolidation.
SPG Consolidates after Sharp Decline. Plus JNJ and LIFE.
-----------------------------------------------------------------------------
This commentary and charts-of-interest are designed to stimulate thinking. This analysis is not a recommendation to buy, sell, hold or sell short any security (stock ETF or otherwise). We all...
READ MORE
MEMBERS ONLY
Sector CandleGlance Shows Leading and Lagging Sectors
by Arthur Hill,
Chief Technical Strategist, TrendInvestorPro.com
CandleGlance charts provide a quick group snapshot. The screenshot comes from the S&P Sector SPDR CandleGlance group. Only four of the nine are shown. Click the image to see all. The Utilities SPDR (XLU) and the Healthcare SPDR (XLV) are clearly showing relative strength with a surge the...
READ MORE
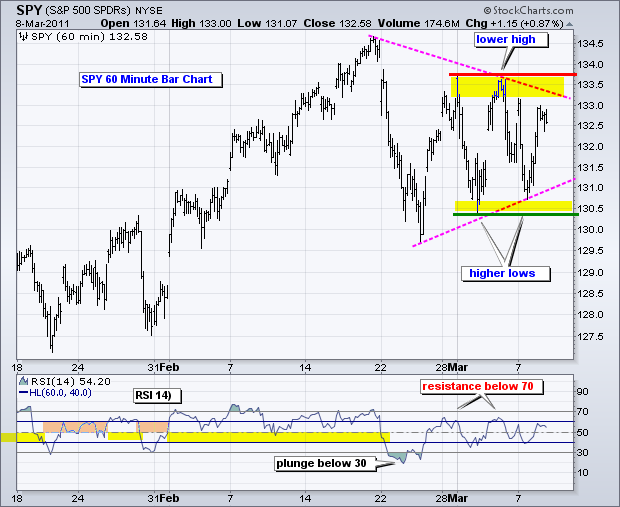
MEMBERS ONLY
SPY Holds Consolidation as Bulls Refuse to Buckle
by Arthur Hill,
Chief Technical Strategist, TrendInvestorPro.com
Even though the bulk of the short-term evidence has shifted to the bears, the bulls refuse to give way as the S&P 500 ETF (SPY) holds support. Four out of four breadth indicators moved below their bearish thresholds. RSI on the 60-minute chart plunged below 30 in late...
READ MORE
MEMBERS ONLY
Bullish P&F Scan Results Still Outpacing Bearish Results
by Arthur Hill,
Chief Technical Strategist, TrendInvestorPro.com
There are 17 P&F related scans on the pre-defined scans page. Of the major patterns shown below, the first four patterns are bullish and the second four are bearish. Currently, there are over 250 stocks with bullish Triple Top Alerts and over 550 stocks with bullish Ascending Triple...
READ MORE
MEMBERS ONLY
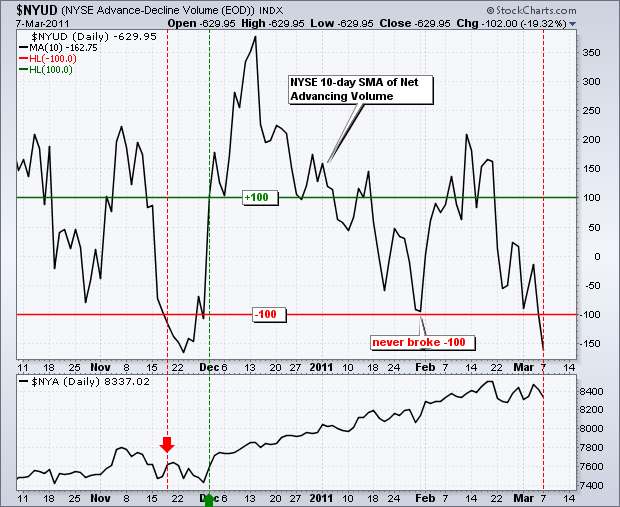
NYSE Breadth Indicators Turn Bearish as SPY Consolidates
by Arthur Hill,
Chief Technical Strategist, TrendInvestorPro.com
With another day of selling pressure, the 10-day SMAs for the NYSE Net Advances ($NYAD) and NYSE Net Advancing Volume ($NYUD) moved below -100. These indicators now join the 10-day SMAs for Nasdaq Net Advances ($NAAD) and Nasdaq Net Advancing Volume ($NAUD) with bearish signals. Keep in mind that this...
READ MORE
MEMBERS ONLY
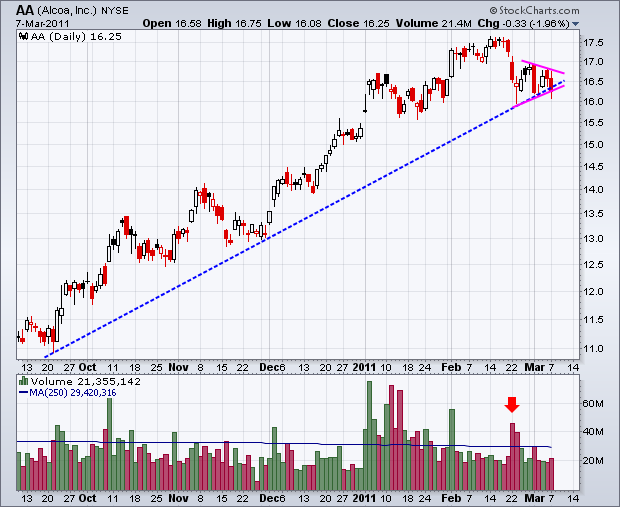
Charts: AA,ANF,ANN,BAC,BBBY, GME,JCOM,MCHP,S,STEC
by Arthur Hill,
Chief Technical Strategist, TrendInvestorPro.com
AA Forms Bearish Pennant. ANF Fails at Resistance, BBBY Forms Bearish Flag. Plus ANN, BAC, BBBY, GME, JCOM, MCHP, S and STEC
This commentary and charts-of-interest are designed to stimulate thinking. This analysis is not a recommendation to buy, sell, hold or sell short any security (stock ETF or otherwise)...
READ MORE
MEMBERS ONLY
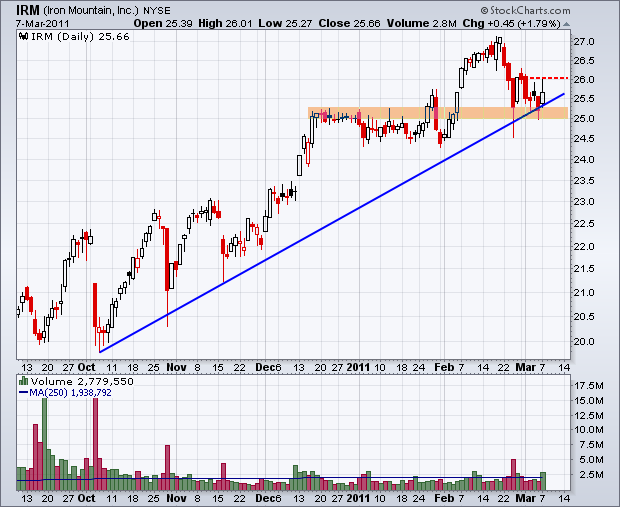
Iron Mountain Bucks the Market with a Gain on Good Volume
by Arthur Hill,
Chief Technical Strategist, TrendInvestorPro.com
Stocks were broadly lower on Monday, but a few bucked the trend with gains. Simply scanning for stocks that gained on a day like today will reveal those showing some relative strength. The chart below shows Iron Mountain (IRM) hitting support from the October trendline and broken resistance zone. The...
READ MORE
MEMBERS ONLY
Stocks Ignore Surging Oil, Gold and Interest Rates
by Arthur Hill,
Chief Technical Strategist, TrendInvestorPro.com
One must wonder how stocks can continue to gain in the current environment. Oil, gold and the Euro are going to the moon. Bonds broke down last week to signal a resumption of their long-term downtrend, which means interest rates are heading higher. Perhaps QE2 and the Fed's...
READ MORE
MEMBERS ONLY
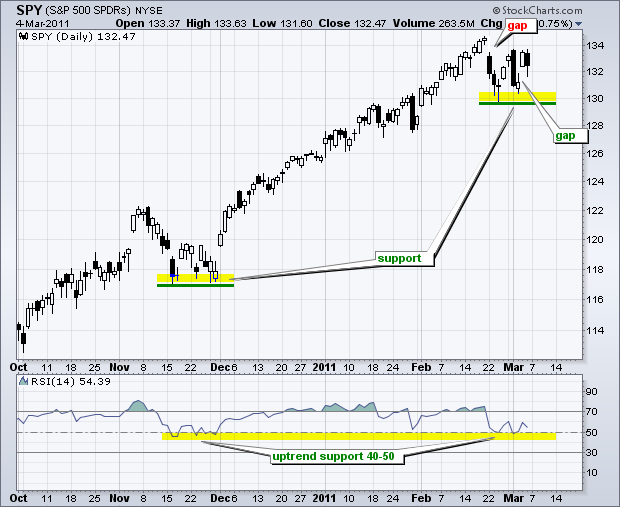
Overall Uptrend Remains As SPY Battles a Pair of Gaps
by Arthur Hill,
Chief Technical Strategist, TrendInvestorPro.com
The S&P 500 ETF (SPY) is hitting resistance from last week's gap down, but may just find support from this week's gap up. The latest round of gaps started with a gap down from a new high on 22-February. The ETF rebounded later that...
READ MORE
MEMBERS ONLY
Gap Continues to Mark Resistance for QQQQ
by Arthur Hill,
Chief Technical Strategist, TrendInvestorPro.com
For the second time in two weeks, the Nasdaq 100 ETF (QQQQ) surged and met resistance from the 22-Feb gap. While failure at the gap is negative, the overall trend remains up as QQQQ battles the lower trendline of a rising price channel. Also note that Thursday's gap...
READ MORE