MEMBERS ONLY
Towering TSLA!
by Bruce Fraser,
Industry-leading "Wyckoffian"
Starting in the second quarter of 2019, Tesla Inc. (TSLA) stock has launched like a SpaceX rocket. In the Wyckoff Method a ‘Cause' will precede an ‘Effect'. A Cause is a preparation phase of Accumulation or Distribution (a trading range). The Horizontal Point and Figure (PnF) counting technique...
READ MORE
MEMBERS ONLY
A NASDAQ 100 Throwover. Is the Uptrend Ending?
by Bruce Fraser,
Industry-leading "Wyckoffian"
Financial markets are pushing up into the start of earnings season. In June, the S&P 500 and the Dow Jones Industrial Average accelerated into climactic exhaustion as end of quarter window dressing came to a conclusion. This set up a ‘Range-Bound' condition in these averages that continues...
READ MORE
MEMBERS ONLY
Power Charting TV: Wyckoff Method Checklist for a Peak.
by Bruce Fraser,
Industry-leading "Wyckoffian"
* Wyckoff Method Checklist for a Peak (Video and Chart Update)
* Crypto Currency & the Wyckoff Method. Alessio Rutigliano Presents on Power Charting
* Wyckoff Market Discussion (WMD) 200th Episode Video and a Special Offer
A series of market conditions have come together this last week to suggest the exhaustion of the...
READ MORE
MEMBERS ONLY
Power Charting TV: Special Guest Roman Bogomazov. Wyckoff Market Discussion 200th Episode, An Invitation to Attend.
by Bruce Fraser,
Industry-leading "Wyckoffian"
Roman Bogomazov is this week's special guest on Power Charting. He discusses the current stock market rally and the upcoming 200th episode of the ‘Wyckoff Market Discussion' series. Professor Roman is a leading Wyckoff Method educator, mentoring under and teaching with famed Wyckoffian Hank Pruden. Roman and...
READ MORE
MEMBERS ONLY
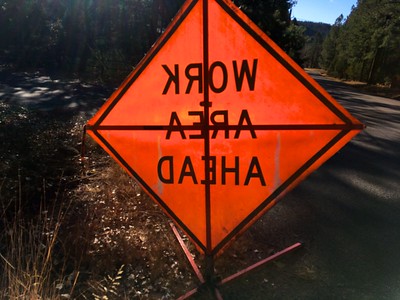
Work Area Ahead
by Bruce Fraser,
Industry-leading "Wyckoffian"
The worldwide COVID-19 lockdown has produced massive unemployment trends. In the U.S. unemployment is moving rapidly toward the 20% level. Sheltering-in-Place has established many new societal trends. Some of these trends we have explored as the ‘Stay-at-Home Economy' theme. Here we will discern some of the new work...
READ MORE
MEMBERS ONLY
Stride of the Market in Peril?
by Bruce Fraser,
Industry-leading "Wyckoffian"
Wyckoffian trendline analysis is a very powerful and useful tool. The stride of a trend is often set very early in the uptrend. This analysis is fractal in nature and can be employed in timeframes from very short term to very long term. If the stride is set early a...
READ MORE
MEMBERS ONLY
Where Were You in '62?
by Bruce Fraser,
Industry-leading "Wyckoffian"
In 1959 a dynamic uptrend Climaxed. This began a range-bound market with Broadening features. Higher highs and Lower lows persisted into 1963. In 1962 a surprising waterfall decline fell below the lows of the 1960 SOW, then formed an Accumulation and a fresh new uptrend. This Broadening structure has eerie...
READ MORE
MEMBERS ONLY
Lithium is Charged Up
by Bruce Fraser,
Industry-leading "Wyckoffian"
During the 4th quarter of 2019 Tesla came to life and leaped out of a multi-year trading range. Tesla's recent appreciation is likely indicating a period of robust business expansion for the electric automobile manufacturer (and battery producer). By some estimates there will be 15 new Electric Vehicles...
READ MORE
MEMBERS ONLY
Dow Jones Industrials. Out of Gas?
by Bruce Fraser,
Industry-leading "Wyckoffian"
In a number of cases we have studied classic Wyckoffian Overbought and Oversold conditions that emerge at the conclusion of a market move. Such a condition typically presents as Climactic action. Three or more unique events will often combine to setup exhaustion of a trend. Fulfilment of a Point and...
READ MORE
MEMBERS ONLY
Power Charting TV: Wyckoff 2020
by Bruce Fraser,
Industry-leading "Wyckoffian"
Joe Turner and Jim Kopas of Pring Turner Capital Group join me for a discussion of the current state of the business cycle. Their firm (along with Martin Pring and Tom Kopas) does some of the best research on the planet on the domestic and global business cycle. Year end...
READ MORE
MEMBERS ONLY
Power Charting TV: Wyckoff Workshop
by Bruce Fraser,
Industry-leading "Wyckoffian"
Good friend Tom Bowley invited me to conduct a Wyckoff Accumulation Workshop this past Friday. On January 4th Tom, with John Hopkins of earningsbeats.com, will be hosting the epic event Market Vision 2020. This day long event will include nine top market strategists. Each will summon their immense analytical...
READ MORE
MEMBERS ONLY
Power Charting TV: Year End Review and 2020 Outlook
by Bruce Fraser,
Industry-leading "Wyckoffian"
As this epic year comes to a conclusion it is appropriate to look back as well as look ahead to 2020. Below are links to the most recent Power Charting episodes where we review 2019 and then consider the forces that could influence the major indexes in the year ahead....
READ MORE
MEMBERS ONLY
Ford v Ferrari. A Movie about Trading.
by Bruce Fraser,
Industry-leading "Wyckoffian"
During this Holiday shortened week go see the movie Ford vs. Ferrari. It is a movie about trading. No wait, it is a movie about an epic battle between two automotive titans to win the 24 Hours of Le Mans. There was and is no more prestigious an achievement, as...
READ MORE
MEMBERS ONLY
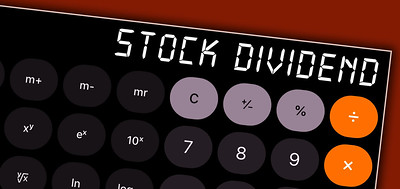
Dividends Rule!
by Bruce Fraser,
Industry-leading "Wyckoffian"
Growth stocks and Income (Value) stocks often perform in opposition to each other. When the growth theme is strong, the value theme is lagging. On a secular scale two time periods come to mind. From about 1977-83 growth stocks dominated with the raging IPO market signaling the conclusion of the...
READ MORE
MEMBERS ONLY
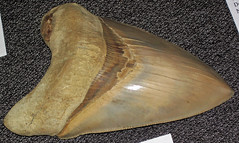
Meg-Oil
by Bruce Fraser,
Industry-leading "Wyckoffian"
The plot of the B-Movie ‘The Meg' is the discovery of a living prehistoric shark the Megalodon. This movie shark was so big (the actual prehistoric Meg could reach 59 feet in length) that it could swallow ‘Jaws' whole. Megalodon is similar in size to the current crude...
READ MORE
MEMBERS ONLY
Stocks Yield. Bonds Don't
by Bruce Fraser,
Industry-leading "Wyckoffian"
A characteristic of this economic cycle has been the disappearance of yield. Yield has been like a glacier melting ever downward and eventually disappearing into the yawning gap it created. In this brave new world of minimalistic interest rates how does an investor create income? Negative interest rates infect most...
READ MORE
MEMBERS ONLY
Stock Market Time
by Bruce Fraser,
Industry-leading "Wyckoffian"
Recently the stock market indexes entered a period of extreme volatility. Seemingly random events sent the indexes into rapid declines. These unexpected events blindsided many traders and investors. Stops were hit on positions that only moments prior seemed to have a safe cushion of profit.
When markets become volatile and...
READ MORE
MEMBERS ONLY
Silver Standard
by Bruce Fraser,
Industry-leading "Wyckoffian"
An important oversold condition and Point and Figure objective were reached in August of 2018 for Gold ($GOLD). A Last Point of Support (LPS) formed at the Support line generated by the Selling Climax (SCLX) low in 2013 (to see the chart analysis – click here and click here). Since this...
READ MORE
MEMBERS ONLY
On the Razor's Edge
by Bruce Fraser,
Industry-leading "Wyckoffian"
The S&P 500 Index appreciated 17.35% in the first half of 2019. But from the climax high close in January 2018 the S&P 500 has risen only 2.4%. Despite the stellar performance during 2019 the large capitalization indexes have remained ‘range-bound’ during the past...
READ MORE
MEMBERS ONLY
Gold v. Dollar
by Bruce Fraser,
Industry-leading "Wyckoffian"
Gold and the Dollar are natural adversaries. They both represent a store of value. When the Dollar is strong, in comparison to other currencies, gold tends to underperform. Recently the Dollar has been a dominant currency, largely as a result of the strong domestic economy and higher interest rates. There...
READ MORE
MEMBERS ONLY
Where There's Smoke...
by Bruce Fraser,
Industry-leading "Wyckoffian"
In early May (see my 5/2 MarketWatchers LIVE appearance) it seemed that a hint of smoke was noticeable at the tippy top of the market rally. We looked at the attributes of Distribution that were evident in the smaller intraday time frames. During the May 10th Power Charting episode,...
READ MORE
MEMBERS ONLY
Boeing is Big
by Bruce Fraser,
Industry-leading "Wyckoffian"
The Dow Jones Industrial Average ($INDU) is the granddaddy of stock indexes. Charles Dow created the predecessor of this index in 1880s. The publication and distribution of this index was the forerunner of the Wall Street Journal. Eleven important leadership stocks composed this original stock index. The calculation was made...
READ MORE
MEMBERS ONLY
Campaign Caravan
by Bruce Fraser,
Industry-leading "Wyckoffian"
For most investors Campaigning stocks is an acquired skill. A stock campaign is typically a multi-year endurance event. In a classic uptrend a stock will have trending periods followed by consolidations (Wyckoffians call them Reaccumulations). These pauses can last months to a year or more in duration. Wyckoff Campaigners resist...
READ MORE
MEMBERS ONLY
Health Care Crisis
by Bruce Fraser,
Industry-leading "Wyckoffian"
The Health Care Sector (XLV) took a tumble this past week. In 2018 XLV was among the best leadership sectors of the stock market. Rotation is expected between sectors, industry groups and stocks throughout the business cycle. Were there technical clues that warned of the seemingly sudden weakness in the...
READ MORE
MEMBERS ONLY
WYNN Win
by Bruce Fraser,
Industry-leading "Wyckoffian"
Wynn Resorts is a favorite stock to study. WYNN tends to have big cyclical trends which repeat over and over again. These trends are wonderfully persistent in their upward and downward movements. Also prior to a major change of trend, a Cause builds for either Accumulation or Distribution. And these...
READ MORE
MEMBERS ONLY
Yields Flatten
by Bruce Fraser,
Industry-leading "Wyckoffian"
The Yield Curve recently flipped negative (10 year compared to 3 month treasury yields). A negative Yield Curve is typically a ‘Tight Money’ indication which often leads to economic recession and weaker stock prices. The December 10, 2018 Wyckoff Power Charting blog was devoted to this subject. The conclusion was...
READ MORE
MEMBERS ONLY
Trucks. Trains. Airplanes.
by Bruce Fraser,
Industry-leading "Wyckoffian"
The Dow Jones Transportation Average, since its creation, has been considered a sensitive leading indicator of business conditions. The legendary ‘Dow Theory’ was created as a trend confirmation indicator of the Industrial Average to the Transportation Average. When they are both in-gear, upward or downward, the major trend is confirmed....
READ MORE
MEMBERS ONLY
Residential Constructive
by Bruce Fraser,
Industry-leading "Wyckoffian"
In August of 2018 we studied the Residential Construction industry group (click here to view). This group was very weak throughout 2018. After a sharp January decline a long period of Redistribution set in. Rising interest rates during the year became a headwind for the group. In September, the redistribution...
READ MORE
MEMBERS ONLY
S&P 500 Trending
by Bruce Fraser,
Industry-leading "Wyckoffian"
The Wyckoff Method constructs trendlines somewhat differently than other popular technical methods. Mr. Wyckoff’s trendline method is obscure and not in wide usage. The main benefit of this construction technique is to support effective trading setups as the trend is unfolding. Trends (all timeframes) tend to set the rate...
READ MORE
MEMBERS ONLY
Material Development
by Bruce Fraser,
Industry-leading "Wyckoffian"
The U.S. Mining Index is composed of industries that manufacture a broad spectrum of materials used in manufacturing and infrastructure projects. Typically, the Mining Index comes into a performance leadership position as the economy heats up. Therefore, in the middle to late stage of a business cycle expansion this...
READ MORE
MEMBERS ONLY
WDAY Works Out
by Bruce Fraser,
Industry-leading "Wyckoffian"
In a September 2017 blog, we studied Workday, Inc. (WDAY). We looked at WDAY as an emerging ‘Campaign Stock’. These stocks have characteristics that could propel their uptrends for years to come. The Wyckoff Method offers the tools to identify these candidates. Chief among them is structural chart analysis and...
READ MORE
MEMBERS ONLY
Golden Ticket
by Bruce Fraser,
Industry-leading "Wyckoffian"
In August of 2018 Wyckoff Power Charting published a monthly chart of the continuous contract of Gold ($GOLD). A very large Accumulation structure appeared to be forming after a cyclical bear market. Meanwhile a downtrend (see the Supply Line) had been in control for more than seven years. In that...
READ MORE
MEMBERS ONLY
AAPL Campaign Completed
by Bruce Fraser,
Industry-leading "Wyckoffian"
Because the Wyckoff Methodology identifies elements of structure and context within price (Accumulation and Distribution schematics and Phase Analysis), it naturally strengthens the attribute of patience in its user. There is a time to watch, a time to act, and a time to sit in a trending trade. Horizontal Point...
READ MORE
MEMBERS ONLY
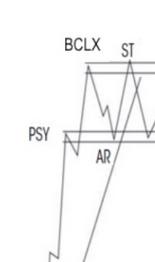
Will PnF Light the Way in 2019
by Bruce Fraser,
Industry-leading "Wyckoffian"
As 2018 was getting underway, a January Buying Climax (BCLX) and a February Automatic Reaction (AR) turned a robust uptrend into a ‘Range-Bound’ market for most of the remainder of the year. Was this large trading range preparing to jump upward or cascade lower? In the fourth quarter the broad...
READ MORE
MEMBERS ONLY
The NASDAQ Composite Stumbles into 2019
by Bruce Fraser,
Industry-leading "Wyckoffian"
For stock indexes, 2018 started dramatically and ended with even more drama. In January a Buying Climax (BC) stopped the long term uptrend of stock indexes and a sharp Automatic Reaction (AR) produced an important Change of Character from a trending into a trading range market environment. This sequence of...
READ MORE
MEMBERS ONLY
Yield Curve Inversion?
by Bruce Fraser,
Industry-leading "Wyckoffian"
The recent weakness in the stock market was partially attributed to the flattening of the ‘Yield Curve’. When bond yields (typically U.S. Treasuries) are plotted in order of their time to maturity, a Yield Curve is the result. Typically, the shortest maturity instruments (T-Bills) have the lowest yield and...
READ MORE
MEMBERS ONLY
International Intrigue
by Bruce Fraser,
Industry-leading "Wyckoffian"
Rolling into the New Year can often bring seismic shifts in financial markets. In January of 2018 stock indexes climaxed and reversed. This set the tone of market action for the year. International markets were among the hardest hit during the year. The iShares MSCI Emerging Markets ETF (EEM) declined...
READ MORE
MEMBERS ONLY
Semi. Campaign. Completion?
by Bruce Fraser,
Industry-leading "Wyckoffian"
As Wyckoffians we like to celebrate long holiday weekends by looking at Point and Figure charts. Allow me to contribute to your weekend chart stack with this case study on the semiconductor stocks (VanEck Vectors Semiconductors ETF will be our proxy). Semiconductor stocks have been important leadership during this long...
READ MORE
MEMBERS ONLY
Natural Gas Lights Up
by Bruce Fraser,
Industry-leading "Wyckoffian"
U. S. Natural Gas Fund (UNG) made an important ‘Spring’ low at the end of 2017. A Change-of-Character (CHoCH) emerged in the trading behavior of UNG in the new year. On the weekly chart UNG had been in a one year downtrend that concluded with a Spring and a Test....
READ MORE
MEMBERS ONLY
Using PnF Charts for Intraday Trading
by Bruce Fraser,
Industry-leading "Wyckoffian"
Point and Figure charts are useful tools for more than calculating price objectives. Many Wyckoffians start their analysis with PnF charts and then turn to vertical bar charts when and if needed. Classic Wyckoff analysis uses a combination of vertical and PnF charts. But it is excellent practice to develop...
READ MORE