MEMBERS ONLY
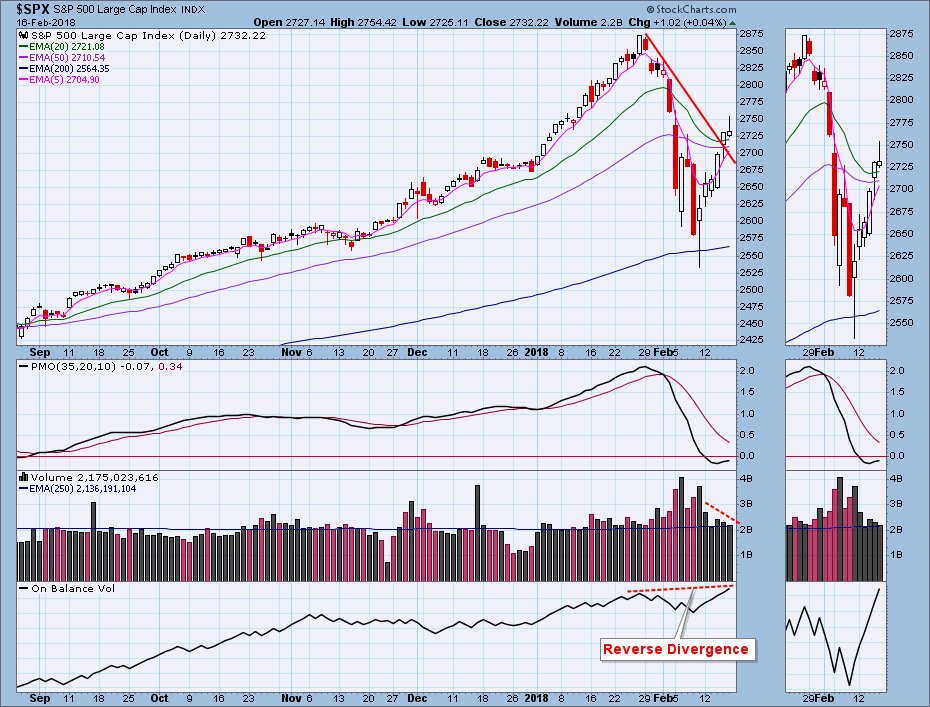
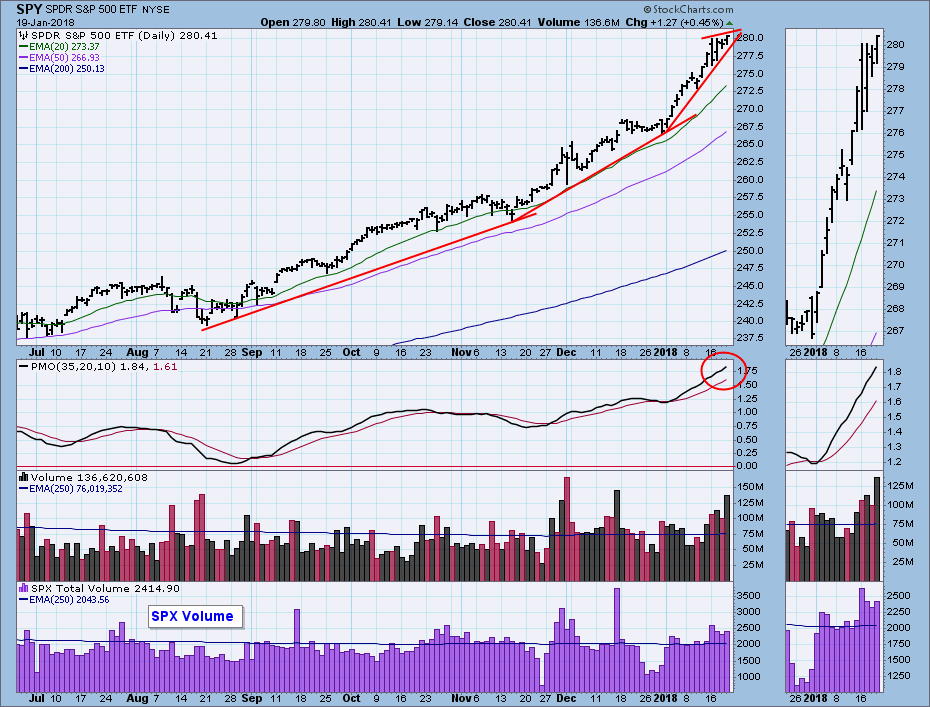
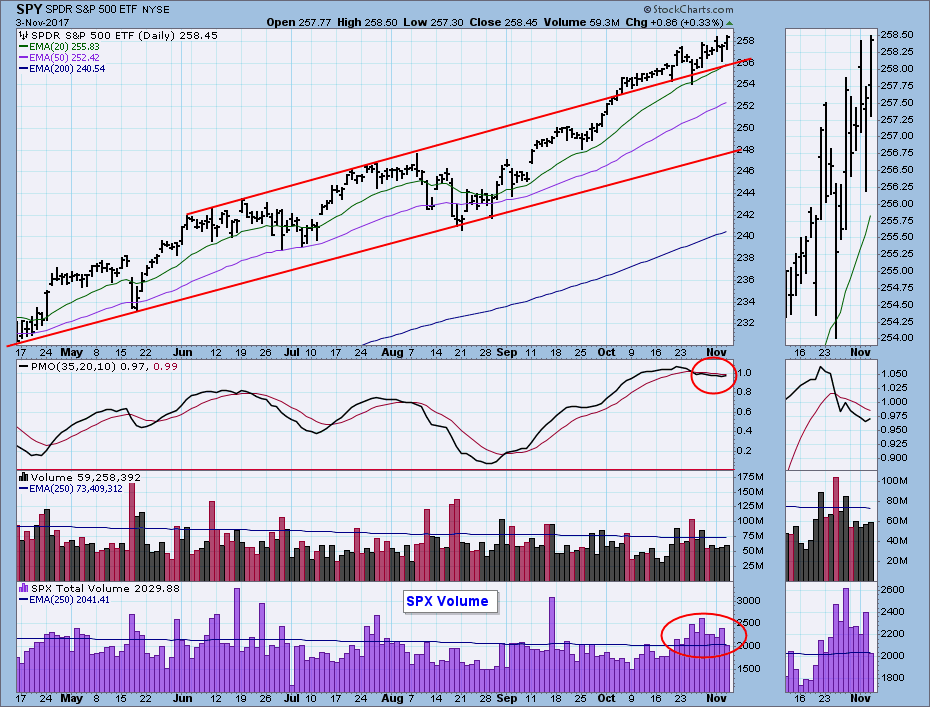
DP Weekly Wrap: Bear Market Rally Over?
by Carl Swenlin,
President and Founder, DecisionPoint.com
Last Friday the market executed a bullish intraday reversal, and this week it rallied five days straight; however, there were some problems. S&P 500 volume contracted into the rally, and Friday's candlestick was a bearish shooting star. I don't really use candlesticks much, but...
READ MORE
MEMBERS ONLY
DP Weekly Wrap: Think Bear Market
by Carl Swenlin,
President and Founder, DecisionPoint.com
Last week I asserted that the character of the market had changed from super bullish to normal bullish, by which I meant that we should start to see more normal bull market corrections. On Monday I quickly revised that opinion and told Erin that I thought we may have entered...
READ MORE
MEMBERS ONLY
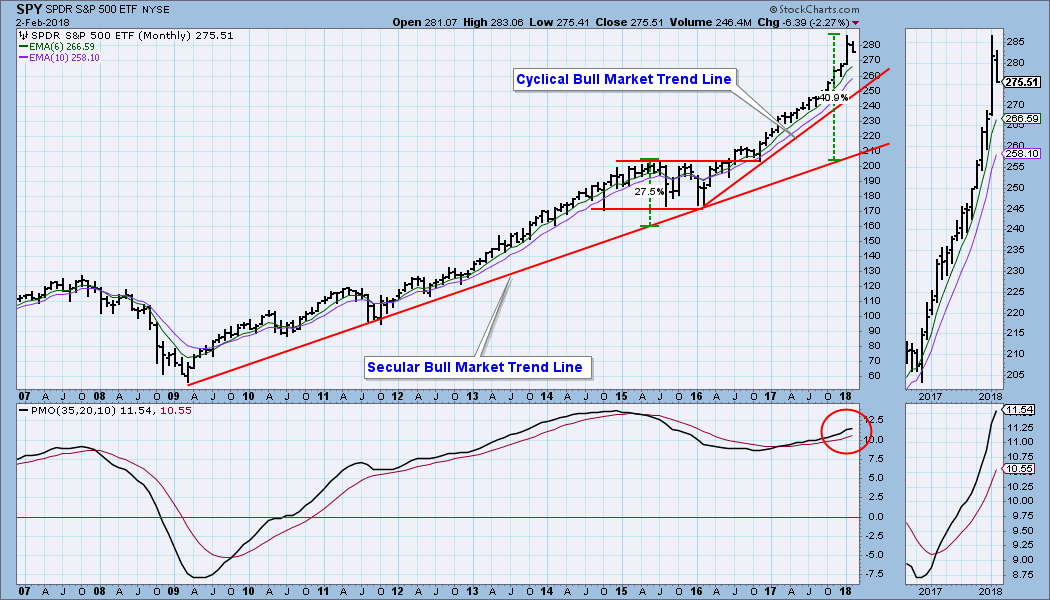
DP Weekly Wrap: Inadequate Correction
by Carl Swenlin,
President and Founder, DecisionPoint.com
Because the DP Weekly Wrap is a recap of the week just ended, I normally lead with a daily chart; however, since there is so much agony being expressed about this week's correction, I am leading with a monthly chart to try to put things in proper perspective....
READ MORE
MEMBERS ONLY
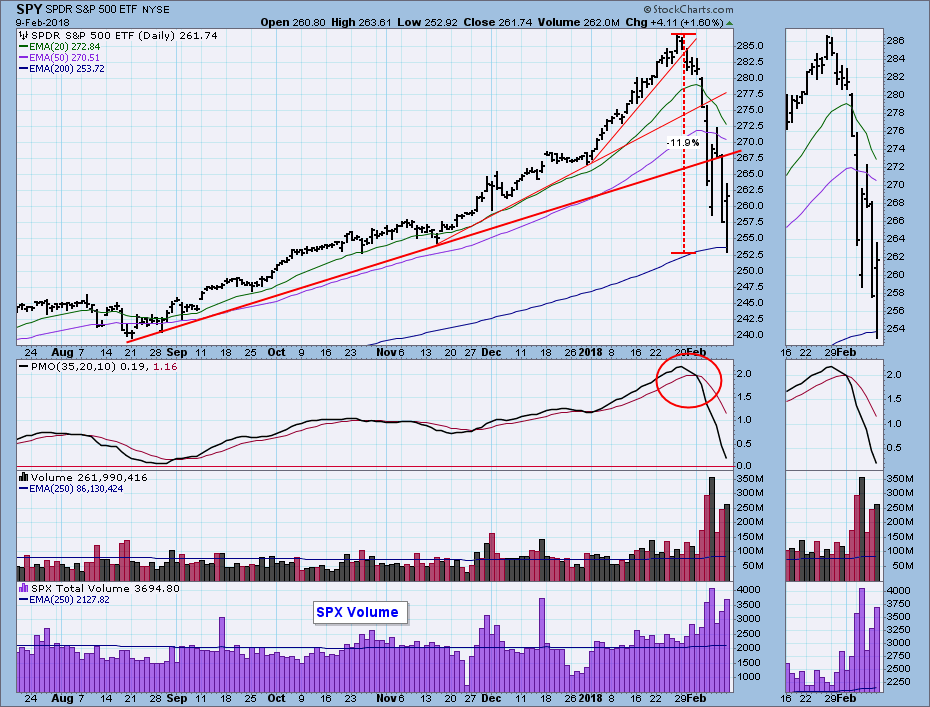
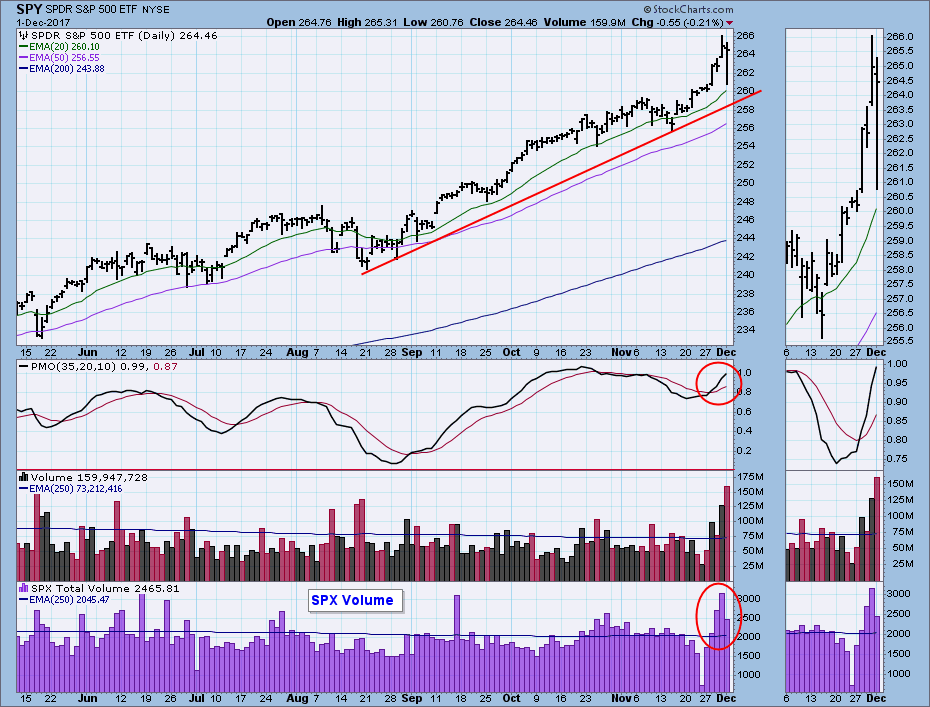
DP Weekly Wrap: Market Pumps; Dollar Dumps
by Carl Swenlin,
President and Founder, DecisionPoint.com
This week the market underwent a horrifying intraday reversal. Just kidding. There was a surprising reversal on Wednesday, but by the close SPY was virtually unchanged. We can see on the chart that at the intraday low the steep January rising trend line was barely tested. And in the context...
READ MORE
MEMBERS ONLY
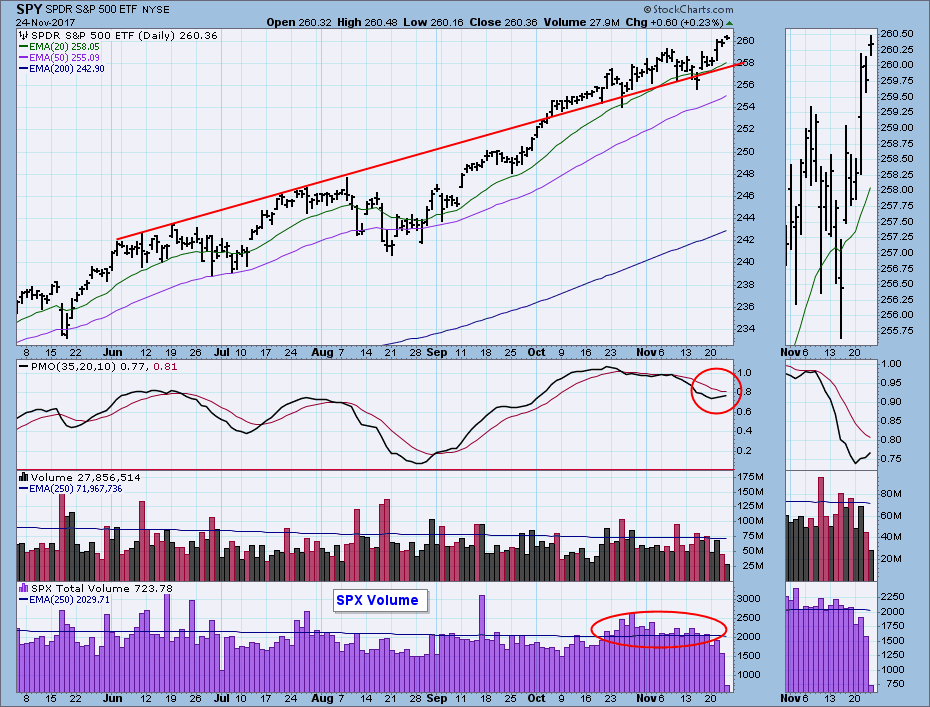
DP Weekly Wrap: Almost A Top
by Carl Swenlin,
President and Founder, DecisionPoint.com
Friday was the last trading day before options expiration, so higher than normal volume should be attributed to that, not to other interpretations of volume versus price movement. We began the trading week with another breakout to new, all-time highs, but that turned into an intraday reversal. But not to...
READ MORE
MEMBERS ONLY
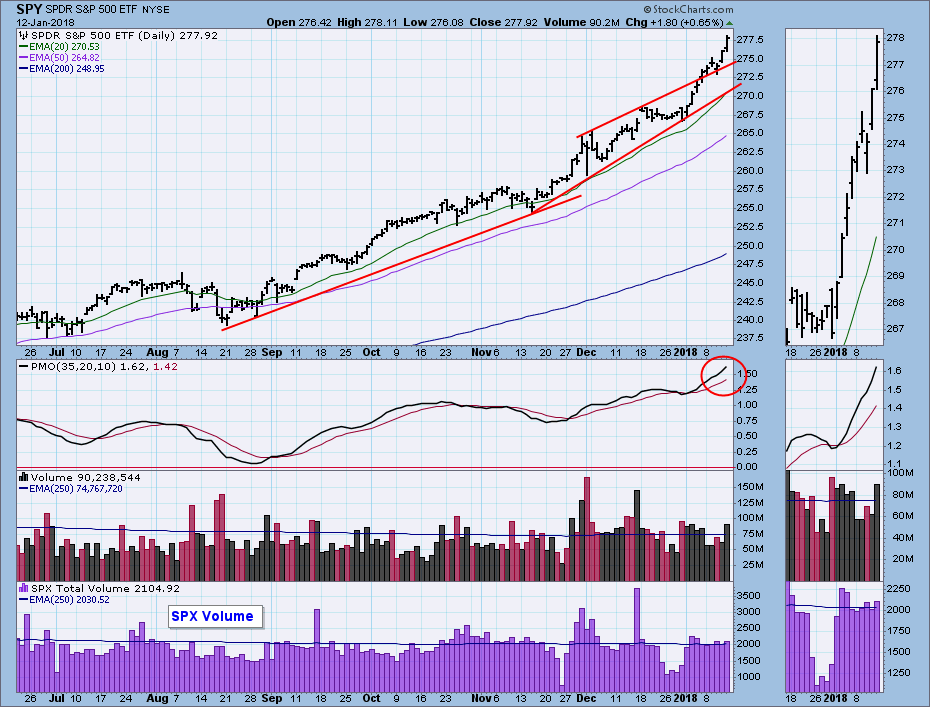
DP Weekly Wrap: Zoom!
by Carl Swenlin,
President and Founder, DecisionPoint.com
Positive events resulting from the recent tax cut legislation continued to lift the market this week, bonuses and pay raises being most prominent in the headlines. I'm sure that there is a substantial element of anticipation as to the positive effects of corporate taxes being cut by 40%...
READ MORE
MEMBERS ONLY
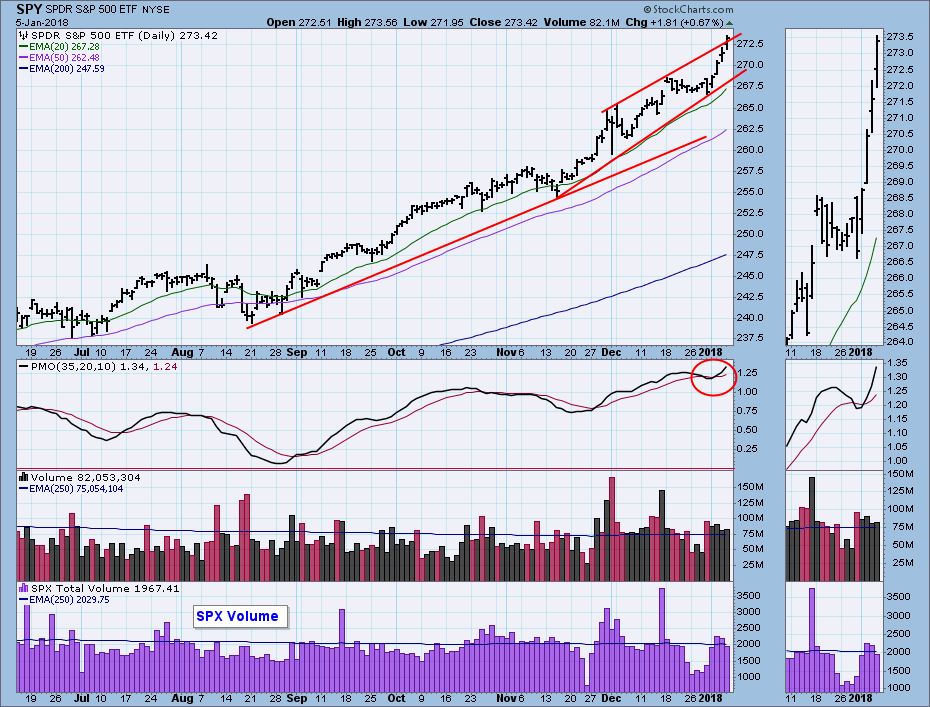
DP Weekly Wrap: A Record of Our Own
by Carl Swenlin,
President and Founder, DecisionPoint.com
The market was flat for the last two weeks of December, and I thought that might be a sign that it was hanging on by its fingernails until the first of the year, when we might see some profit taking. But, no. Why take profits when the market seems to...
READ MORE
MEMBERS ONLY
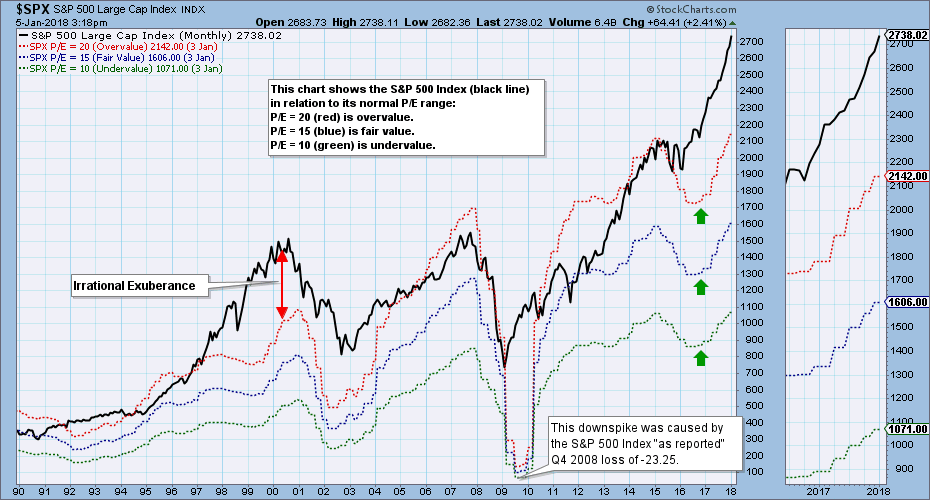
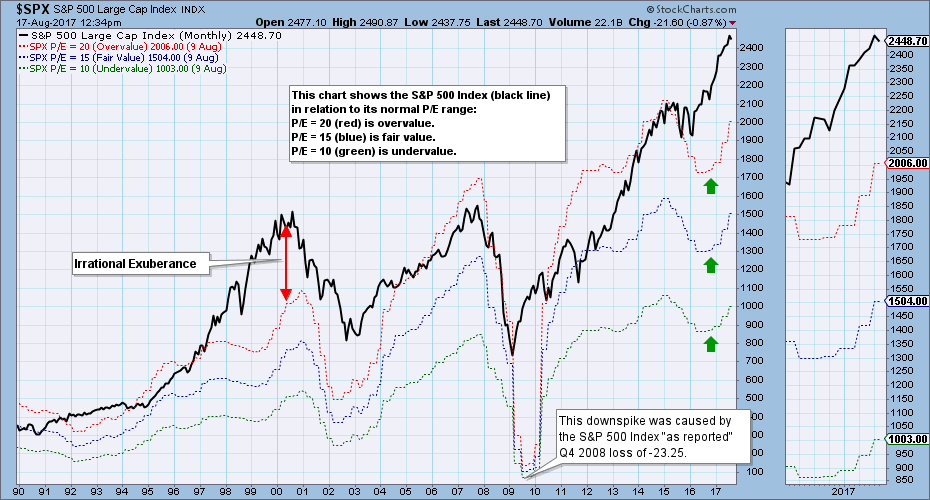
Market Still Overvalued, or Maybe Not
by Carl Swenlin,
President and Founder, DecisionPoint.com
Earnings for 2017 Q3 will be finalized soon, but on a preliminary basis the S&P 500 has a P/E of 25, which is extremely overvalued. The chart below shows the S&P 500 Index (black line) in relation to where it would be if it were...
READ MORE
MEMBERS ONLY
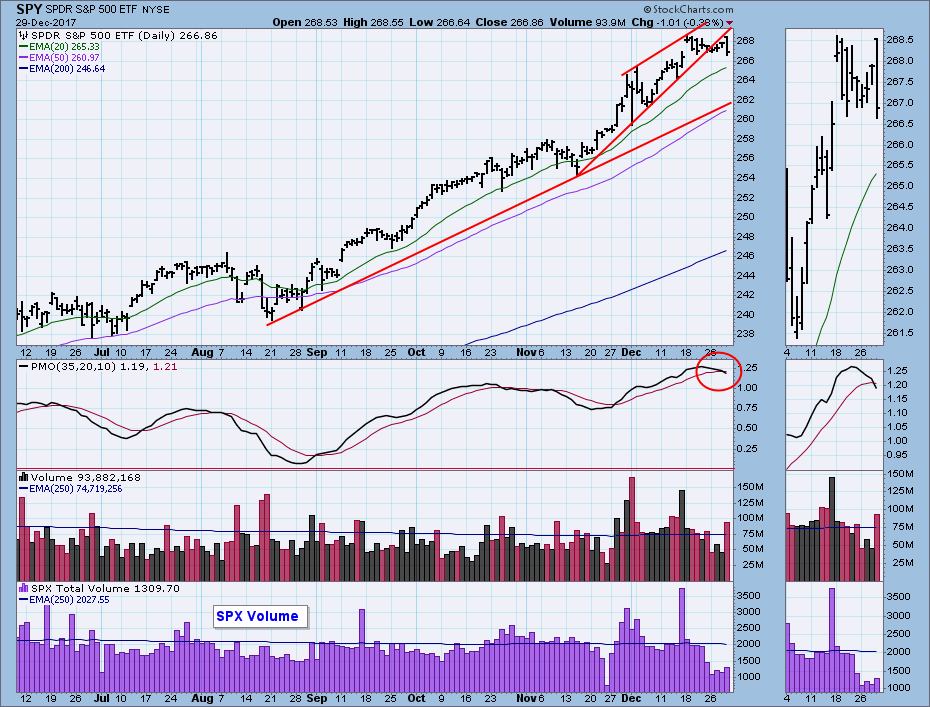
DP Yearly Wrap 2017
by Carl Swenlin,
President and Founder, DecisionPoint.com
Last week we were looking at a rising wedge formation, which we said normally resolves downward. This week price moved through the bottom of the wedge sideways, but that doesn't really qualify as a downward resolution, which would necessarily require price to move, well, down. Friday's...
READ MORE
MEMBERS ONLY
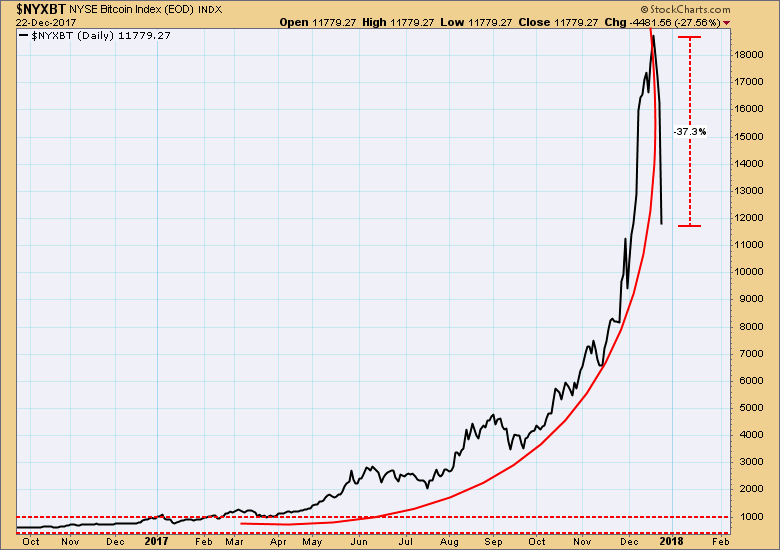
DP Weekly Wrap: Bitcoin Collapse
by Carl Swenlin,
President and Founder, DecisionPoint.com
Two weeks ago I led with a chart of the Bitcoin Index. It was in a dangerous parabolic advance, and I said: "Yes, price could go higher, but it is also at a point where the parabolic could collapse, and the potential downside is back down to the support...
READ MORE
MEMBERS ONLY
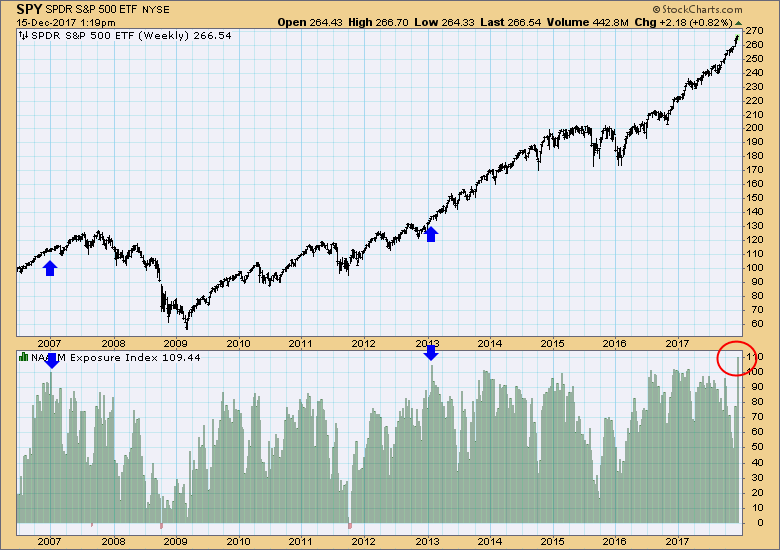
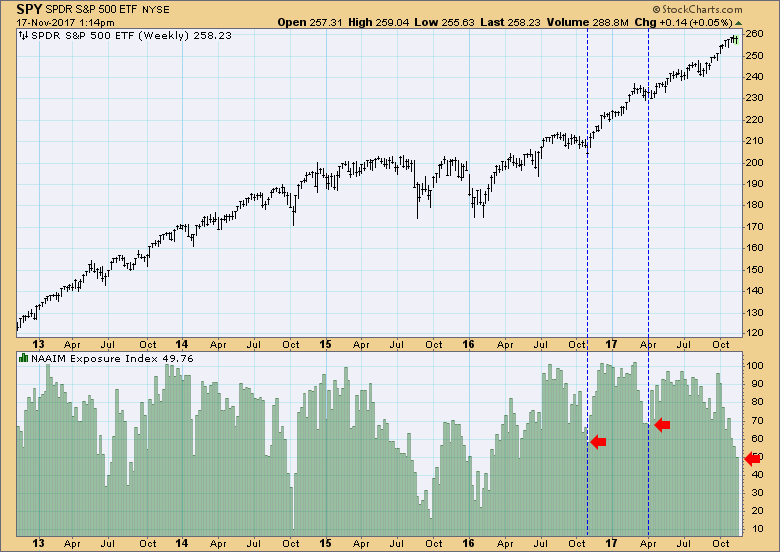
DP Weekly Wrap: NAAIM Exposure Index Highest Reading Ever
by Carl Swenlin,
President and Founder, DecisionPoint.com
This week the National Association of Active Investment Managers (NAAIM) Exposure Index reached the highest reading since its inception in 2006. Rather than stay 100% invested, NAAIM members will raise or lower their fund's market exposure based upon their assumptions regarding future market action. The potential range of...
READ MORE
MEMBERS ONLY
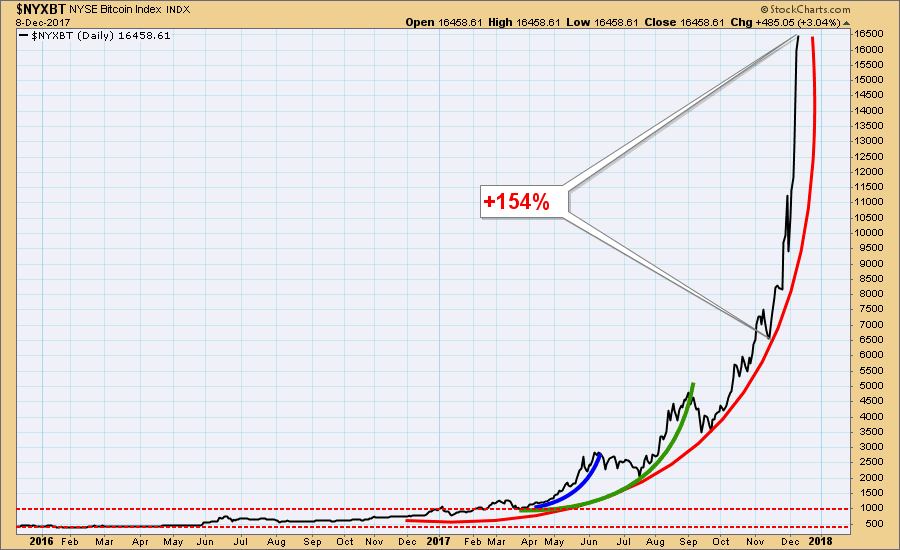
DP Weekly Wrap: BitBubble
by Carl Swenlin,
President and Founder, DecisionPoint.com
In the DP Weekly Wrap I normally lead with a chart of the market, but this week Bitcoin was so prominent in the news, I thought a chart of the Bitcoin Index would be more appropriate. What we have here is a classic parabolic advance (the red arc), with price...
READ MORE
MEMBERS ONLY
DP Weekly Wrap: Blowoff
by Carl Swenlin,
President and Founder, DecisionPoint.com
There were a couple of news stories on which to blame Friday's pullback, but my opinion is that the vertical up move of the prior three days was a short-term blowoff that needed to be corrected. The blowoff is most readily identified by the rapidly expanding volume midweek,...
READ MORE
MEMBERS ONLY
DP Weekly Wrap: No Holiday Surprises
by Carl Swenlin,
President and Founder, DecisionPoint.com
Thanks mostly to a pop on Tuesday the market once again moved to new, all-time highs. Typical of holiday trading volume was lower than average, except for Tuesday, which had a surge confirming the price advance. Positive market action on a holiday week was no surprise, considering the persistent strength...
READ MORE
MEMBERS ONLY
DP Weekly Wrap: Incongruous Sentiment
by Carl Swenlin,
President and Founder, DecisionPoint.com
When I posted the NAAIM (National Association of Active Investment Managers) Exposure Index this week, I thought to myself, "What's wrong with this picture?". To clarify, rather than stay fully invested all the time, NAAIM members adjust their exposure based upon their assessment of market conditions,...
READ MORE
MEMBERS ONLY
DP Weekly Wrap: Buy the Dip? What Dip?
by Carl Swenlin,
President and Founder, DecisionPoint.com
I should probably watch less business news, but I only have it on to catch any big news developments, and the sound is usually off. Nevertheless, I can't avoid some stuff that I'd rather filter out. For example, there was talk on Thursday and Friday about...
READ MORE
MEMBERS ONLY
DP Weekly Wrap: Not Out of the Woods Yet
by Carl Swenlin,
President and Founder, DecisionPoint.com
Of my comment, "Not out of the woods yet," you might ask, "What woods?" The market, after all, did manage to grind higher this week, so what's the problem? The problem that I see is a persistent weakness in our intermediate-term indicators, but we...
READ MORE
MEMBERS ONLY
DP Weekly Wrap: Another Blink Moment
by Carl Swenlin,
President and Founder, DecisionPoint.com
Last week there was a one-day decline that didn't actually last a whole day. On Wednesday this week there was a rather more robust decline, but it didn't last a full day either, and the market took back a good chunk of its losses by the...
READ MORE
MEMBERS ONLY
DP Weekly Wrap: If You Blinked, You Missed It!
by Carl Swenlin,
President and Founder, DecisionPoint.com
Back in September the market had a small pullback that took all of three days (blue circle on chart below). This week I was expecting at least something similar, but all that happened was an intraday dip on Thursday that disappeared by the time the market closed! Then on Friday...
READ MORE
MEMBERS ONLY
DP Weekly Wrap: Parabolic Neutralized
by Carl Swenlin,
President and Founder, DecisionPoint.com
Last week I identified a short-term parabolic advance, a pattern in which price advances in an ever-steepening upward curve. Typically parabolics become too steep and they collapse. In this case price moved sideways through the curve, effectively neutralizing the bearish implications of the formation. We currently have a small rising...
READ MORE
MEMBERS ONLY
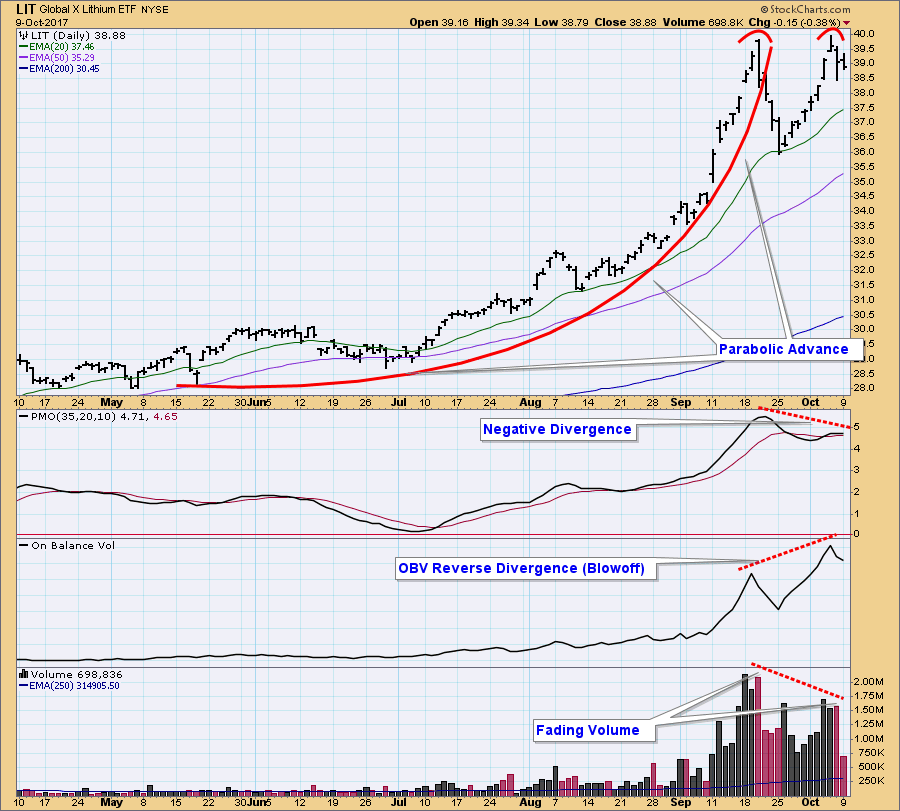
Lithium ETF (LIT) Looks Bearish
by Carl Swenlin,
President and Founder, DecisionPoint.com
This morning I saw a commercial for the Global X Lithium ETF (LIT), and I thought, "Hmmm, lithium . . . batteries for iPhones, MacBooks, etc." So I pulled up a chart of LIT, and all kinds of things jumped out at me.
First I saw the parabolic advance that got...
READ MORE
MEMBERS ONLY
DP Weekly Wrap: Impervious Rally
by Carl Swenlin,
President and Founder, DecisionPoint.com
I awoke Monday morning to news of the outrage that had taken place in Las Vegas the night before, and I experienced the now all-to-familiar feelings of weariness at the state of the world. There has been enough rehash of this terrible event, and my purpose of mentioning it was...
READ MORE
MEMBERS ONLY
DP Weekly/Monthly Wrap: Market Still Overbought
by Carl Swenlin,
President and Founder, DecisionPoint.com
Last week I thought that a market correction was beginning, but all we got was a one-day, downside blip that ended at the low on Monday. From there the market edged higher, closing at new, all-time highs on Thursday and Friday. Nevertheless, the gain for the week was less than...
READ MORE
MEMBERS ONLY
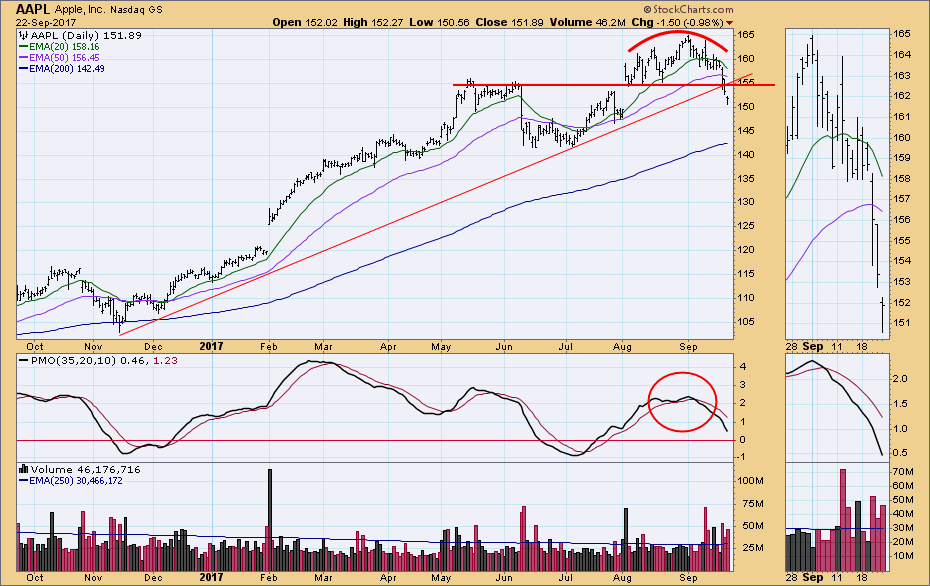
DP Weekly Wrap: AAPL Leads Market Top
by Carl Swenlin,
President and Founder, DecisionPoint.com
We usually feature a SPY chart in this space, but Apple (AAPL) has really grabbed my attention recently. I have been watching it for a few weeks as it formed a rounded top, and finally broke down through horizontal support on Thursday. AAPL is important to the broad market because...
READ MORE
MEMBERS ONLY
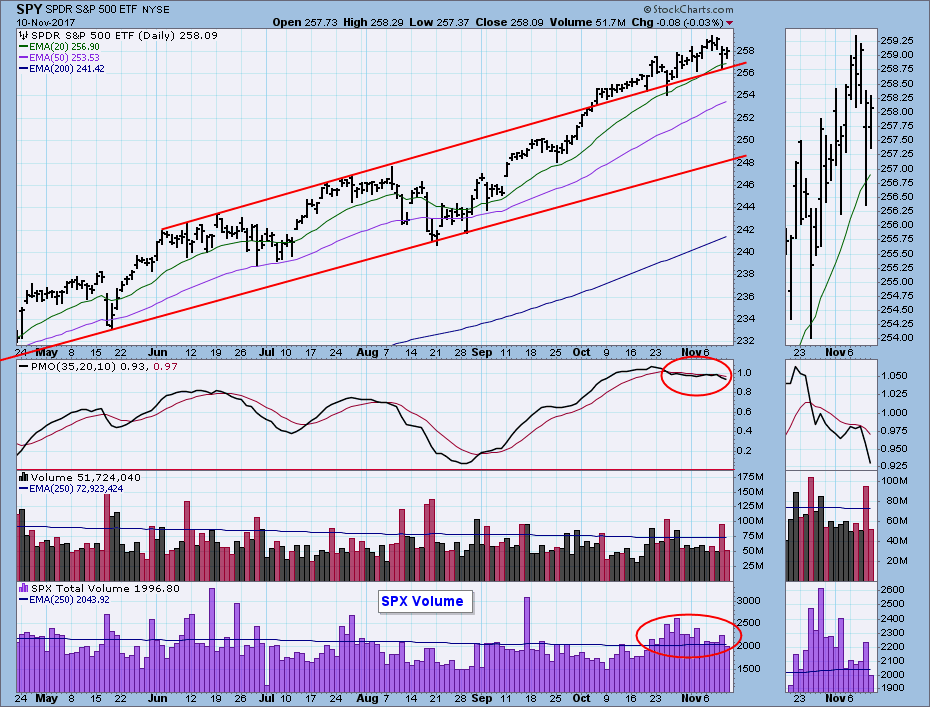
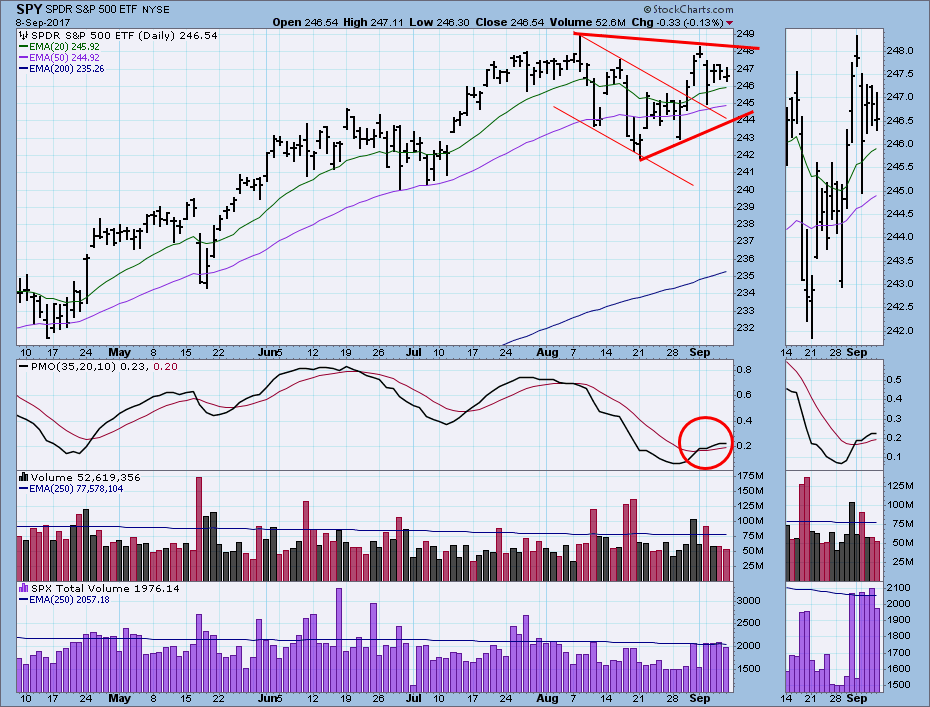
DP Weekly Wrap: Climax and Options Expiration Slow Advance
by Carl Swenlin,
President and Founder, DecisionPoint.com
For a few weeks I have been expecting an upside breakout, and on Monday the breakout finally happened. The internal action on that day indicated that a buying climax had taken place, an event that very often leads to some post-climax churning or pullback. Also, this was an options expiration...
READ MORE
MEMBERS ONLY
DP Weekly Wrap: Dollar Weak, Gold Strong
by Carl Swenlin,
President and Founder, DecisionPoint.com
Last week there was a high-volume breakout above a declining tops line. This week price pulled back to the line, bounced somewhat higher, then moved sideways the rest of the week. S&P 500 total volume was fairly robust compared to the weaker SPY trading volume, so there was...
READ MORE
MEMBERS ONLY
DP Weekly Wrap: Water, Water, Everywhere . . .
by Carl Swenlin,
President and Founder, DecisionPoint.com
Greg Morris gave us an article on "Fake News!" this week, and it prompted me to reflect on how much "Flood News" we have gotten: Reporters standing in water, reporters standing in front of water, reporters standing in the rain in front of water and in...
READ MORE
MEMBERS ONLY
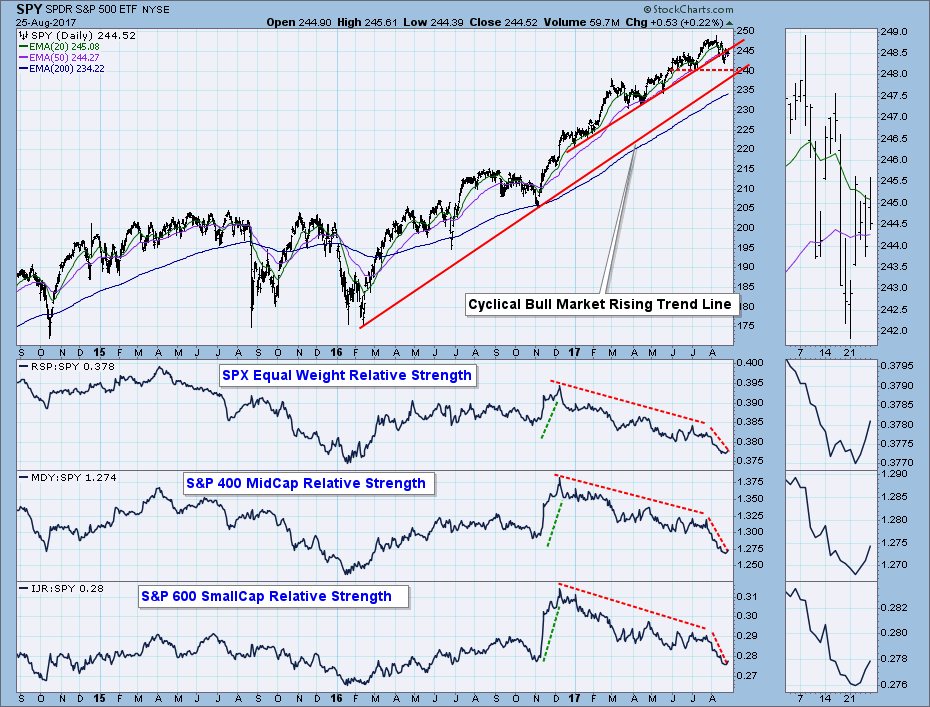
DP Weekly Wrap: Smaller-Cap Stocks Lagging
by Carl Swenlin,
President and Founder, DecisionPoint.com
While we usually focus on the large-cap market indexes, they often disguise what is happening with smaller-cap stocks. Recently I decided to delve into this question with a chart showing the relative strength of smaller-cap indexes. The first relative strength panel examines all S&P 500 stocks on an...
READ MORE
MEMBERS ONLY
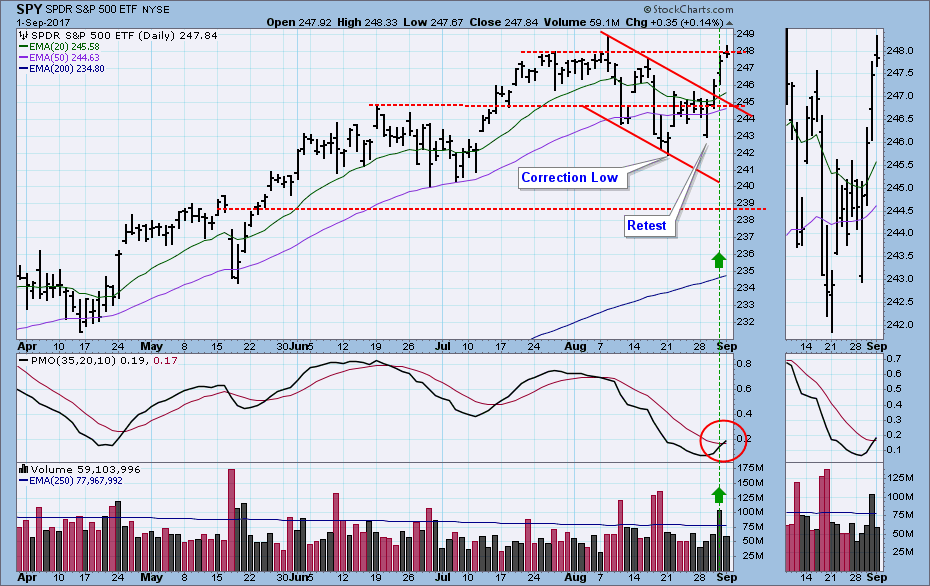
DP Weekly Wrap: Failed Retest
by Carl Swenlin,
President and Founder, DecisionPoint.com
Last week I wrote: "I would like for the correction to continue for a while, but honestly, we may have just hit bottom." Well, the market did make a bottom, but it was just for a short bounce prior to this week's failed retest of last...
READ MORE
MEMBERS ONLY
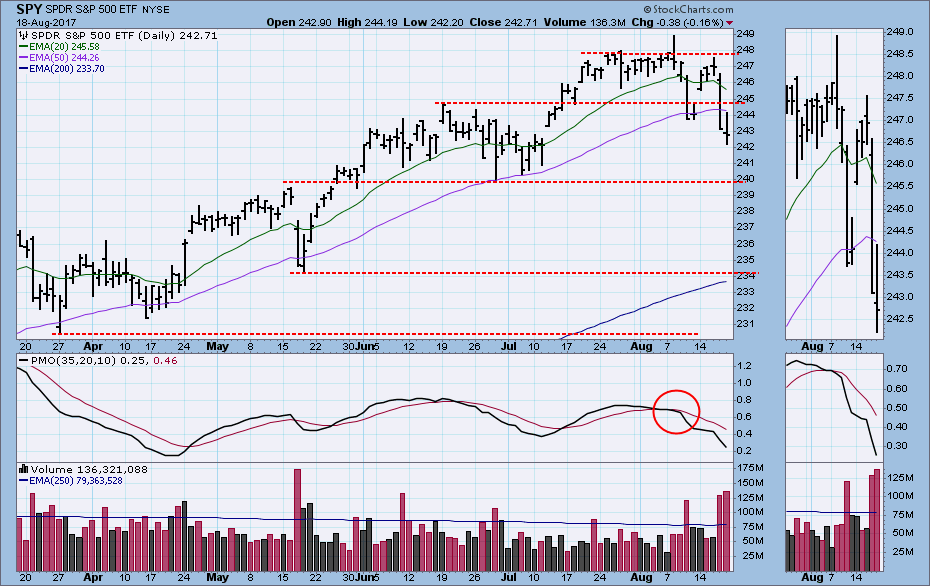
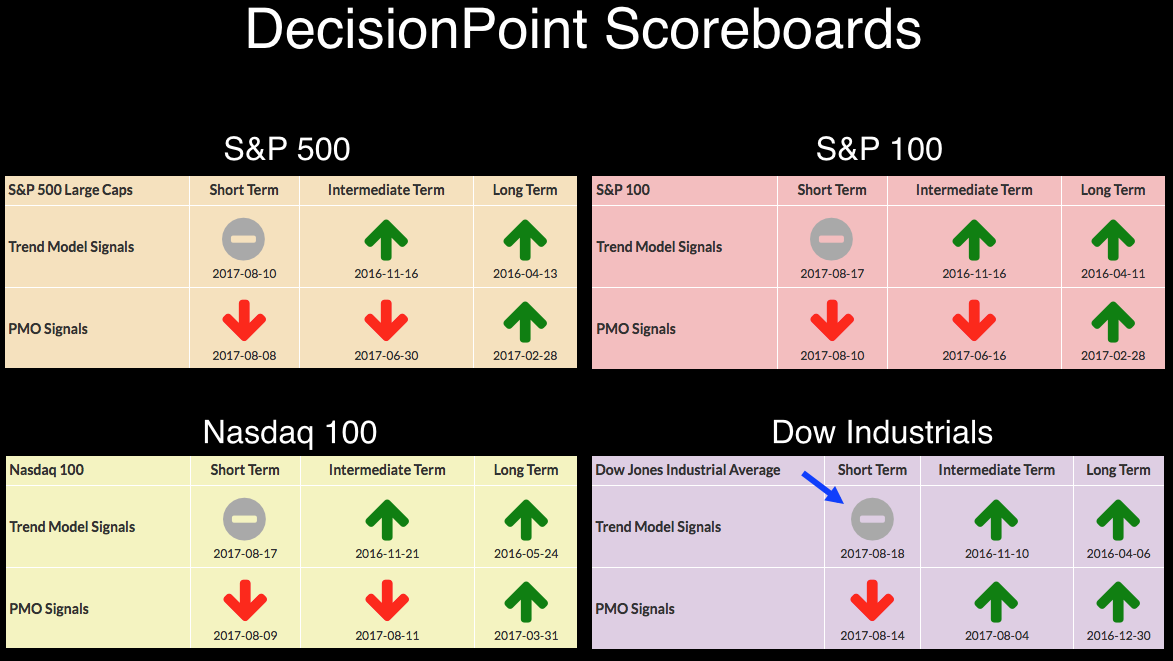
DP Bulletin: Dow Industrials ($INDU) Generates ST Trend Model NEUTRAL Signal
by Carl Swenlin,
President and Founder, DecisionPoint.com
Today the Dow Jones Industrial Average ($INDU) 5EMA crossed down through the 20EMA, changing a Short-Term Trend Model (STTM) BUY signal to NEUTRAL.
Recently we have been plagued by deluge of whipsaw signals on the other three major indexes we track here, but the Dow has been quite unambiguous, holding...
READ MORE
MEMBERS ONLY
Market Is Very Overvalued
by Carl Swenlin,
President and Founder, DecisionPoint.com
The market has been rising ahead of earnings for over two years, and it is very overvalued. Nevertheless, bullish investors seem unconcerned. The chart below shows the S&P 500 Index (black line) in relation to where it would be if it were undervalued (P/E 10 - green...
READ MORE
MEMBERS ONLY
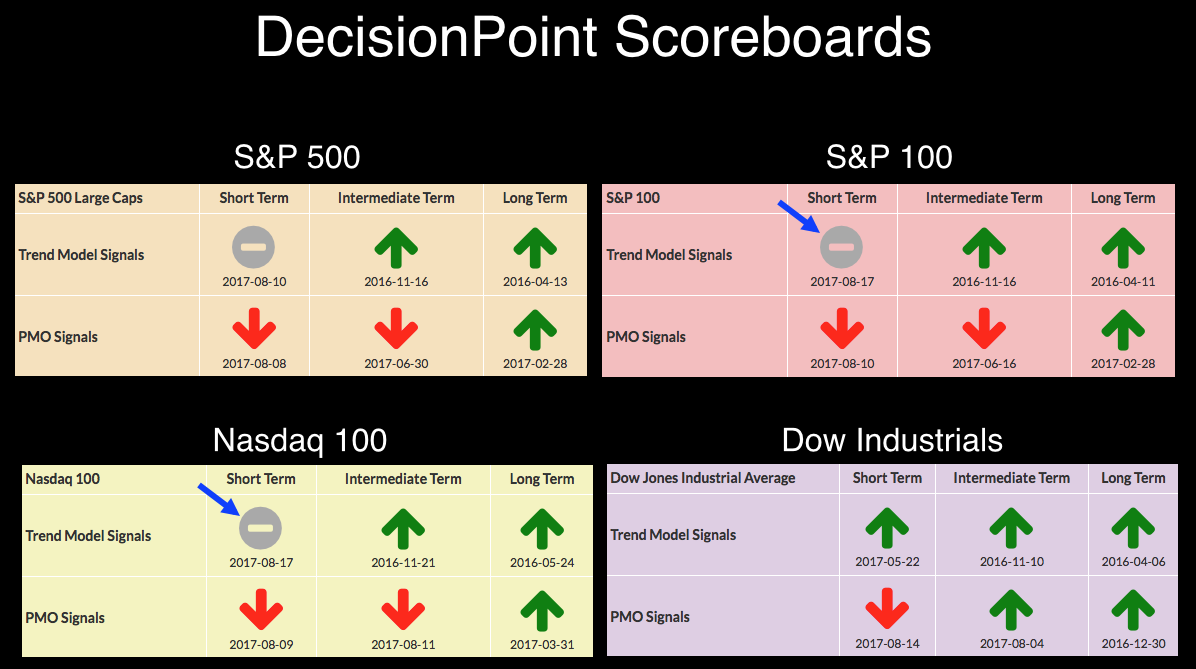
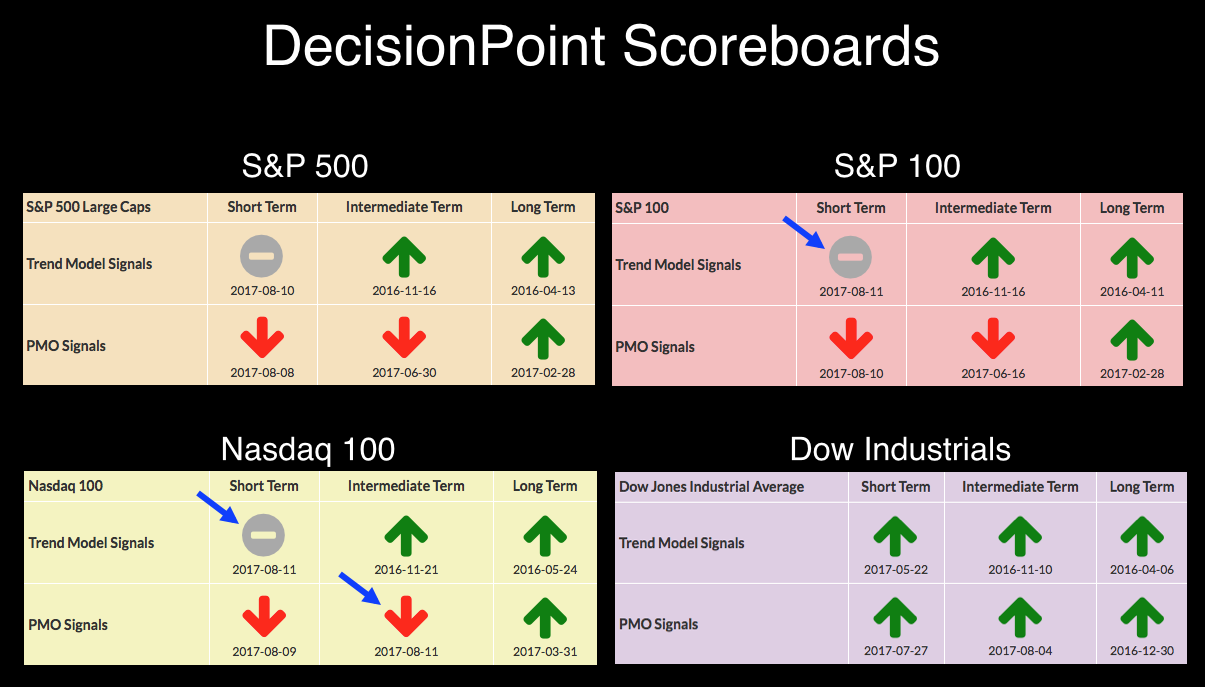
DP Bulletin: S&P 100 and Nasdaq 100 ST Trend Models Switch Back to NEUTRAL
by Carl Swenlin,
President and Founder, DecisionPoint.com
Today both the S&P 100 ($OEX) and Nasdaq 100 ($NDX) Indexes switched from Short-Term Trend Model BUY signals to NEUTRAL, when their 5EMAs crossed back down through their 20EMAs. With only two days since the last signal changes, this is more annoying whipsaw, but I think these signals...
READ MORE
MEMBERS ONLY
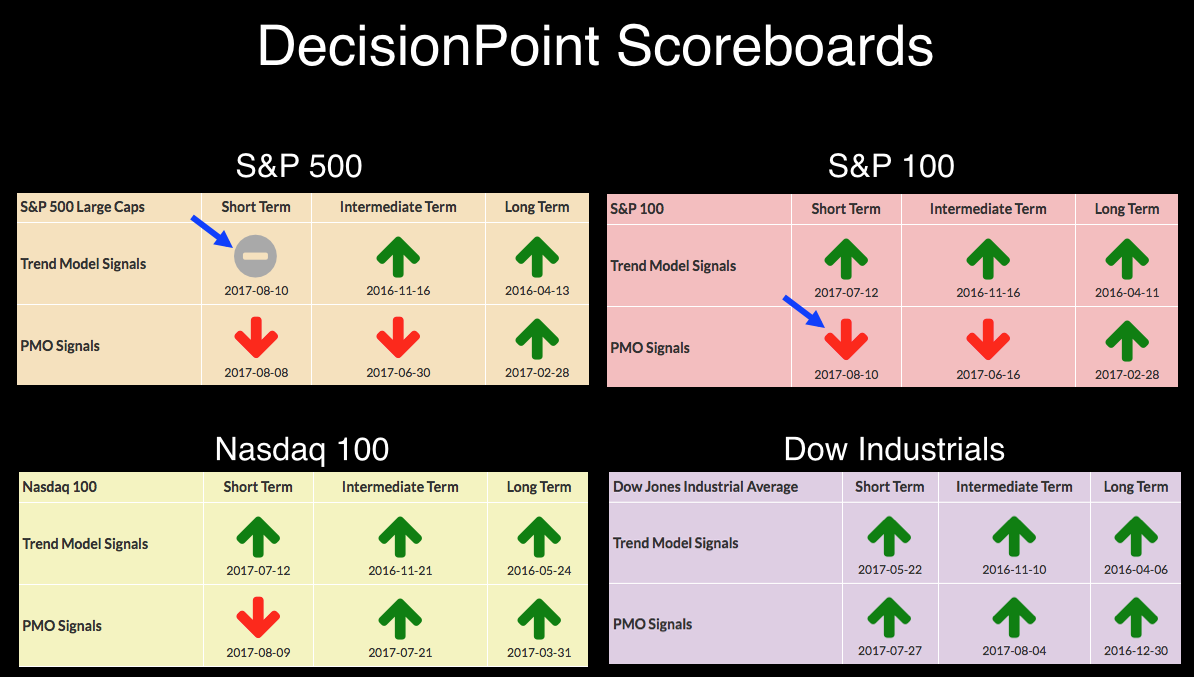
DP Bulletin: Three New Short-Term Signals
by Carl Swenlin,
President and Founder, DecisionPoint.com
On Friday the S&P 100 ($OEX) and Nasdaq 100 ($NDX) had Short-Term Trend Model (STTM) signal changes from BUY to NEUTRAL. Today they switched back to BUY. The dreaded whipsaw again. Also, the Dow Jones Industrial Average ($INDU) had a short-term PMO signal change from BUY to SELL....
READ MORE
MEMBERS ONLY
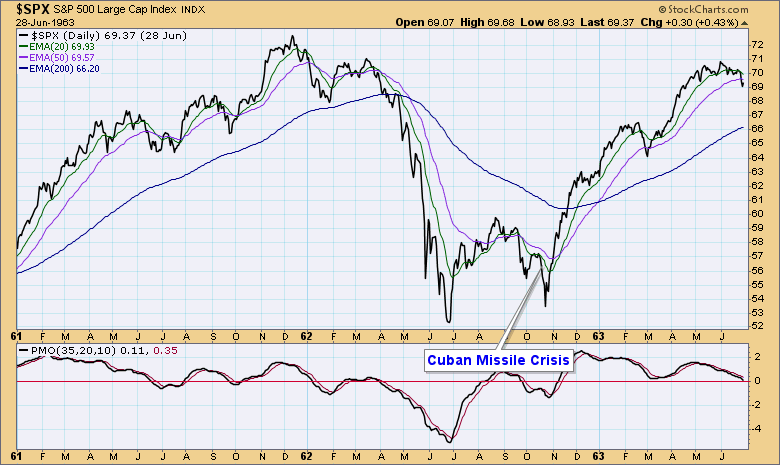
DP Weekly Wrap: NoKo Stumble (Supposedly)
by Carl Swenlin,
President and Founder, DecisionPoint.com
In October 1962 I was a 21-year-old B-47 aircraft mechanic in the Strategic Air Command. One morning that month I reported for duty only to find the aircraft ramp covered with bombers loaded with nuclear weapons. Welcome to the Cuban Missile Crisis. It was pretty tense for a few weeks,...
READ MORE
MEMBERS ONLY
DP Bulletin: Three New Signals Generated
by Carl Swenlin,
President and Founder, DecisionPoint.com
Today there were three signal changes: The S&P 100 Index ($OEX) and Nasdaq 100 Index ($NDX) had Short-Term Trend Model (STTM) signals change from BUY to NEUTRAL. And the Nasdaq 100 ($NDX) intermediate-term PMO BUY signal changed to SELL.
The two daily charts of $OEX and $NDX below...
READ MORE
MEMBERS ONLY
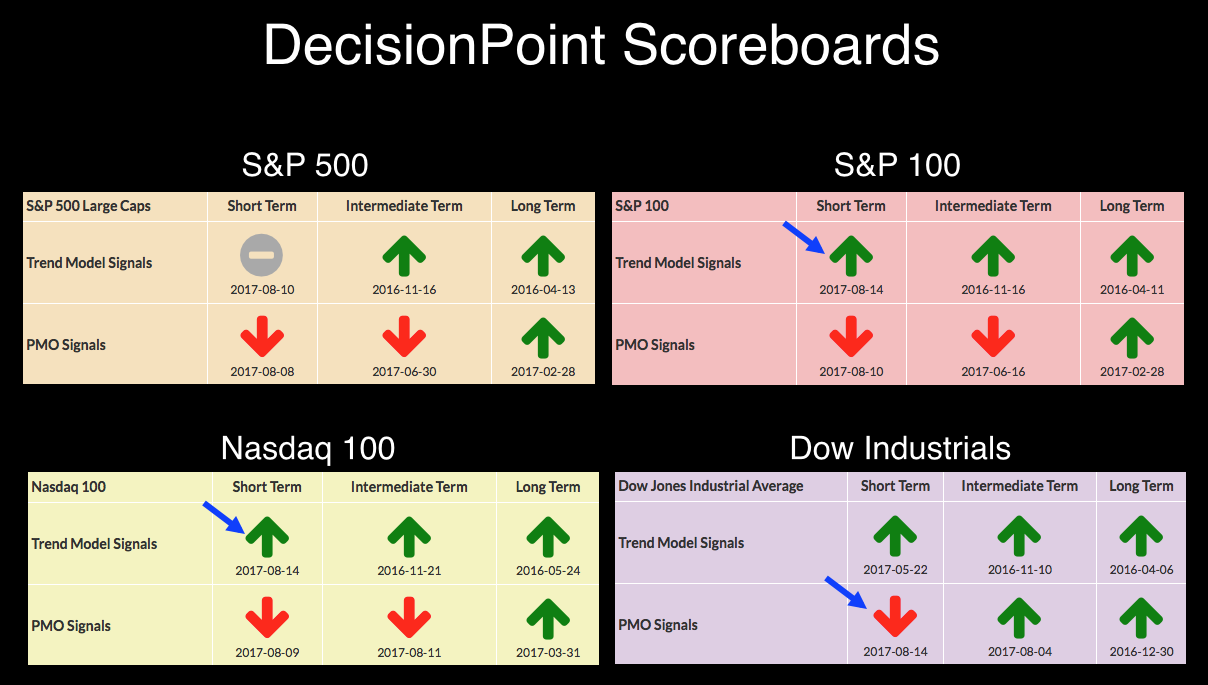
DP Bulletin: S&P 100 ($OEX) Generates ST PMO SELL Signal; S&P 500 Generates ST Trend Model NEUTRAL Signal
by Carl Swenlin,
President and Founder, DecisionPoint.com
Today the S&P 100 Index ($OEX) daily PMO crossed down through its signal line and generated a short-term PMO SELL signal. Of the four major indexes on our score board, three have switched to short-term PMO SELL signals. Additionally, the S&P 500 Index 5EMA crossed down...
READ MORE
MEMBERS ONLY
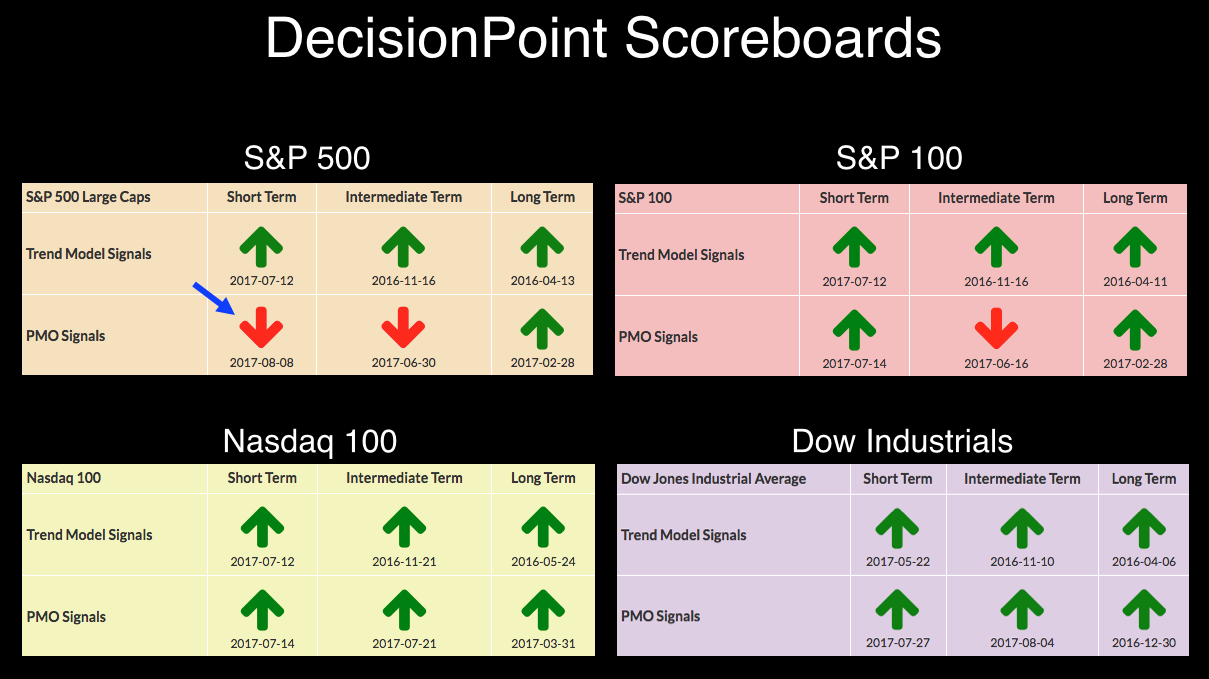
DP Bulletin: Nasdaq 100 ($NDX) Generates ST PMO SELL Signal
by Carl Swenlin,
President and Founder, DecisionPoint.com
Today on the daily chart the Nasdaq 100 ($NDX) PMO dropped below its signal line and generated a short-term PMO SELL signal.
This is not what I would call a robust crossover. It is more the inevitable result of price running flat to slightly down, which causes the PMO and...
READ MORE
MEMBERS ONLY
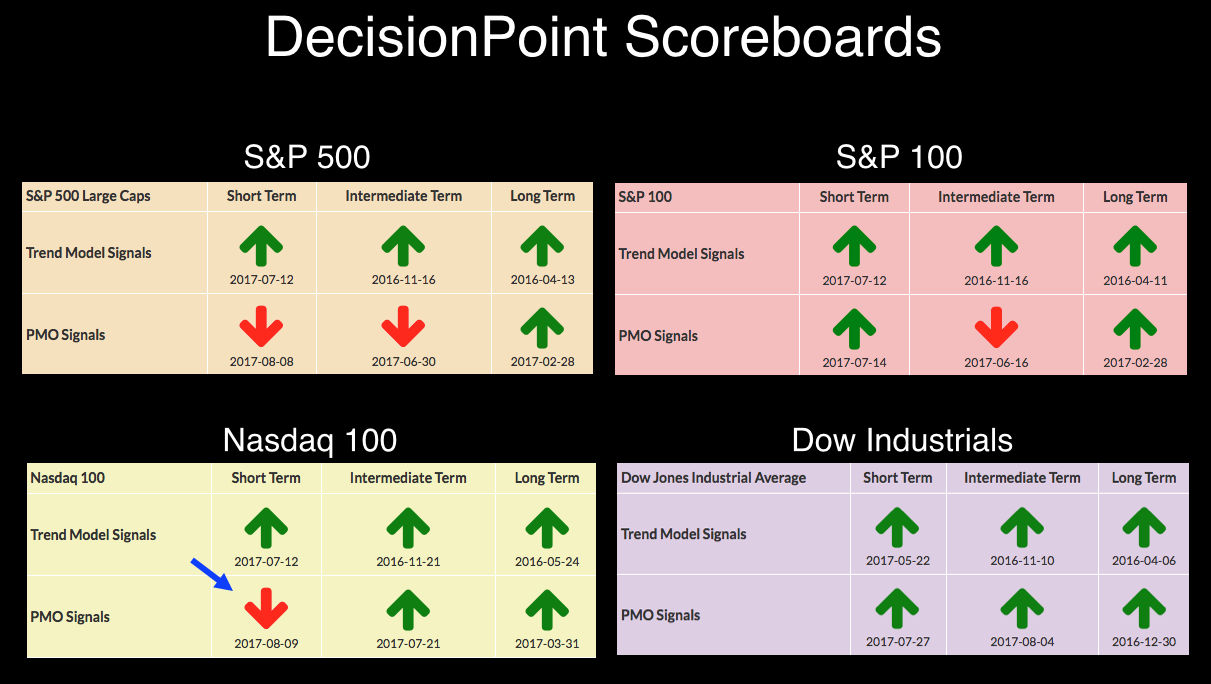
DP Bulletin: S&P 500 ($SPX) Generates ST PMO SELL Signal
by Carl Swenlin,
President and Founder, DecisionPoint.com
Today on the daily chart the $SPX PMO dropped below its signal line and generated a short-term PMO SELL signal. More notable, price opened and traded higher, but then it reversed and closed lower -- a key reversal day.
The line chart shows the modestly overbought PMO topping, then falling...
READ MORE
MEMBERS ONLY
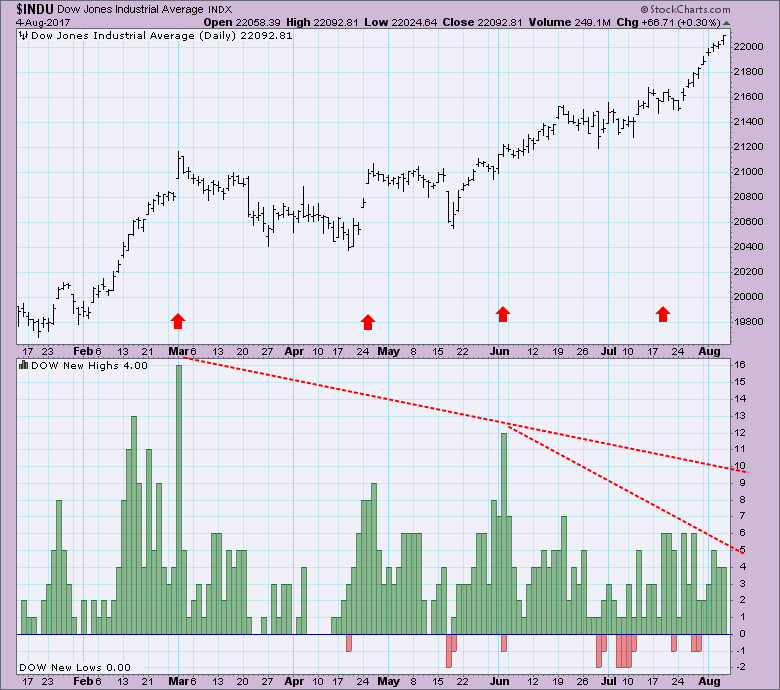
Watching Support Fade
by Carl Swenlin,
President and Founder, DecisionPoint.com
As the Dow Jones Industrial Average (DJIA) has been moving steadily to record highs, I have observed a persistent erosion of underlying support as expressed by 52-Week New Highs for the DJIA component stocks. The New High peak in March represents the highest level reached recently, and we can see...
READ MORE
MEMBERS ONLY
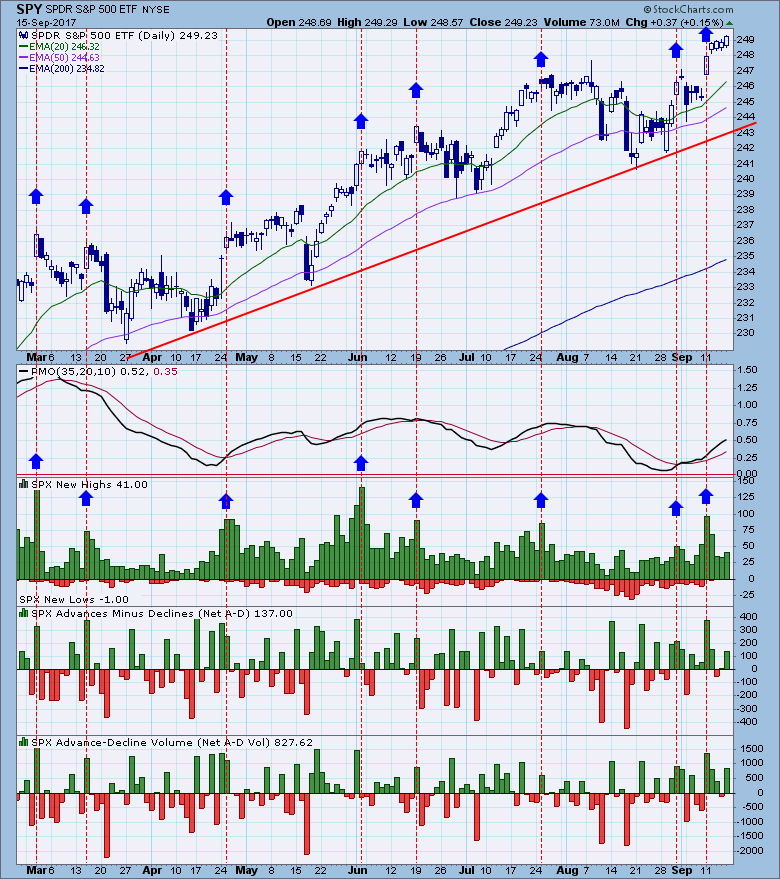
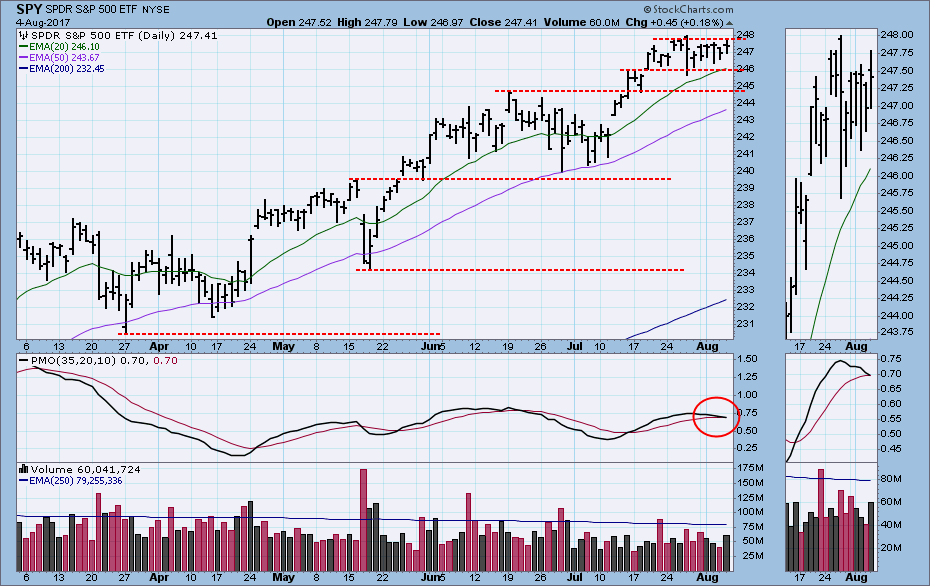
DP Weekly Wrap: Top Still Not Resolved
by Carl Swenlin,
President and Founder, DecisionPoint.com
Last week it looked as if the market was beginning to form a top, but that result still hasn't been realized. SPY continued to churn sideways, and the daily PMO came within a hair of crossing down through its signal line. There is still evidence that there is...
READ MORE