MEMBERS ONLY
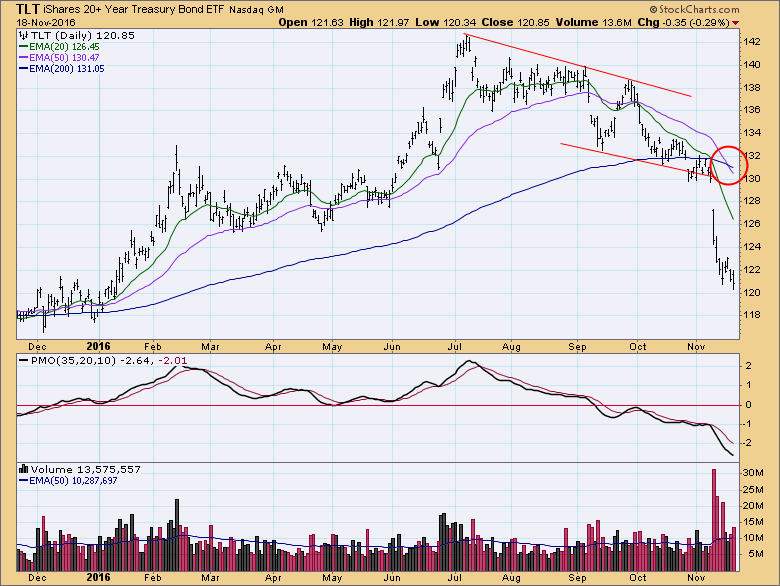
There Are Bear Markets Out There
by Carl Swenlin,
President and Founder, DecisionPoint.com
When we discuss bear markets, we usually think of the major market indexes, the S&P 500 Index in particular; however, any price index -- market sector or even an individual stock -- can be experiencing a bear market, even in the midst of a broad-based bull market like...
READ MORE
MEMBERS ONLY
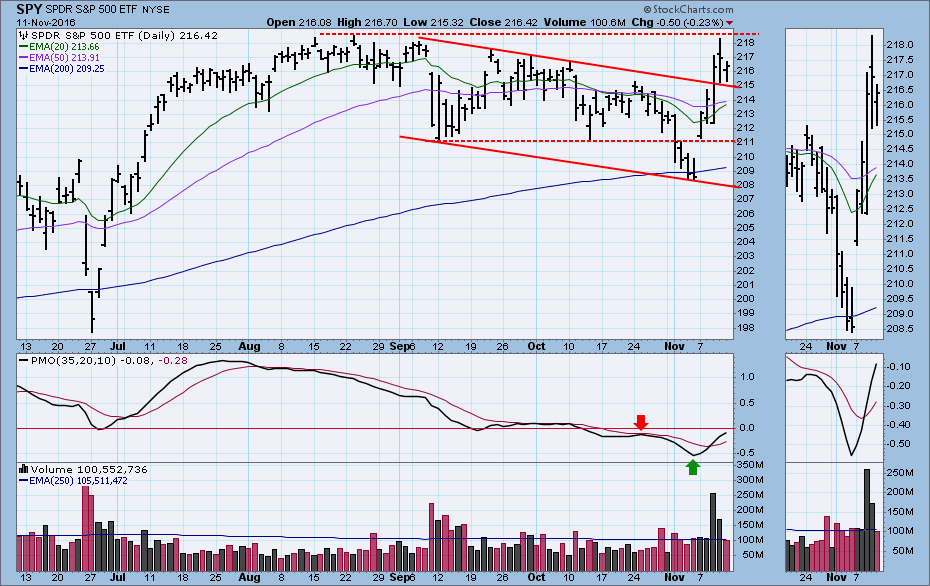
SPY Close to Major Breakout, but . . .
by Carl Swenlin,
President and Founder, DecisionPoint.com
An oversold rally began on Monday, when a Clinton win was assumed to be in the bag. Early Wednesday morning a Trump win was obvious, and the futures markets went crazy with panic -- at one point the Dow futures were down almost -800 points in pre-market trading -- but...
READ MORE
MEMBERS ONLY
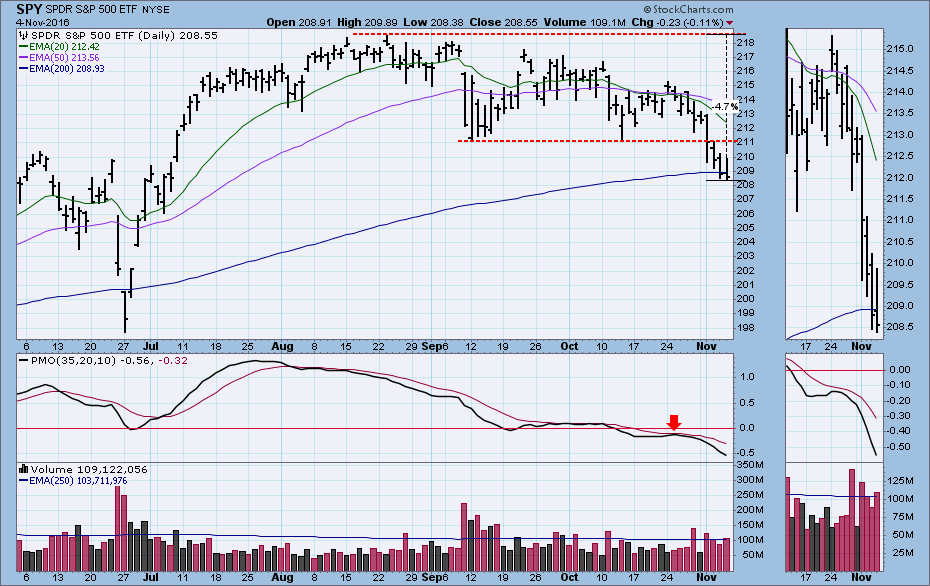
Pre-Election Market Assessment
by Carl Swenlin,
President and Founder, DecisionPoint.com
From the August price top to the present, price has been deteriorating, and this week we finally got a bottom beneath the September bottom to officially set a declining trend. I think it is notable that the falling trend has persisted from the summer, when Clinton had a clear lead...
READ MORE
MEMBERS ONLY
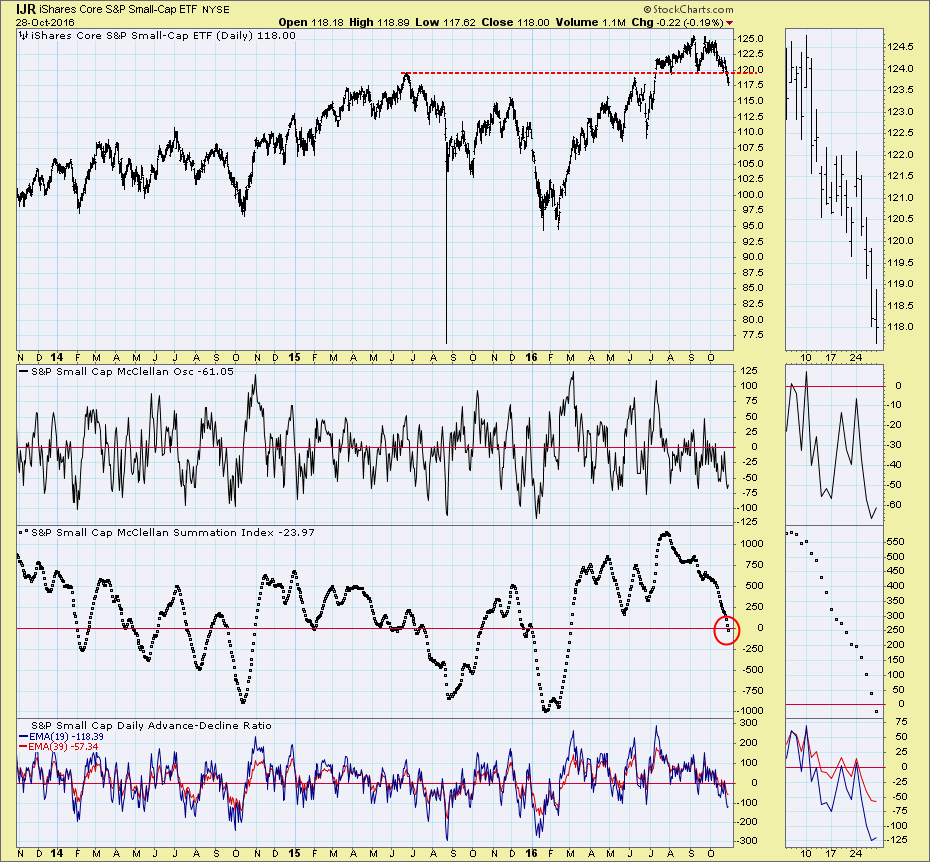
McClellan Summation Indexes Show Dangerous Conditions
by Carl Swenlin,
President and Founder, DecisionPoint.com
Last week Erin's article on the Russell 2000 gave me reason to browse the Straight Shots collection of indicator charts for the S&P 600 Small-Cap Index. Straight Shots allow us to shoot straight through a collection of indicator charts that are derived from the component stocks...
READ MORE
MEMBERS ONLY
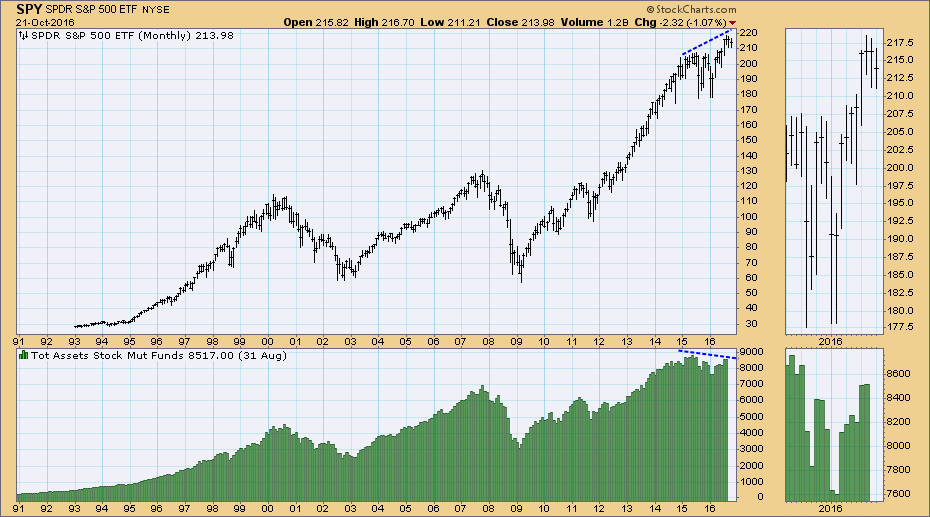
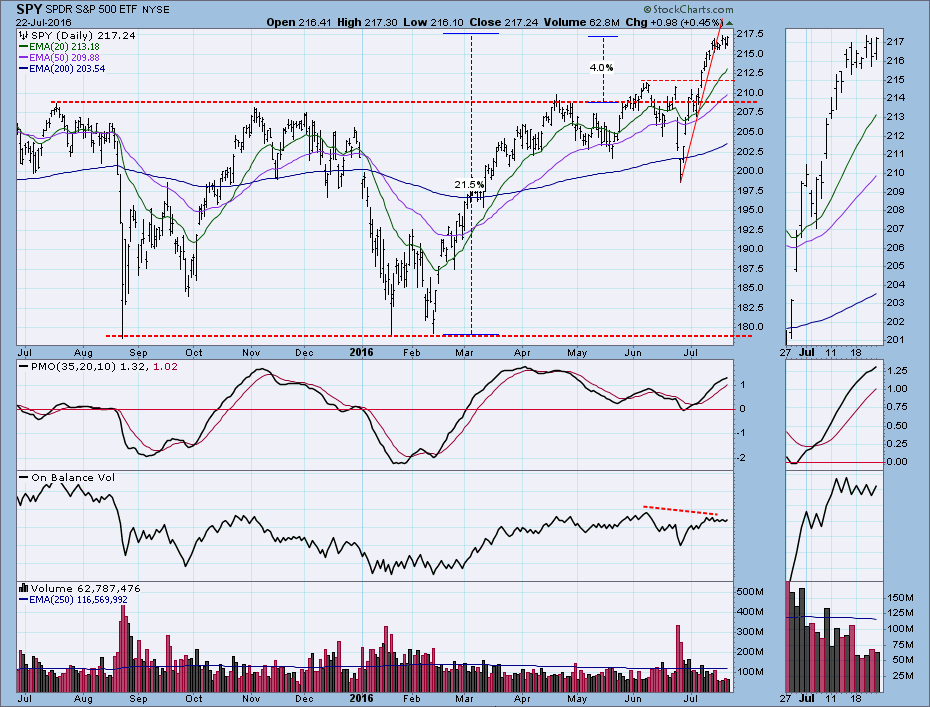
Mutual Fund Cash Flow Not Encouraging
by Carl Swenlin,
President and Founder, DecisionPoint.com
There is a negative divergence between prices and total assets in stock mutual funds. While prices have moved to all-time highs, the value of total assets in those mutual funds has actually fallen. How can this happen?
Source: ICI.org
SPY components are exclusively large-cap stocks, while total assets in...
READ MORE
MEMBERS ONLY
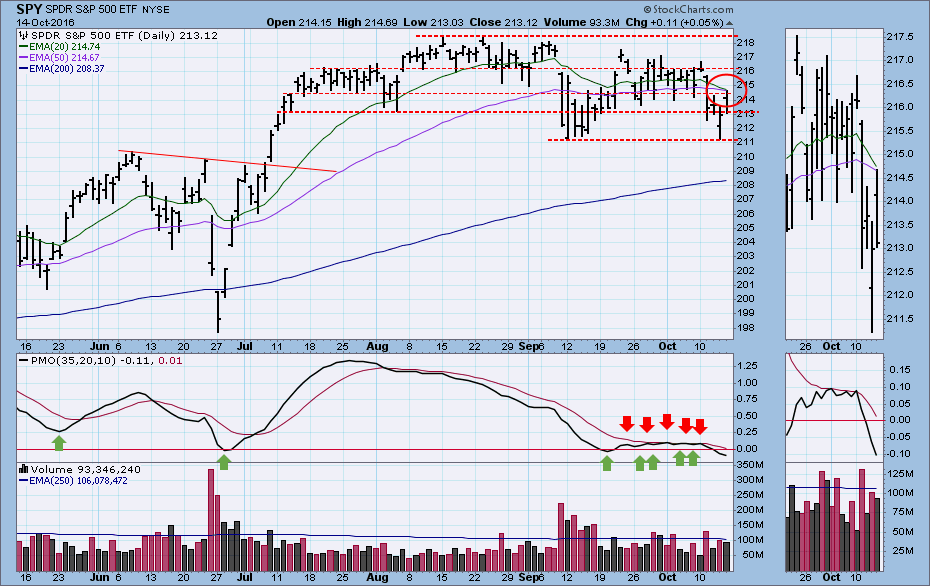
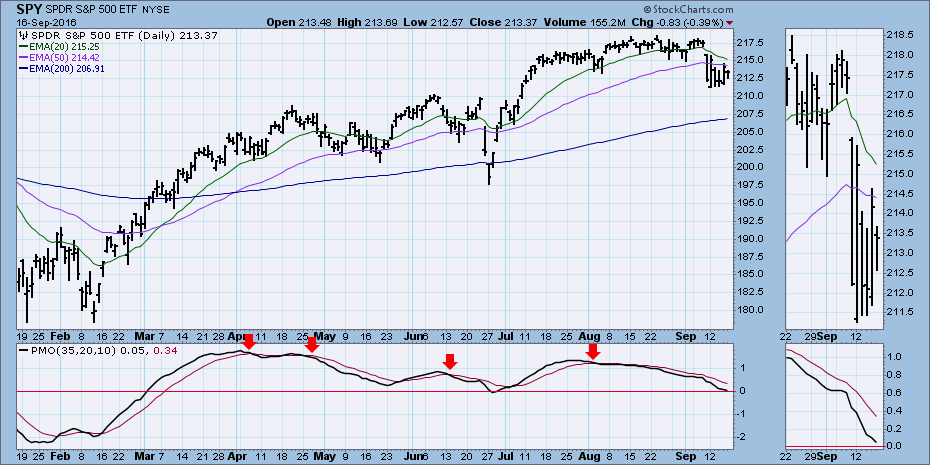
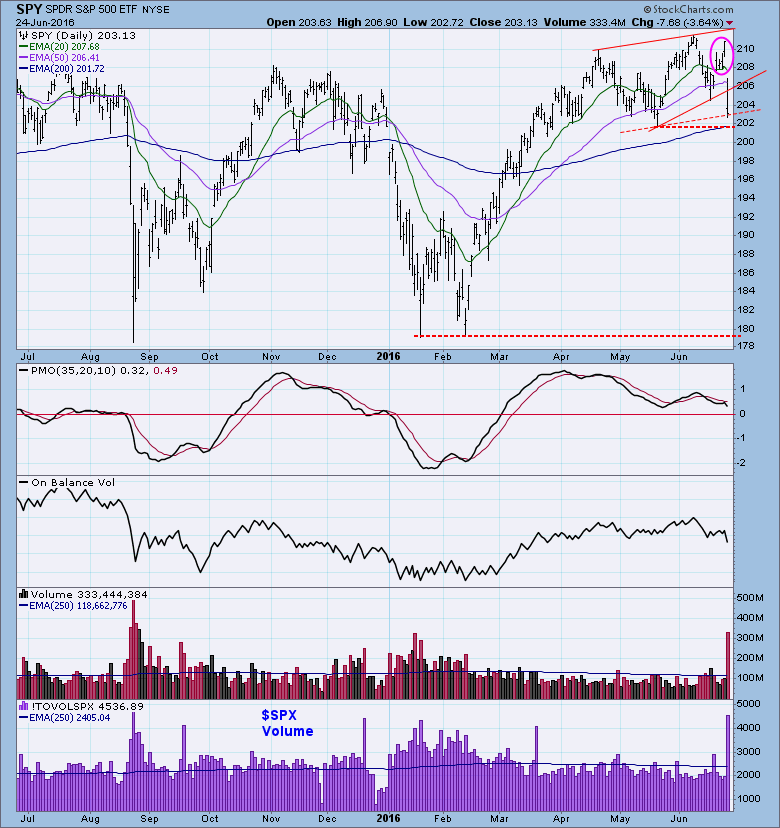
SPY: Toppy
by Carl Swenlin,
President and Founder, DecisionPoint.com
When in early-September SPY took out its August low, I thought that the fall correction was finally getting underway. But no. Instead, a slightly lower level of support was established, and price continued sideways. That support was tested successfully on Thursday, but Friday's attempt to extend the rally...
READ MORE
MEMBERS ONLY
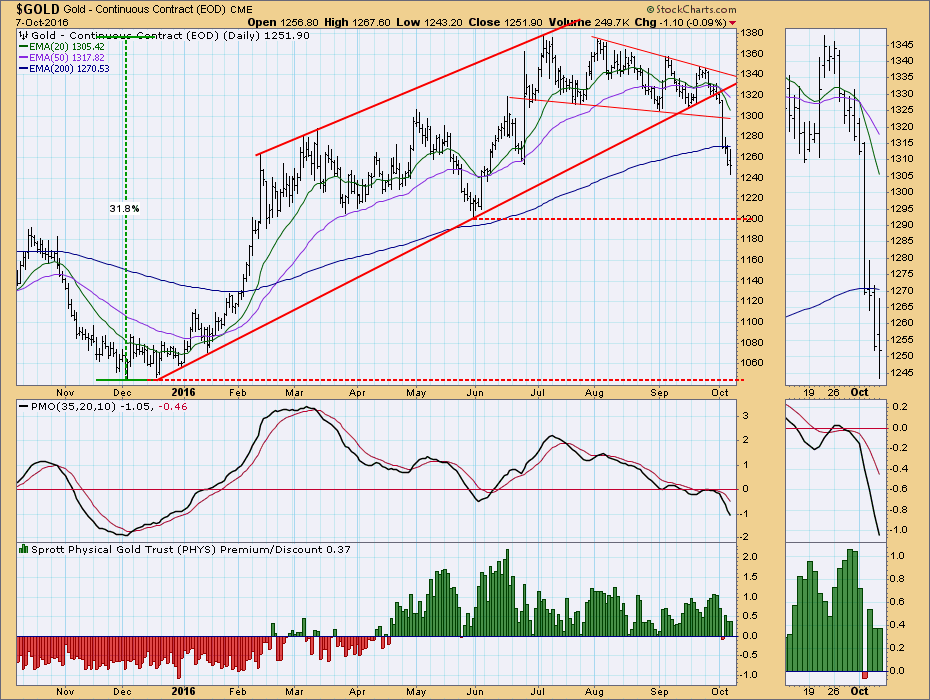
Downside Potential for Gold
by Carl Swenlin,
President and Founder, DecisionPoint.com
Gold had a bad week, decisively breaking down through a rising trend line drawn from the December low. Note that the PMO crossed down through its signal line (PMO SELL signal) a few days before the price break, and the 20EMA crossed down through the 50EMA (IT Trend Model NEUTRAL...
READ MORE
MEMBERS ONLY
SPY PMO: Not a Clean Bottom
by Carl Swenlin,
President and Founder, DecisionPoint.com
A PMO bottom is one of the first signs we get that a new up trend may be at hand, and action in the very short-term may be considered. It would be convenient if every PMO bottom was a sure thing, but, of course, that is not the case. The...
READ MORE
MEMBERS ONLY
Oversold Bounce Possible?
by Carl Swenlin,
President and Founder, DecisionPoint.com
Before we ask if an oversold bounce is possible, we should ask if the market is oversold. Looking at the chart below, the PMO is just above the zero line. While that level proved to be oversold after the Brexit vote at the end of June, a more typical oversold...
READ MORE
MEMBERS ONLY
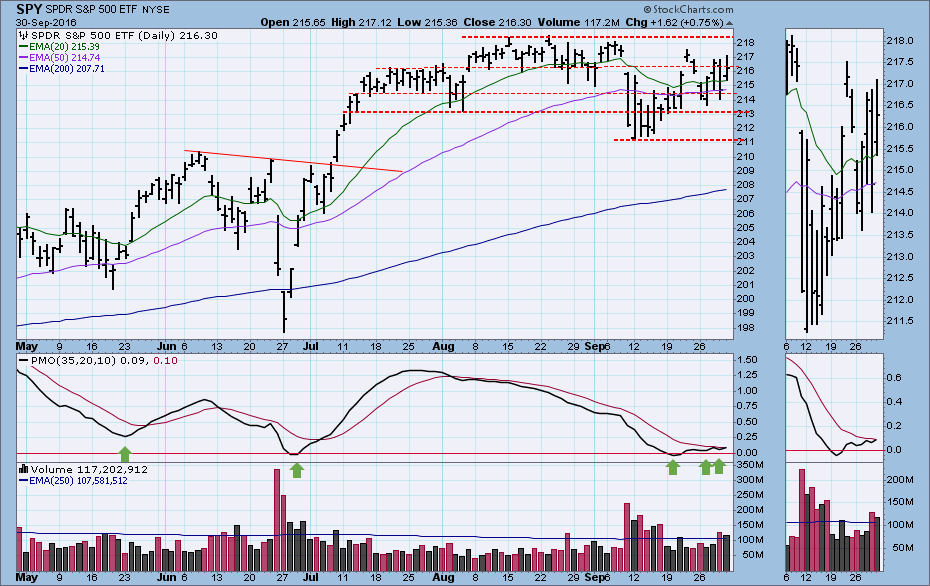
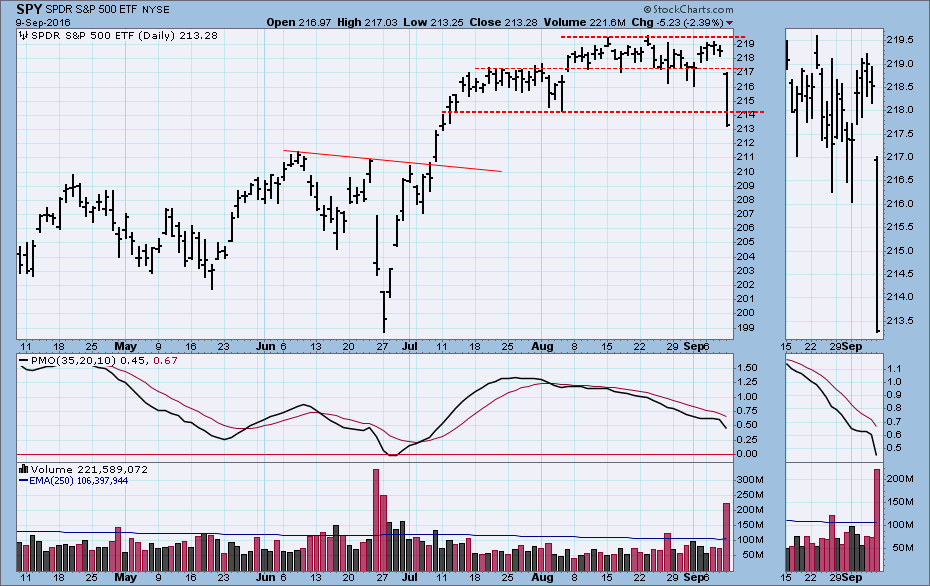
SPY: Finally a Breakdown
by Carl Swenlin,
President and Founder, DecisionPoint.com
Last week in my article, Two More Months of This Stuff?, I wondered if the market would continue to move in the narrow, boring two-month trading range. This week we got the answer: No. The chart below shows Friday's high-volume breakdown through the support line drawn across the...
READ MORE
MEMBERS ONLY
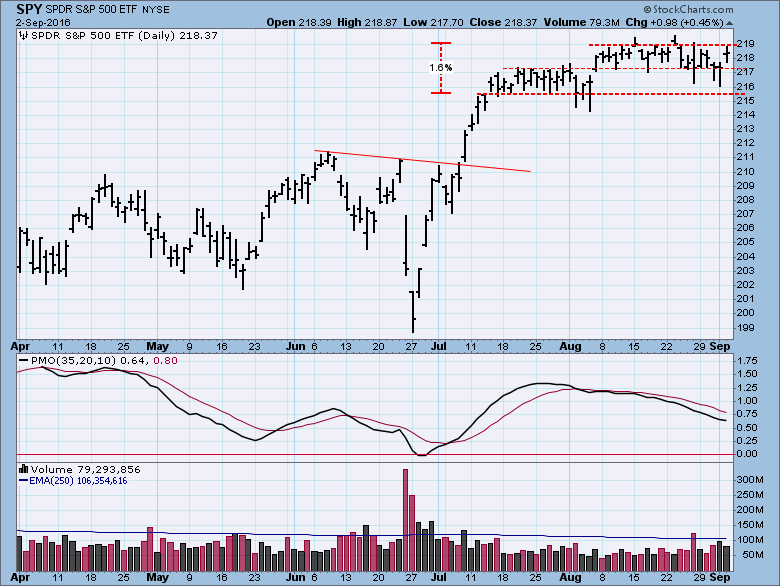
Two More Months of This Stuff?
by Carl Swenlin,
President and Founder, DecisionPoint.com
The stock market has been trading in an extremely narrow range for almost two months. During that time I have mostly attributed this unusual action to the ambivalence of the Fed: "We really want to raise interest rates, except we really don't want to raise interest rates....
READ MORE
MEMBERS ONLY
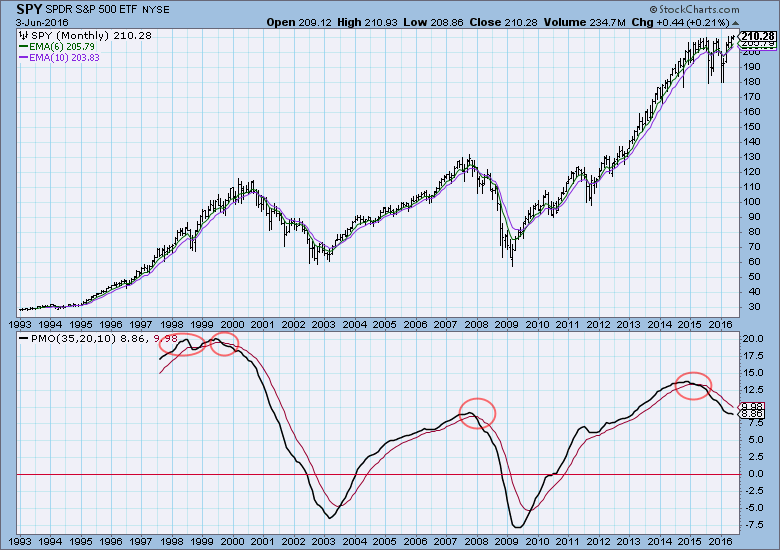
SPY: Long-Term Indicators Overbought
by Carl Swenlin,
President and Founder, DecisionPoint.com
As we watch day-to-day market action, there is a tendency to focus on shorter-term indicators and to lose touch with the longer-term picture. With this in mind, I thought it would be a good idea to look at a trio of long-term indicators that tend to escape our immediate attention....
READ MORE
MEMBERS ONLY
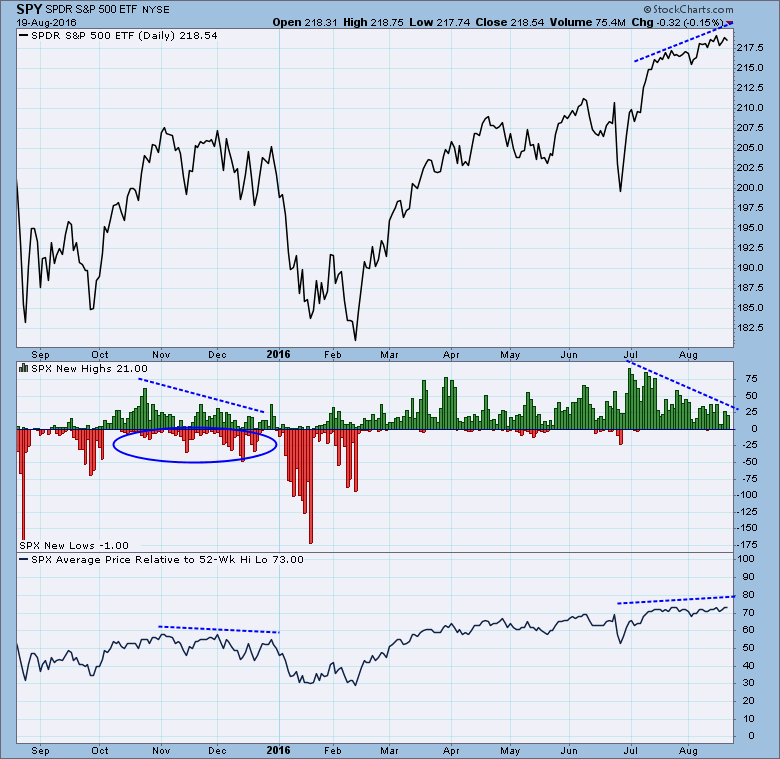
New Highs Contracting Against Higher Prices
by Carl Swenlin,
President and Founder, DecisionPoint.com
Since late-June, prices have been moving higher, while the number of new 52-week highs has been fading. On the face of it this might be cause for concern; however, there are a couple of things that mitigate this apparent weakness.
First, while new highs have been contracting, there has been...
READ MORE
MEMBERS ONLY
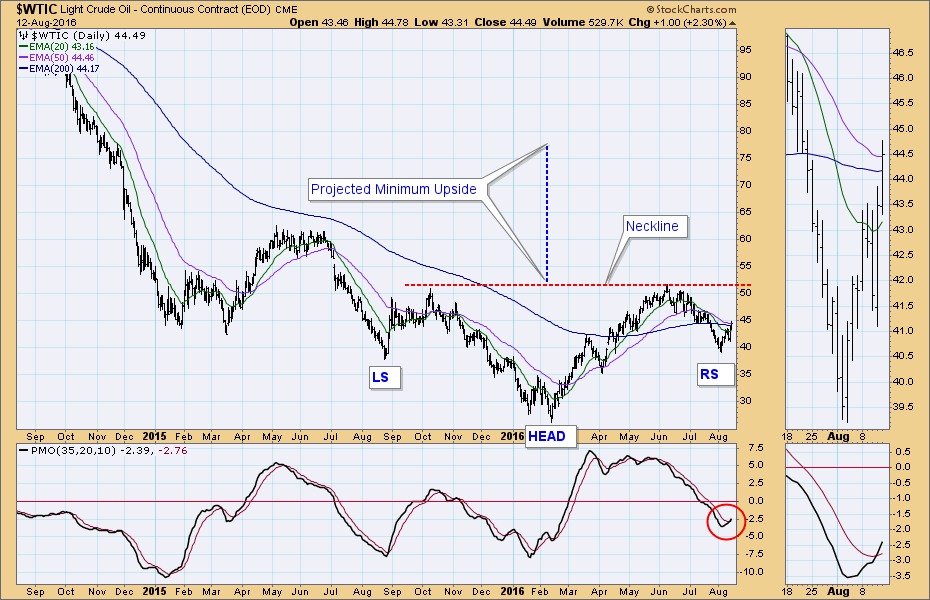
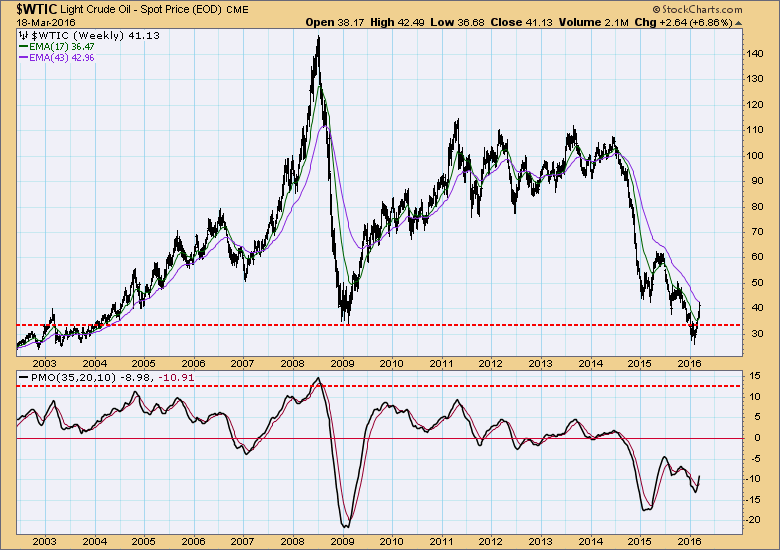
Crude Oil: Bullish Bottom
by Carl Swenlin,
President and Founder, DecisionPoint.com
In the last week a bullish reverse head and shoulders pattern has emerged on the crude oil chart. Also, the PMO generated a crossover BUY signal as it crossed up through its signal line, increasing, in my opinion, the odds that price will penetrate the neckline.
If the neckline is...
READ MORE
MEMBERS ONLY
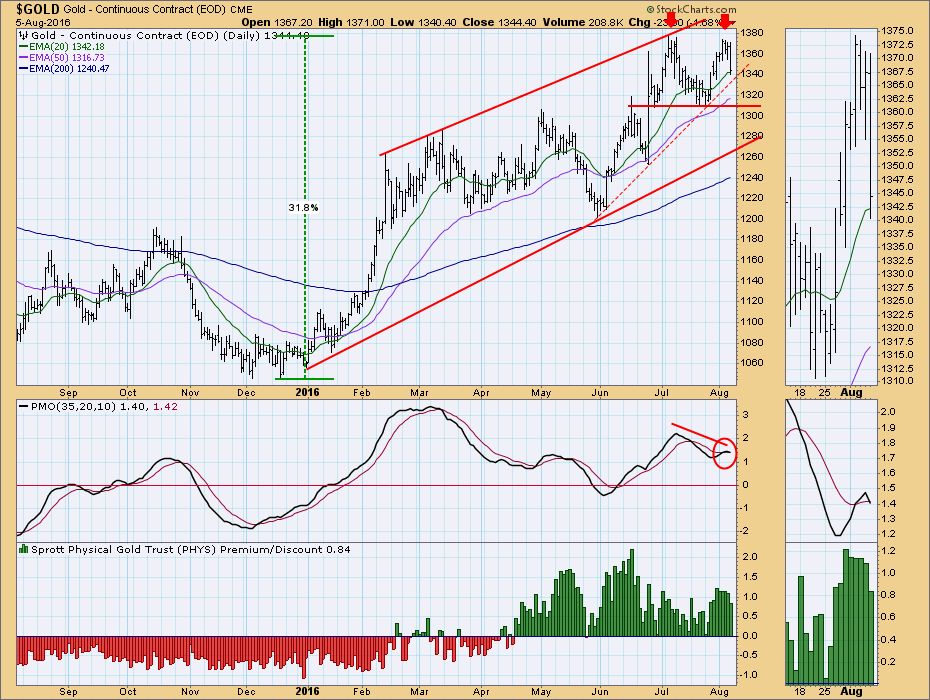
GOLD: Double Top Stall
by Carl Swenlin,
President and Founder, DecisionPoint.com
Gold has been trending upward since the beginning of this year, establishing a well-defined rising trend channel. More recently it rallied off this July's price low, making another run for the top of the channel, but it failed just short of the previous high, forming a double top....
READ MORE
MEMBERS ONLY
More Bull Market Evidence
by Carl Swenlin,
President and Founder, DecisionPoint.com
I tend to give monthly PMO direction changes heavier weight in my analysis because they often foreshadow long-term changes in the price trend. About two weeks ago the monthly PMO turned up, but monthly readings are not final until the end of the month, so I have been breathlessly watching...
READ MORE
MEMBERS ONLY
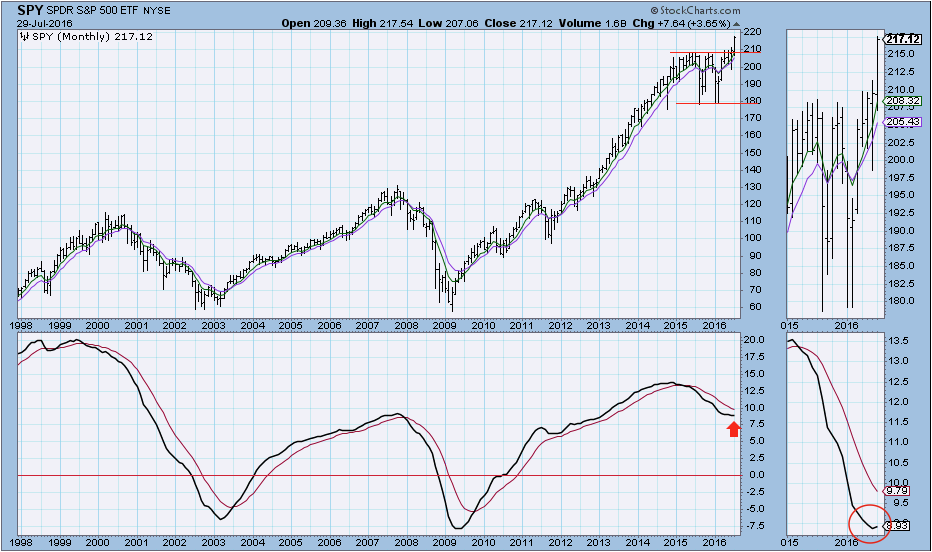
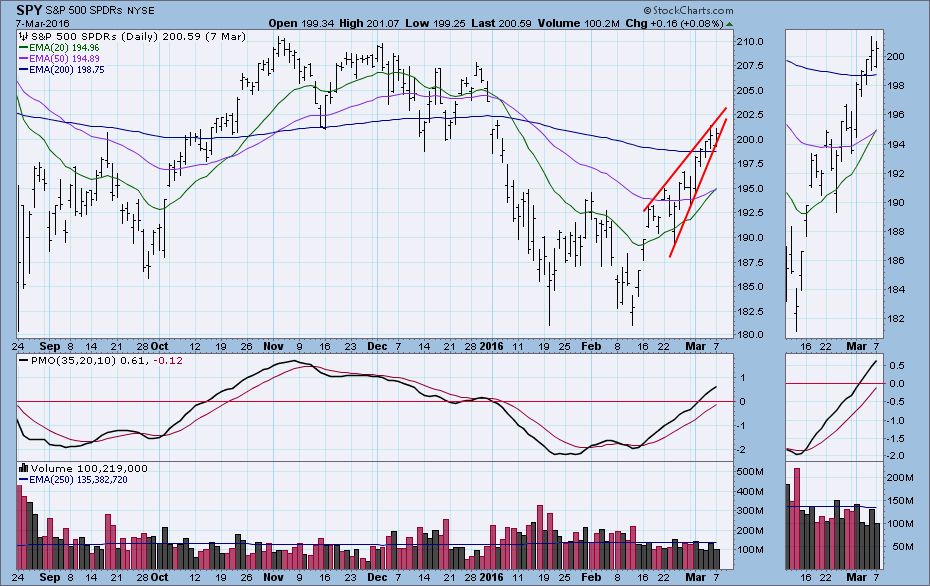
Bull Market: How Old Is It?
by Carl Swenlin,
President and Founder, DecisionPoint.com
The stock market (SPY) has: (1) advanced over +20% from its February low, (2) after breakout, advanced +4% above the top its one-year continuation pattern (consolidation), and (3) generated a DecisionPoint IT Trend Model BUY signal on March 7, 2016. By my reckoning, the bull market is at least five...
READ MORE
MEMBERS ONLY
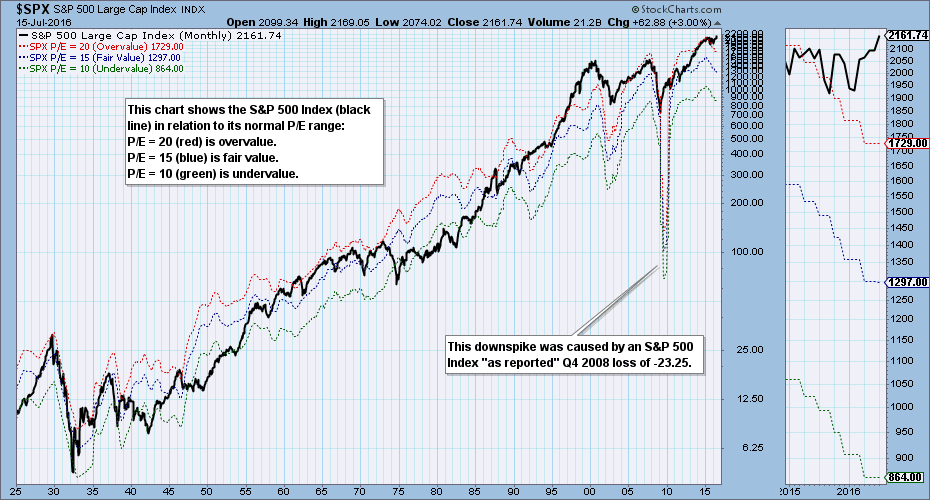
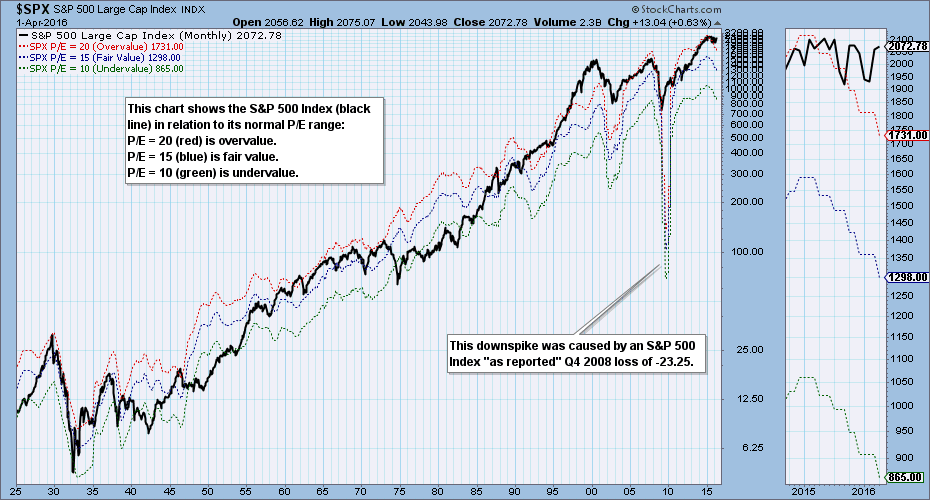
S&P 500 2016 Q1 Earnings Results: "Irrational Exuberance" Again?
by Carl Swenlin,
President and Founder, DecisionPoint.com
The S&P 500 Index 2016 first quarter earnings results are in, and it is time once again to take our quarterly look at our earnings chart, which shows the S&P 500 in relation to its normal value range. (Note: The chart is a static graphic, not...
READ MORE
MEMBERS ONLY
Wait! Was That a Bear Market?
by Carl Swenlin,
President and Founder, DecisionPoint.com
Since the monthly PMO topped in December 2014, then crossed down through its signal line in early 2015, I have been looking for a bear market to begin. There were two promising price tops in 2015, but the subsequent declines petered out at about -14% and established the lower limit...
READ MORE
MEMBERS ONLY
Market Condition After You-Know-What
by Carl Swenlin,
President and Founder, DecisionPoint.com
On the Friday ahead of the Brexit vote I made an assessment of the market condition and speculated as to what affect it might have on market action the next week. My conclusion was that the technicals were negative and would tend to weigh on the market regardless of direction....
READ MORE
MEMBERS ONLY
Friday in Context: Not Really So Bad
by Carl Swenlin,
President and Founder, DecisionPoint.com
The Brexit vote was a solid win for "Leave," even though the margin wasn't huge. The resulting market correction was not really so bad for U.S. markets; although, for global markets it was another story. Below we can see the sucker rally early in the...
READ MORE
MEMBERS ONLY
Market Condition Ahead of You-Know-What
by Carl Swenlin,
President and Founder, DecisionPoint.com
The reason for the cryptic title is that I bet Erin that I could write an article without using the word "Brexit." Doh! Whatever. The big event next week (Thursday) is the British vote to leave or remain in the European Union. As to what the U.S....
READ MORE
MEMBERS ONLY
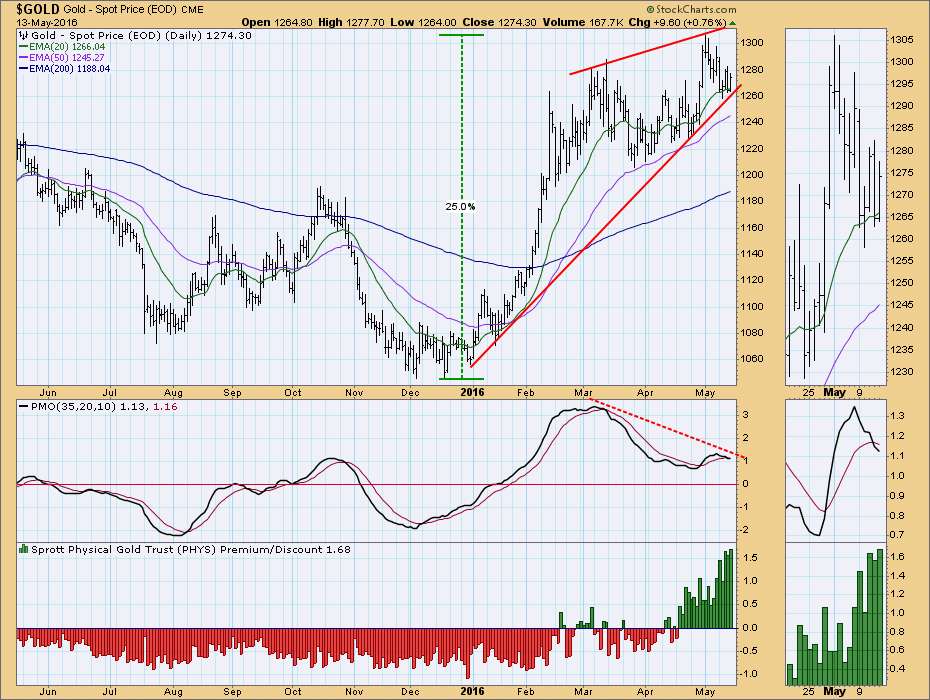
GOLD: Bullish and No "Buts"
by Carl Swenlin,
President and Founder, DecisionPoint.com
It has been almost a month since my last commentary on gold, at which time I asserted that gold was bullish but vulnerable for a pullback. On the chart below dated May 13 the primary evidence supporting a pullback was that: (1) price had formed a bearish rising wedge, a...
READ MORE
MEMBERS ONLY
SPY: Still Wary of the Advance
by Carl Swenlin,
President and Founder, DecisionPoint.com
While our timing models remain bullish, and the market continues to make marginal new highs, I have been looking for a bull market top since the monthly PMO topped in late 2014 and then crossed down through its signal line in early-2015. Well, that price top has not yet materialized,...
READ MORE
MEMBERS ONLY
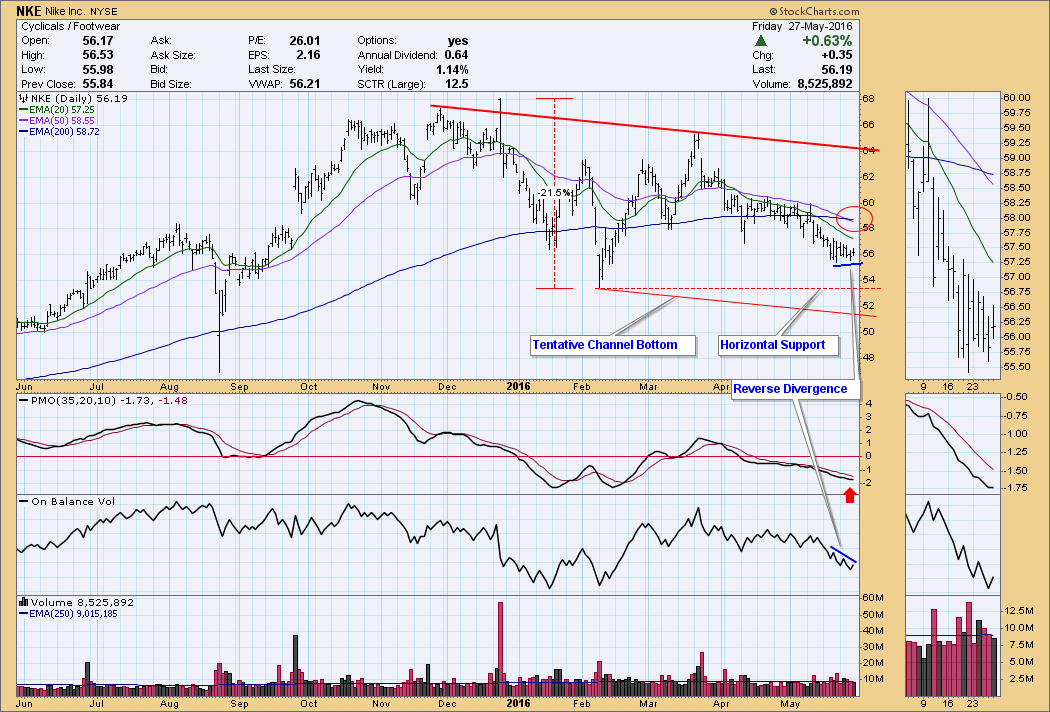
Nike: Running into Trouble?
by Carl Swenlin,
President and Founder, DecisionPoint.com
This week Nike, Inc. (NKE) officially entered a bear market when the 50EMA dropped below the 200EMA, the first time in over three years. While this is my nominal definition of a bear market, it is useful as an objective measure of price performance, and it is similar to the...
READ MORE
MEMBERS ONLY
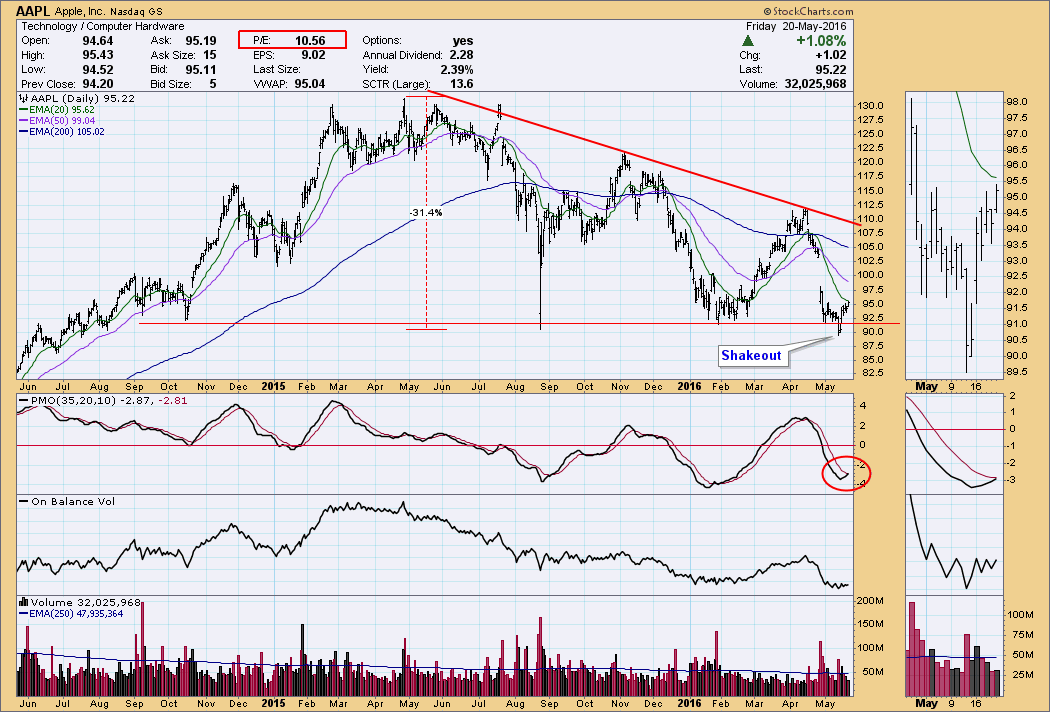
AAPL: Possible Bottom
by Carl Swenlin,
President and Founder, DecisionPoint.com
I don't spend much time with TV business news channels, but I do use them as company when I'm getting up in the morning. Several days ago there was a headline that Apple (AAPL) was down -14% this year, providing a perfect example of how business...
READ MORE
MEMBERS ONLY
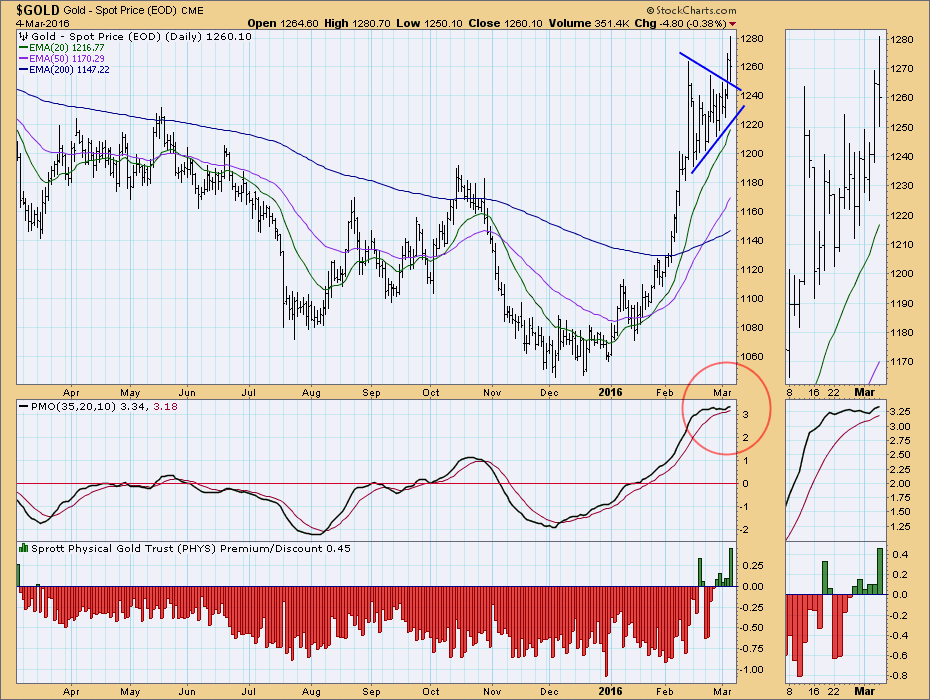
GOLD: Bullish, but Vulnerable for a Pullback
by Carl Swenlin,
President and Founder, DecisionPoint.com
Gold has been on an Intermediate-Term Trend Model (ITTM) BUY signal since January 25, 2016. The longer-term outlook is still positive, but there are signs that a price correction may be imminent. First, a rising wedge pattern has formed, and the technical expectation is that it will resolve downward. Reinforcing...
READ MORE
MEMBERS ONLY
SPY: Correction Probably Not Over
by Carl Swenlin,
President and Founder, DecisionPoint.com
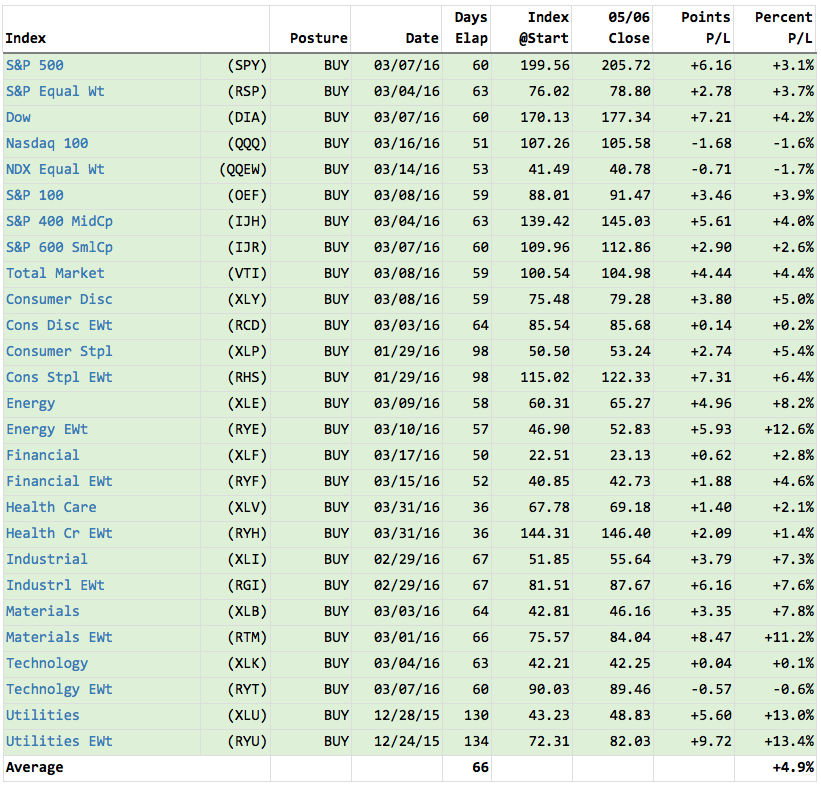
The signal table from the DecisionPoint Alert daily report shows all major market and sector indexes on Trend Model BUY signals, and all but three are profitable, so there is some cushion against the downside. However, this is just a one-dimensional picture of the market status generated by moving average...
READ MORE
MEMBERS ONLY
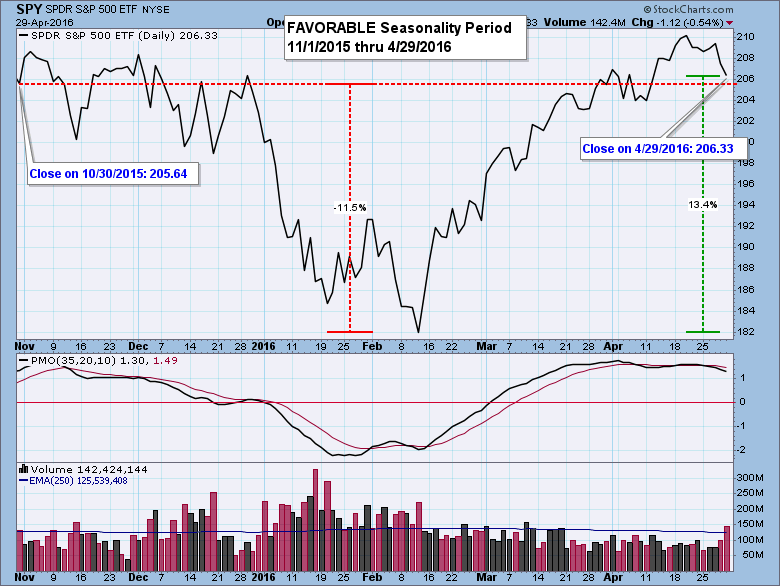
Six-Month Favorable Seasonality Period Has Ended
by Carl Swenlin,
President and Founder, DecisionPoint.com
Research published by Yale Hirsch in the Stock Trader’s Almanac shows that the market year is broken into two six-month seasonality periods. The period from May 1 through October 31 is seasonally unfavorable, and the market most often finishes lower than it was at the beginning of the period....
READ MORE
MEMBERS ONLY
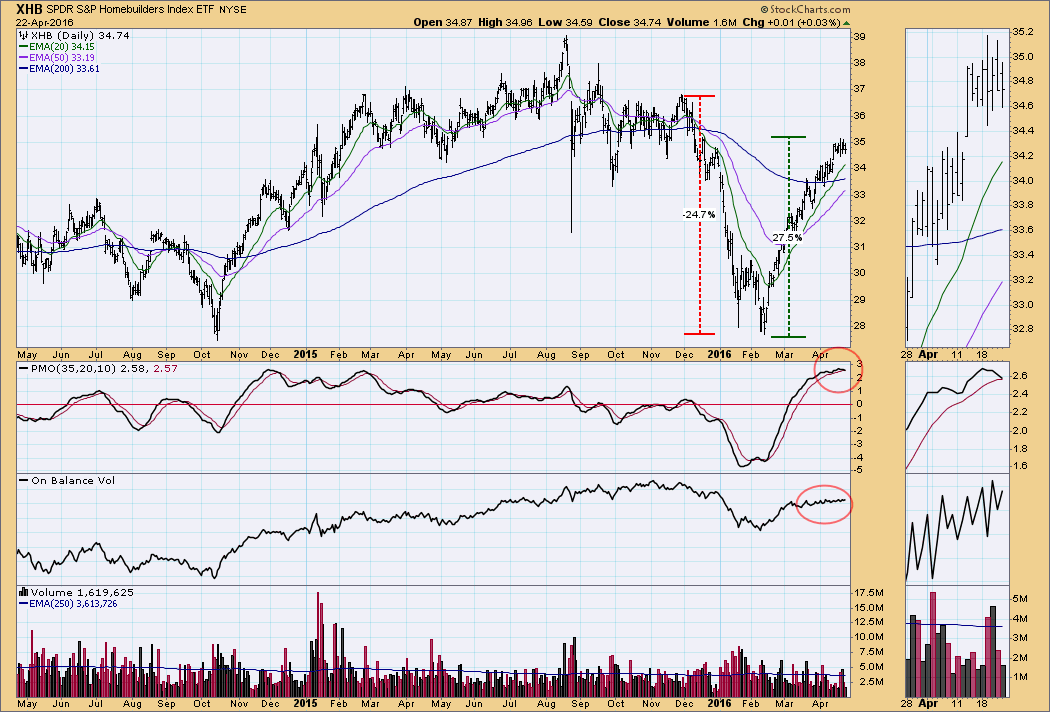
Homebuilders: Watch for Correction
by Carl Swenlin,
President and Founder, DecisionPoint.com
The Homebuilders sector (XHB) has had an interesting six months, declining -25% from the December high, then rallying +27% from the February low. Now the internals are implying that a correction is about to start.
First, the PMO has topped in very overbought territory, and it is about the cross...
READ MORE
MEMBERS ONLY
Something Good from the Good Old Days
by Carl Swenlin,
President and Founder, DecisionPoint.com
Back in the early-1980s I began my studies of the stock market, and my initial focus was on on-balance volume (OBV). Every evening I would get the evening paper and extract price and volume data on a small group of stocks, and then record those data on eight-column ledger paper....
READ MORE
MEMBERS ONLY
GOLD: Correction Over?
by Carl Swenlin,
President and Founder, DecisionPoint.com
After the 2011 top, gold entered a four-year bear market that trimmed nearly -50% off its value. In December 2015 the final price low was hit and gold subsequently rallied over +20%, making a new high in March of this year. Since then, it began a period of correction/consolidation,...
READ MORE
MEMBERS ONLY
S&P 500 2015 Q4 Earnings Results: Market Even More Overbought
by Carl Swenlin,
President and Founder, DecisionPoint.com
The preliminary S&P 500 Index 2015 fourth quarter earnings results are in, and it is once again time to look at our earnings chart, which shows the S&P 500 in relation to its normal value range. (Note: The chart is a static graphic, not an active...
READ MORE
MEMBERS ONLY
Market: Overbought and Topping
by Carl Swenlin,
President and Founder, DecisionPoint.com
On Thursday SPY broke below a short-term rising trend line. This might not have been too big a deal, but there is other evidence that something more negative is developing. For one thing, we can see on the chart that the PMO has topped at an overbought levelsimilar to the...
READ MORE
MEMBERS ONLY
House of Cards and the 50-50-90 Rule
by Carl Swenlin,
President and Founder, DecisionPoint.com
While watching the fourth season of House of Cards I have been reminded of the 50-50-90 rule: Anytime you have a 50-50 chance of getting something right, there's a 90% probability you'll get it wrong. House of Cards is a Netflix series depicting political intrigue and...
READ MORE
MEMBERS ONLY
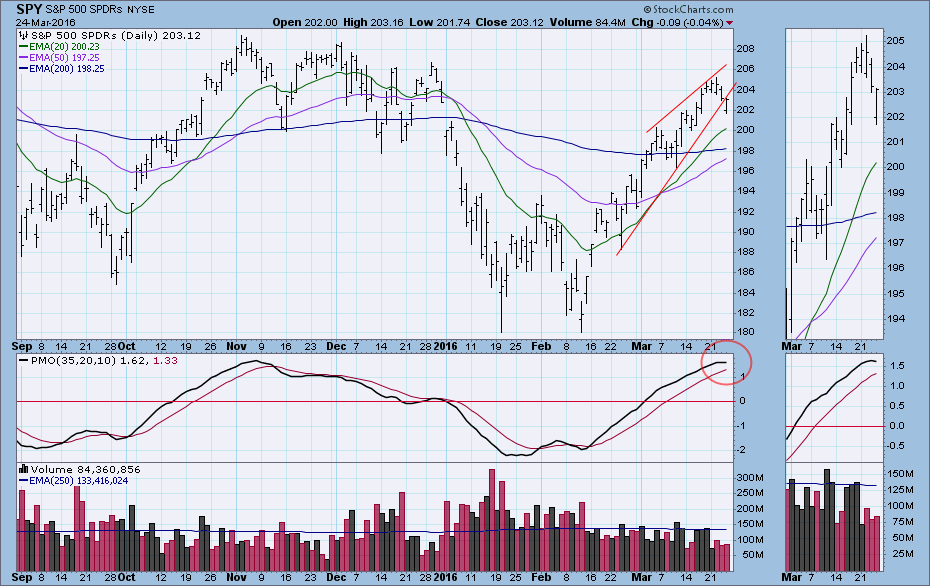
SPY: Rising Wedge Delivers but Dissapoints
by Carl Swenlin,
President and Founder, DecisionPoint.com
One of my favorite chart patterns is the wedge -- rising or falling -- because it can usually be depended upon to resolve opposite the direction the wedge is moving. Specifically, a rising wedge will usually resolve downward and vice versa. Recently I saw some wedges developing on the SPY...
READ MORE
MEMBERS ONLY
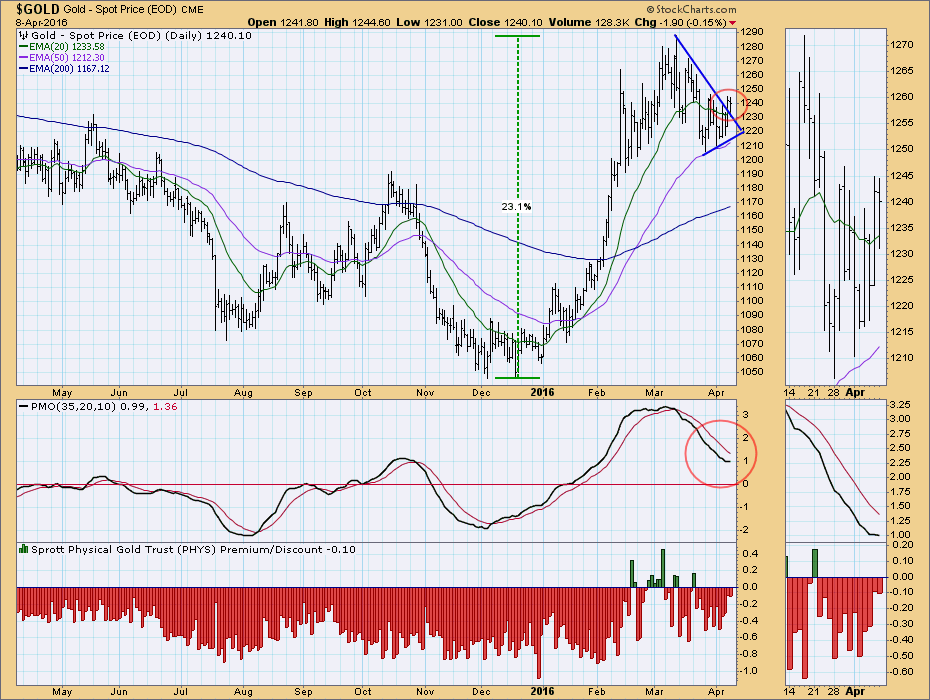
GOLD: Correction Coming?
by Carl Swenlin,
President and Founder, DecisionPoint.com
Last week I expressed my reluctance about writing an article about gold two weeks in a row; yet, here I am with article number three. I couldn't help it because I'm seeing a chart pattern that makes me think that gold will be experiencing a correction...
READ MORE
MEMBERS ONLY
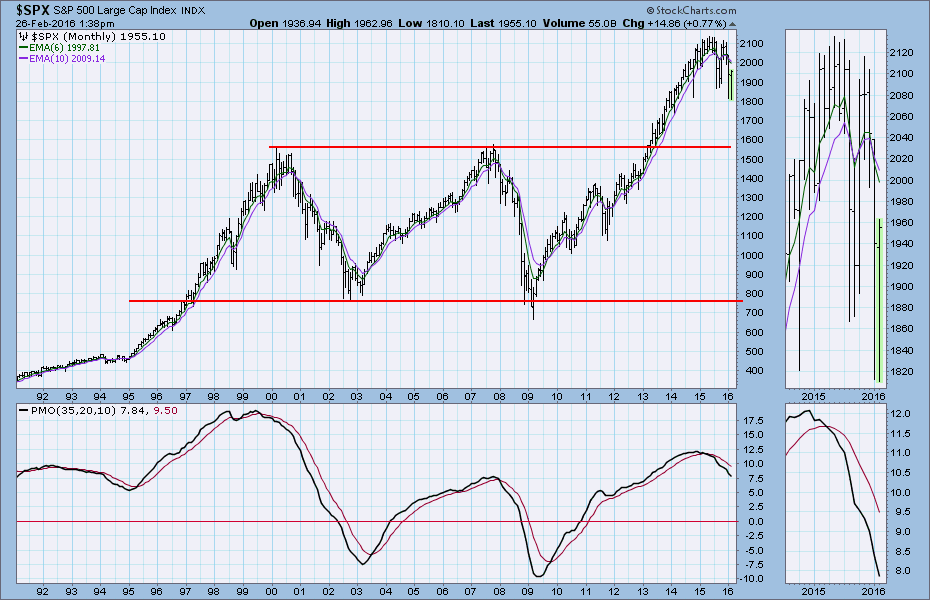
STOCKS: Looking Long-Term
by Carl Swenlin,
President and Founder, DecisionPoint.com
The day to day stock market jitterbug can undermine out conclusions and resolve in the short term, so it is always good to pull back and evaluate longer-term charts for a look at the big picture. At DecisionPoint our primary indicator for objectively defining a bull or bear market is...
READ MORE
MEMBERS ONLY
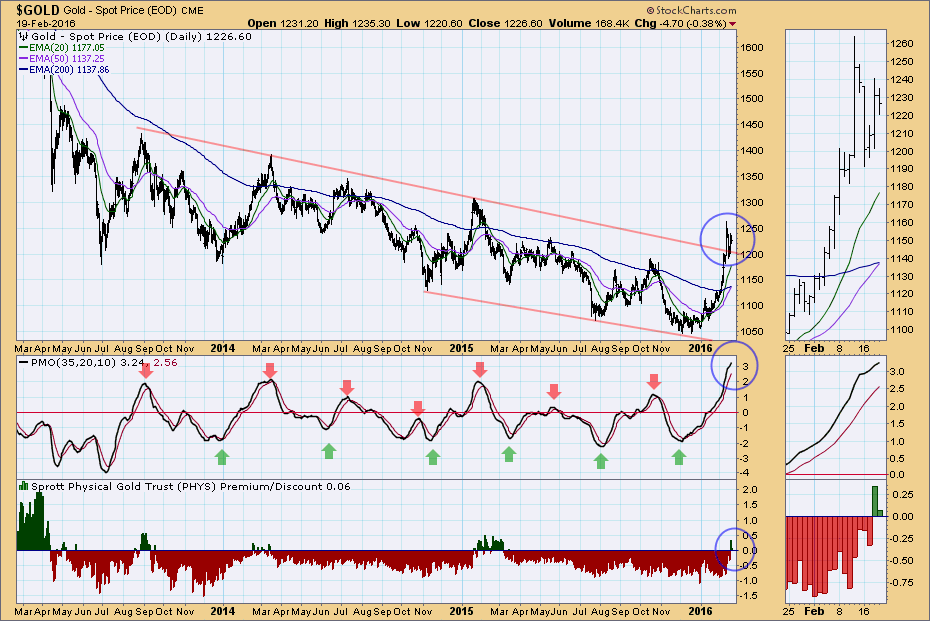
GOLD: So Far, So Good
by Carl Swenlin,
President and Founder, DecisionPoint.com
I don't want to become a Johnny One-Note by reporting on gold two weeks in a row, but gold continues to attract my attention. Last week $GOLD capped off a strong rally when it broke decisively above a long-term declining tops line. Since it was very overbought, we...
READ MORE