MEMBERS ONLY
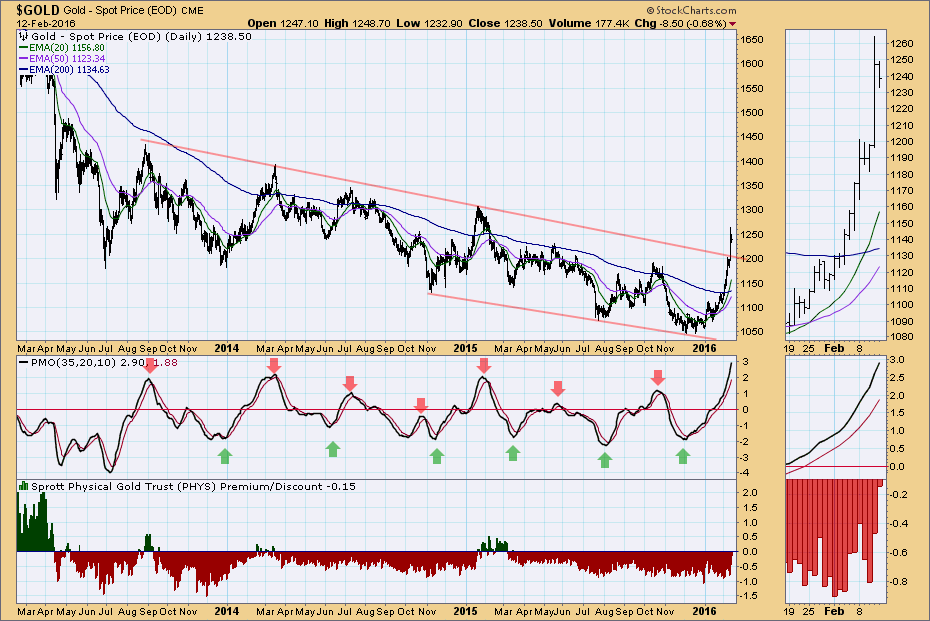
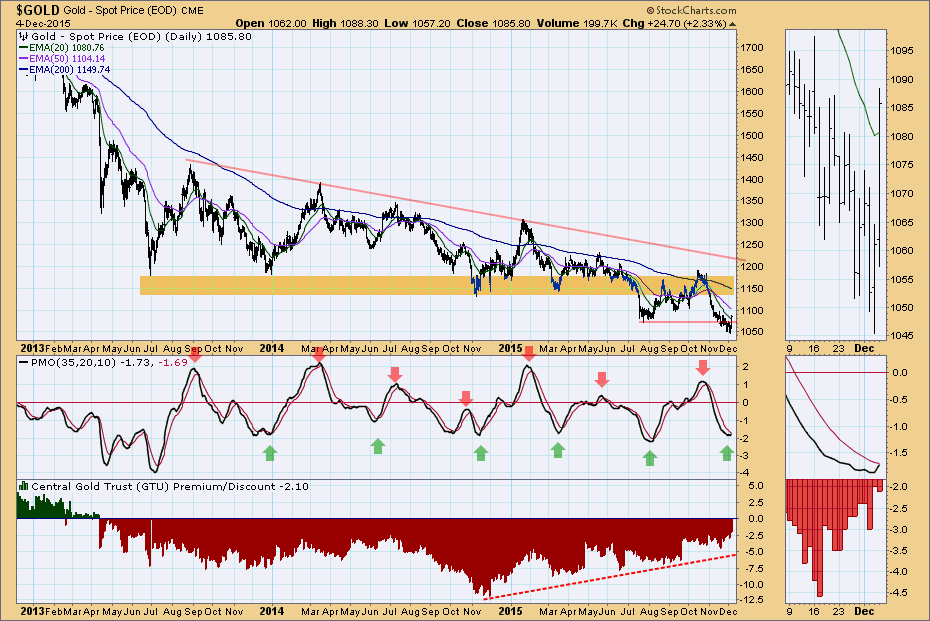
GOLD: Time for Pullback/Consolidation?
by Carl Swenlin,
President and Founder, DecisionPoint.com
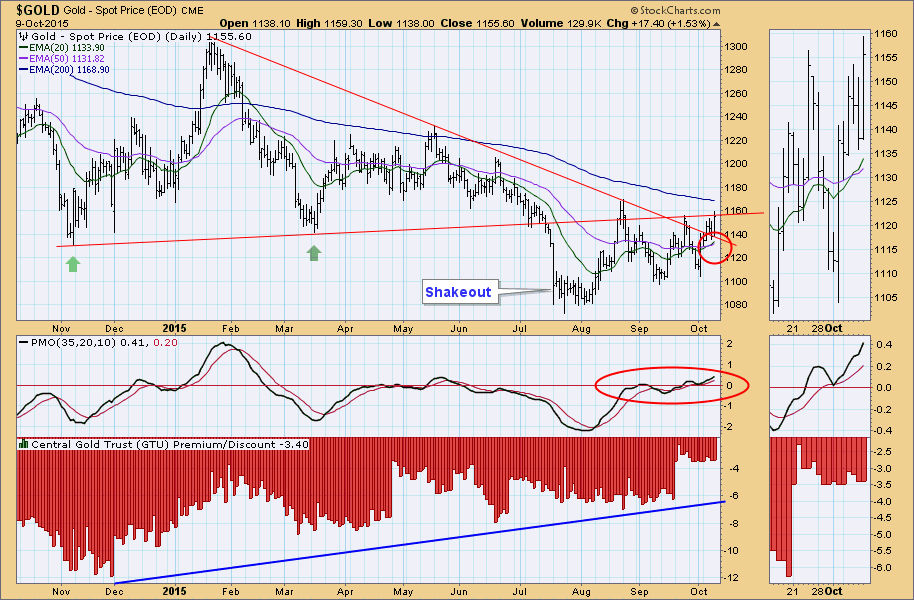
Since the December lows, $GOLD has moved up +20%, and the advance this month has been nearly vertical (as in parabolic). At this point there are some signs that price needs to consolidate or pull back.
Looking at the last three year's price pattern, we can see it...
READ MORE
MEMBERS ONLY
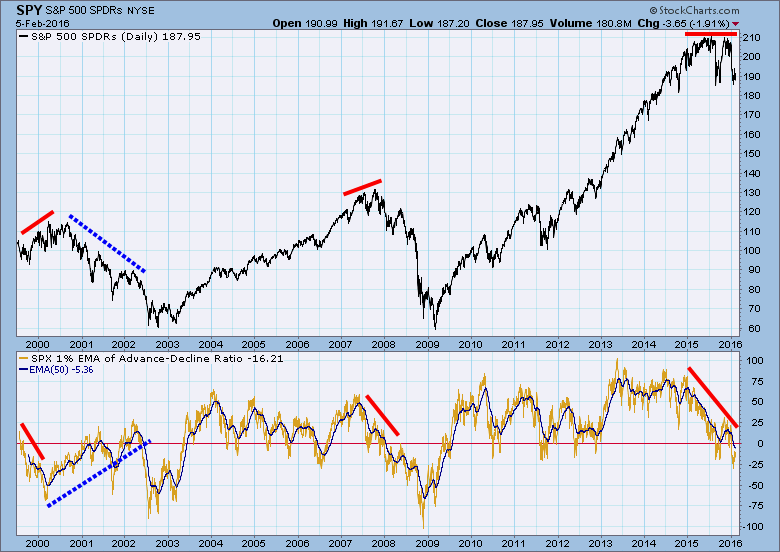
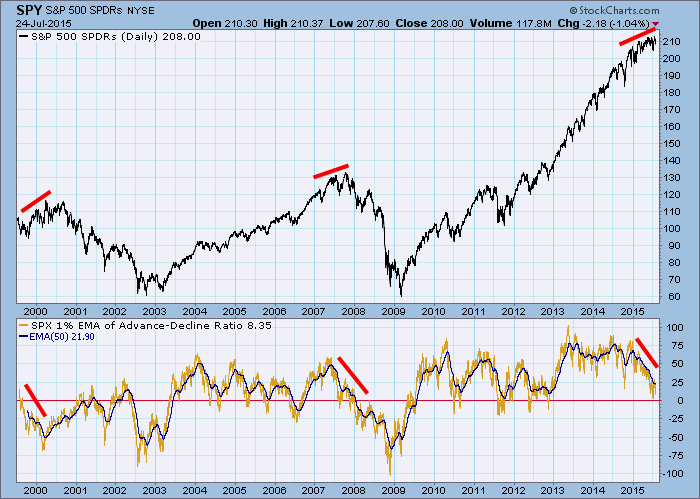
Breadth Anomalies
by Carl Swenlin,
President and Founder, DecisionPoint.com
Some time ago I wrote an article featuring the 1% EMA (200EMA) of the S&P 500 Advance-Decline Ratio. My purpose was to point out the negative divergences (red lines) that occurred at major market tops in 2000 and 2007, as well as to show the current developing negative...
READ MORE
MEMBERS ONLY
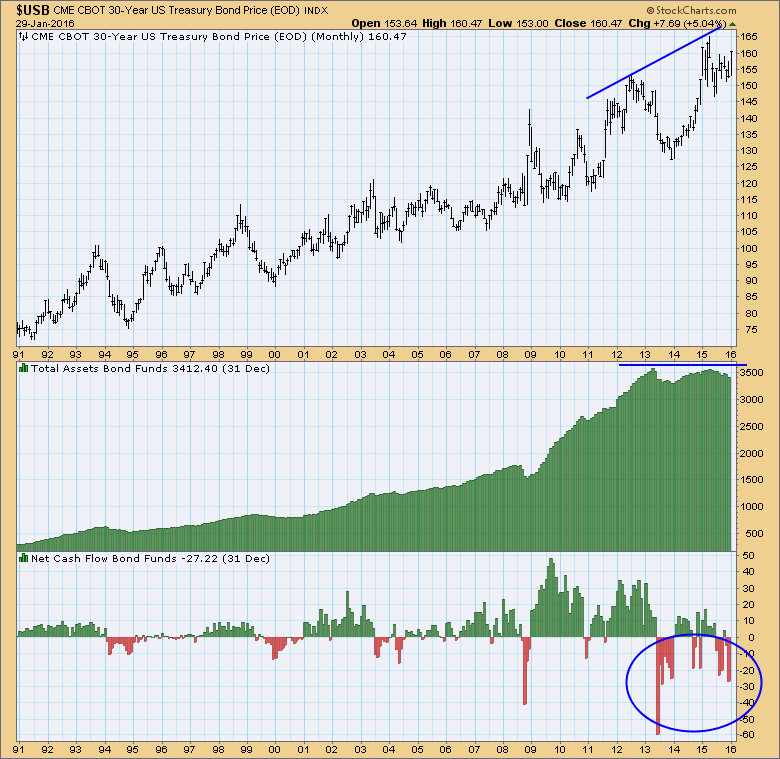
Interesting Mutual Fund Stats
by Carl Swenlin,
President and Founder, DecisionPoint.com
Really? Something interesting about mutual funds? Well, I had to put some kind of hook in the title, because the subject matter doesn't normally induce a rapid pulse rate, but there are some interesting things to be known. For example, total assets in bond funds is showing a...
READ MORE
MEMBERS ONLY
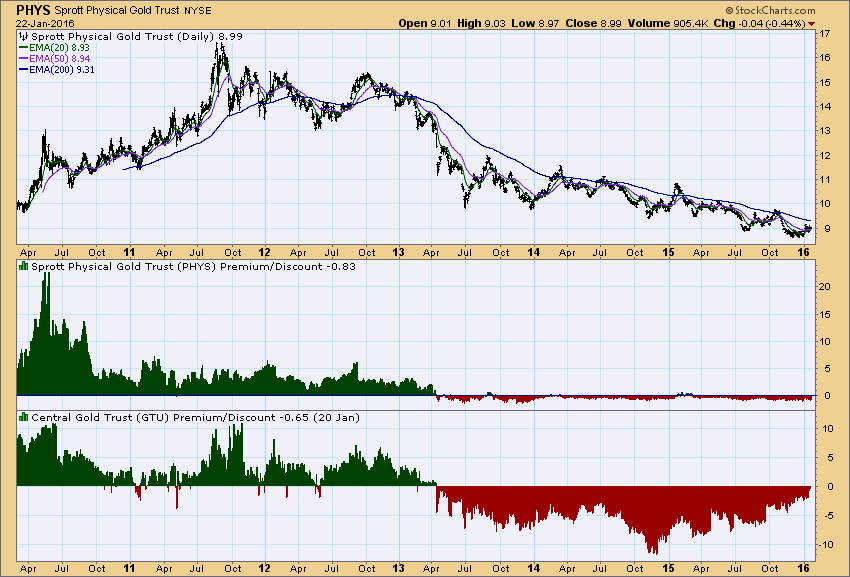
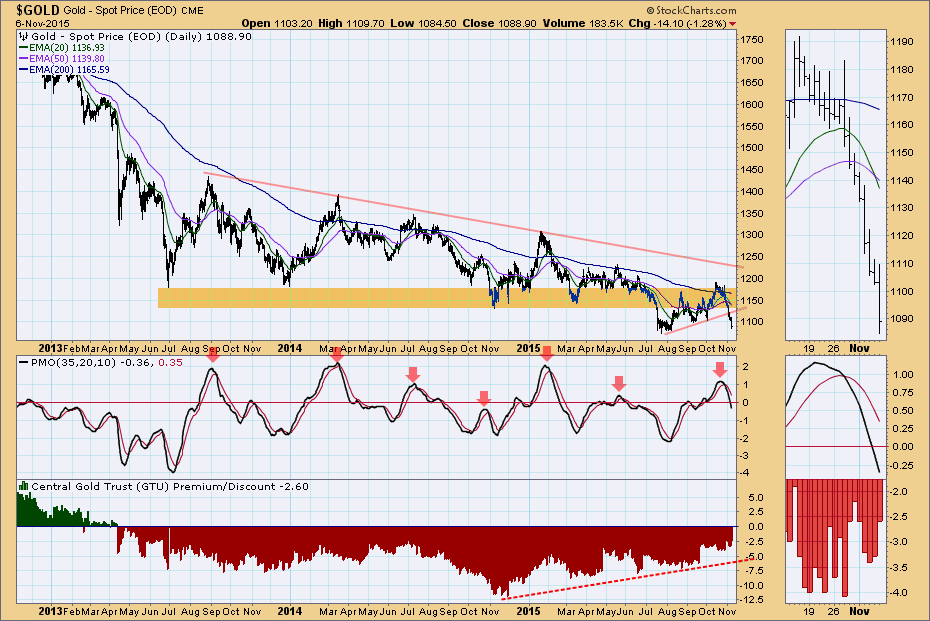
Gold: Sentiment Indicator Lost; Current Outlook
by Carl Swenlin,
President and Founder, DecisionPoint.com
One of the best sentiment indicators we had for gold was the premium/discount for Central Gold Trust (GTU), a closed-end fund which owned only gold bullion. (Closed-end funds trade like stocks, and the pressures of bid/ask can cause them to trade at a premium or discount to net...
READ MORE
MEMBERS ONLY
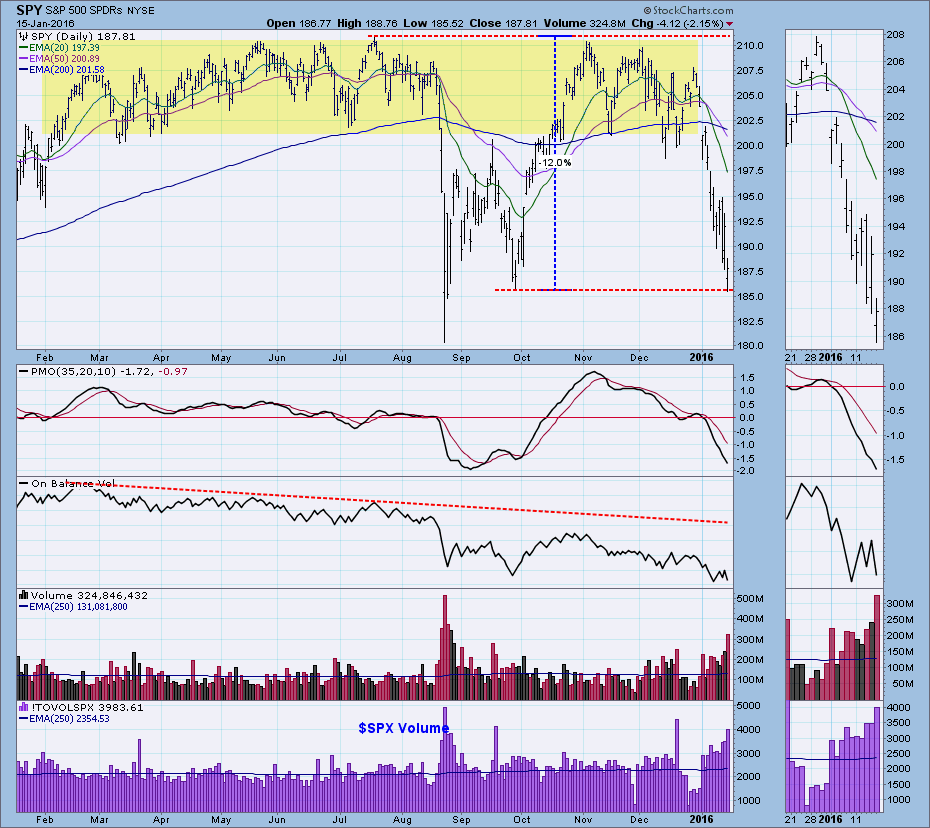
Is the Market Oversold Enough Yet?
by Carl Swenlin,
President and Founder, DecisionPoint.com
It was an unbelievably choppy week, with Friday delivering a stunning reversal from the strong advance of the previous day. Intraday SPY was down -12% from its all-time high last July, and with Friday's intraday low, SPY may have found support at the September low. The market is...
READ MORE
MEMBERS ONLY
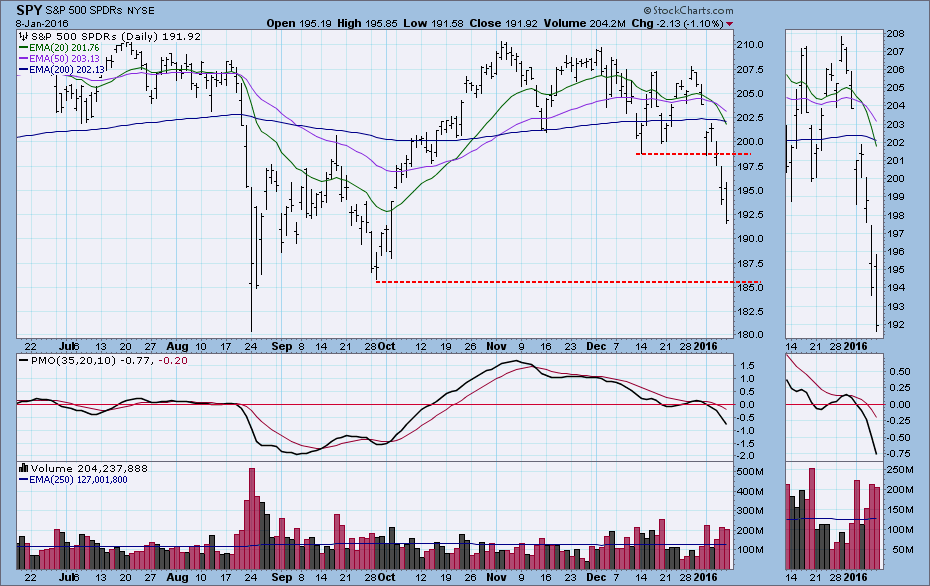
Are We There Yet?
by Carl Swenlin,
President and Founder, DecisionPoint.com
After a particularly brutal week, a lot of people are wondering if the correction is about over. The first place I look is the daily chart to see if there are any obvious support levels coming into play. We can see where price fell through support this week, and the...
READ MORE
MEMBERS ONLY
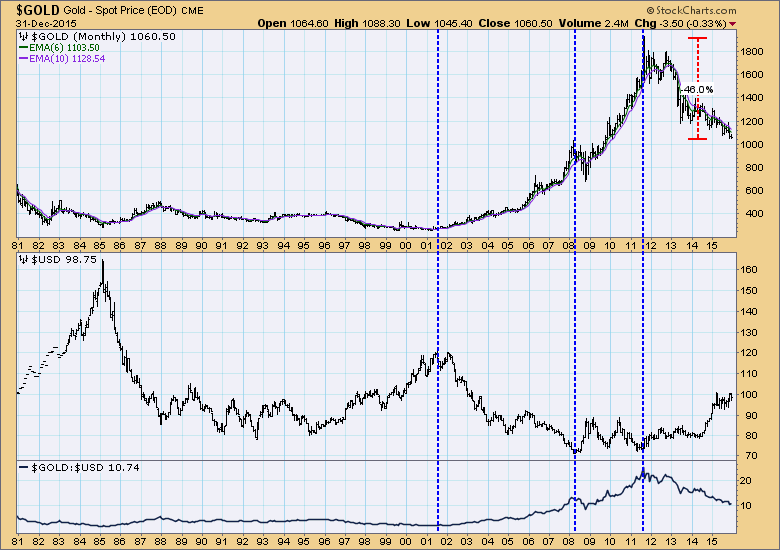
Gold Versus the Dollar Long Term
by Carl Swenlin,
President and Founder, DecisionPoint.com
There is an inverse relationship between gold and the dollar, but it is far from exact. A weak or strong dollar will influence the price of gold in the opposite direction, but gold can also have internal strength or weakness that is a reflection of the fluctuating demand for gold....
READ MORE
MEMBERS ONLY
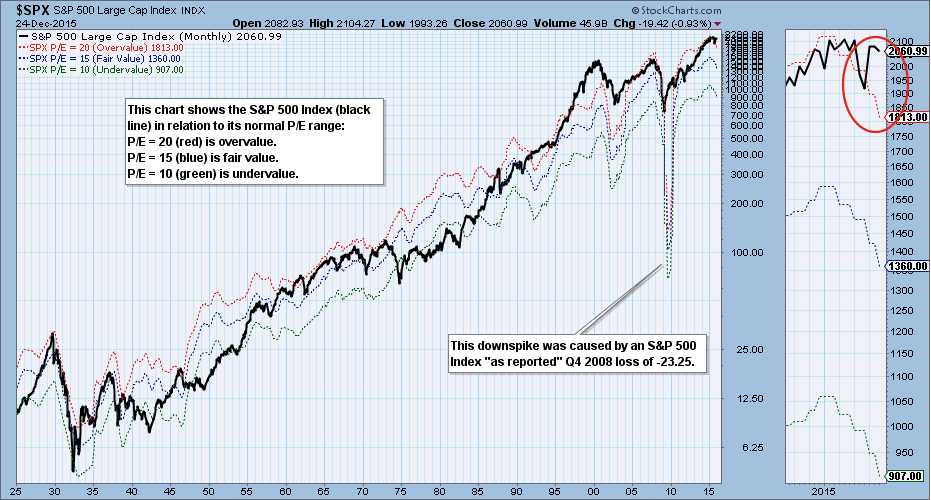
S&P 500 Q3 Earnings Results: Market Overvalued
by Carl Swenlin,
President and Founder, DecisionPoint.com
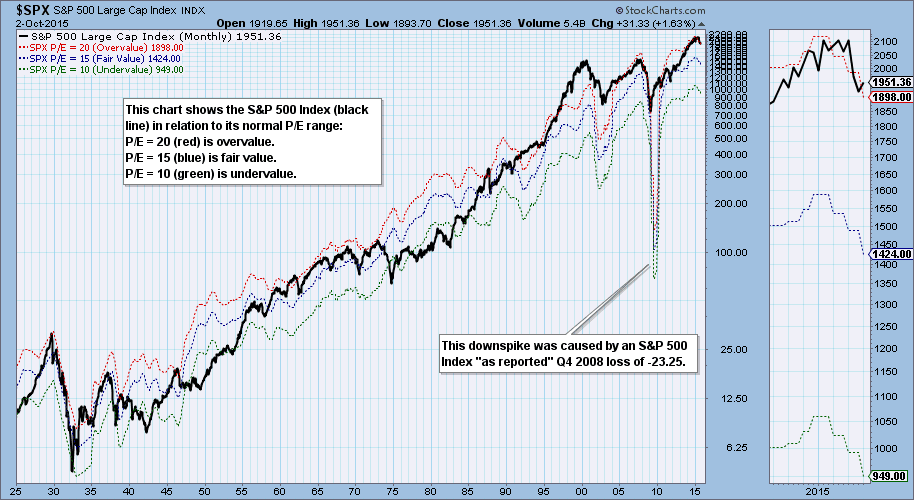
The preliminary S&P 500 Index third quarter earnings results are in, and once again we get to look at one of my favorite charts, which shows the S&P 500 in relation to its normal value range. (Note: The chart is a static graphic, not an active...
READ MORE
MEMBERS ONLY
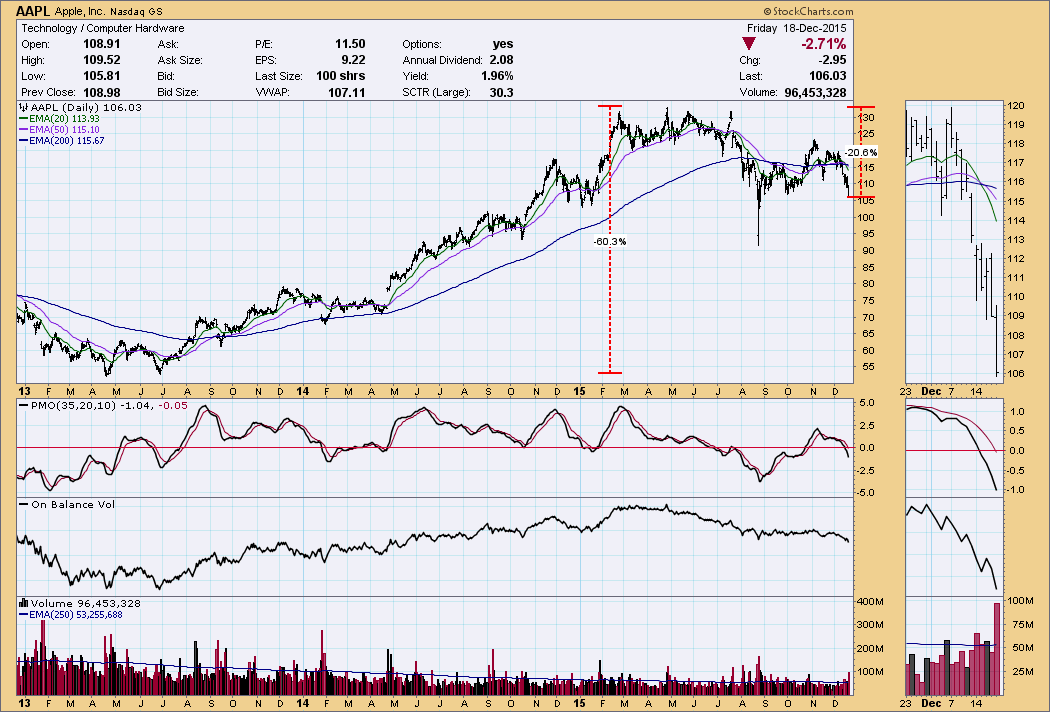
Time to Own Apple?
by Carl Swenlin,
President and Founder, DecisionPoint.com
With Apple (AAPL) down about -20% from this the all-time high, I am hearing with some frequency on the cable financial shows the question of whether it is time to buy or hold AAPL. As of Friday's close my answer is a resounding no.
Technically speaking, the 20EMA...
READ MORE
MEMBERS ONLY
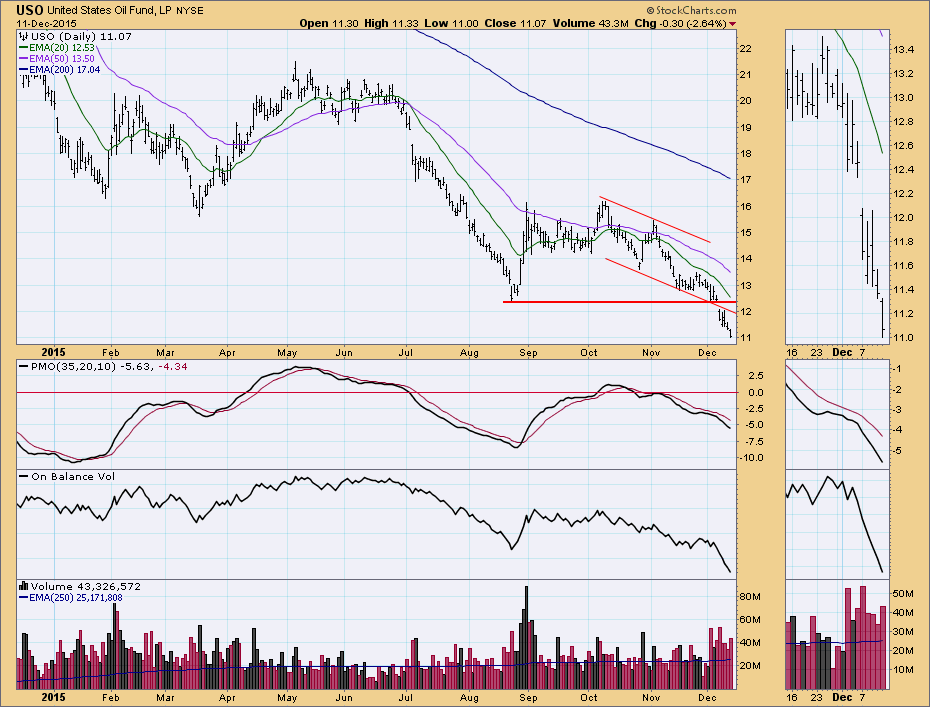
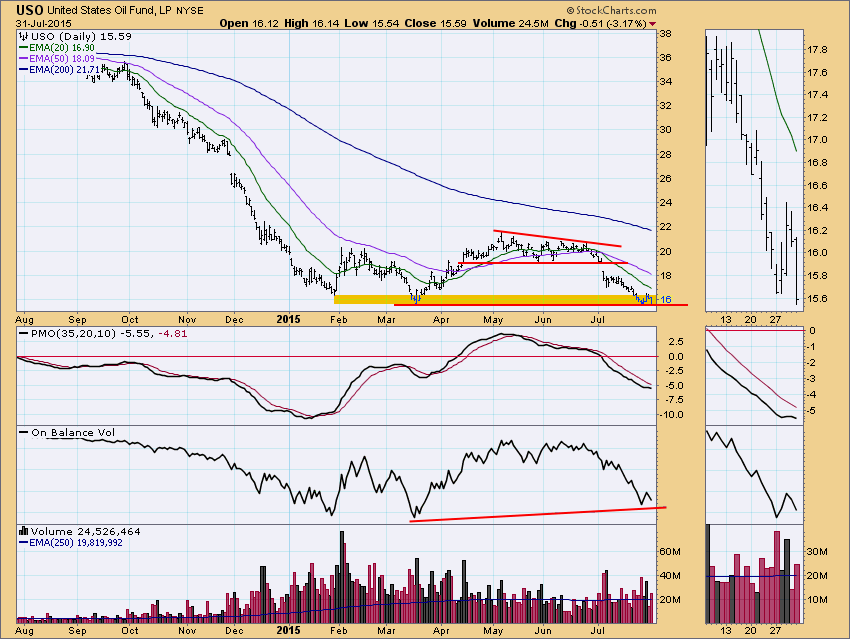
Differing Opinions About Oil
by Carl Swenlin,
President and Founder, DecisionPoint.com
On Friday I saw two opposing headlines regarding oil on one financial website: (1) No worries, oil isn't going any lower, and (2) Oil may go to $20. Before we clutch our head in both hands and cry, "It's so confusing!", let's...
READ MORE
MEMBERS ONLY
Gold Starting New Rally
by Carl Swenlin,
President and Founder, DecisionPoint.com
On Friday $GOLD made a strong up move, seemingly ending a decline that has lasted almost two months. Price broke back above a line of resistance drawn from the July low, a line that will now serve as support.
The PMO has been helpful in identifying price tops and bottoms...
READ MORE
MEMBERS ONLY
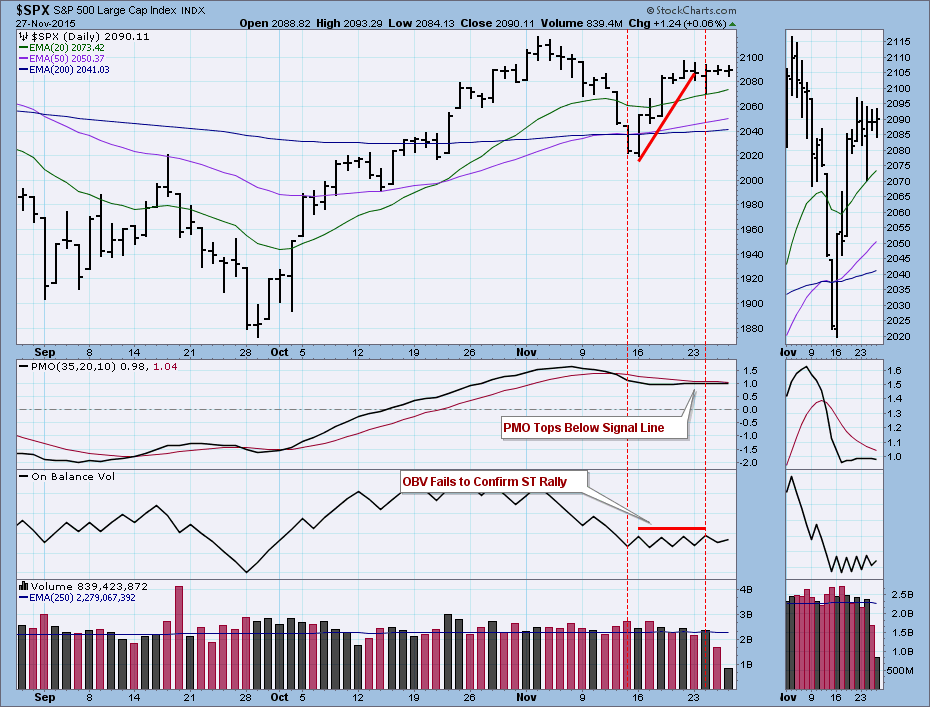
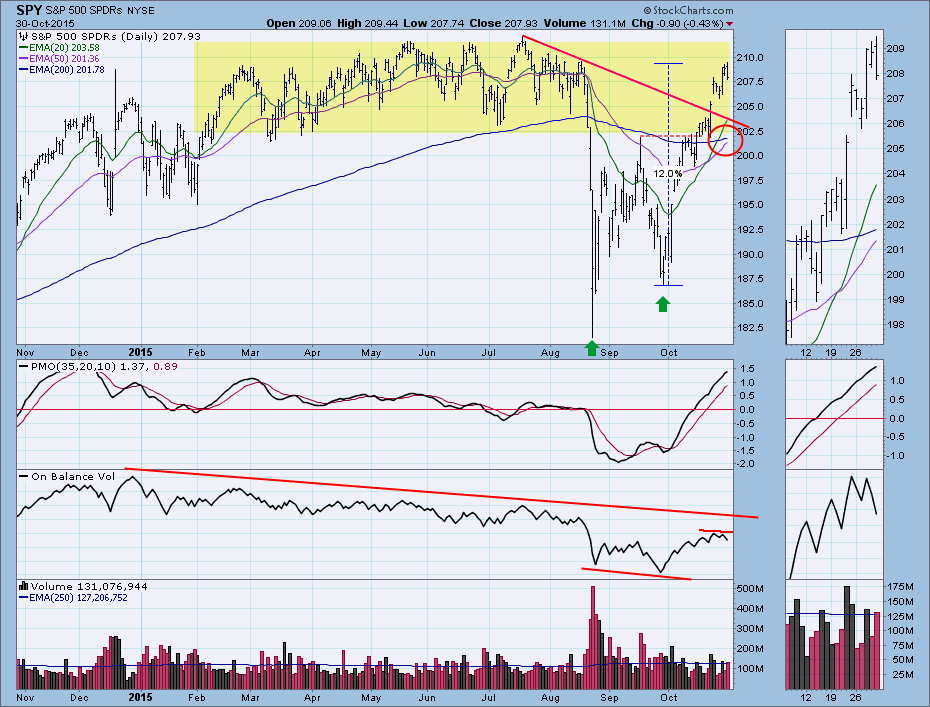
$SPX: Volume and Momentum Issues
by Carl Swenlin,
President and Founder, DecisionPoint.com
When performing index analysis, I normally prefer to use the SPDR because that is the trading vehicle, as well as a "total return" view of the index. In this case we are looking at on-balance volume (OBV), and I wanted to be sure we were considering all the...
READ MORE
MEMBERS ONLY
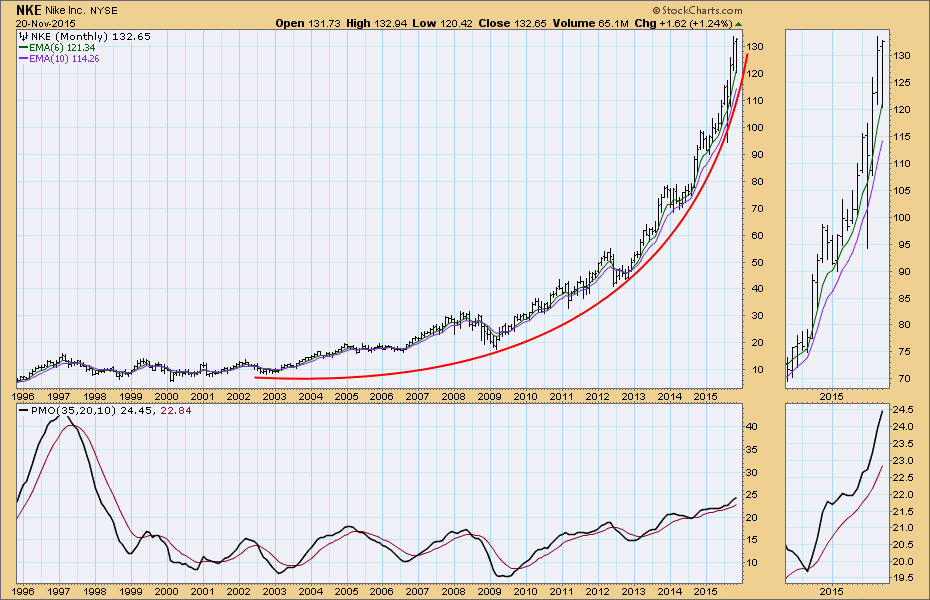
Some Problems with Nike
by Carl Swenlin,
President and Founder, DecisionPoint.com
After a short correction last week, Nike (NKE) reversed course this week and charged upward, nearly reaching new, all-time highs. With such positive price action, what could be wrong? For one thing, on the monthly chart we can see that NKE is in a parabolic up move, and price is...
READ MORE
MEMBERS ONLY
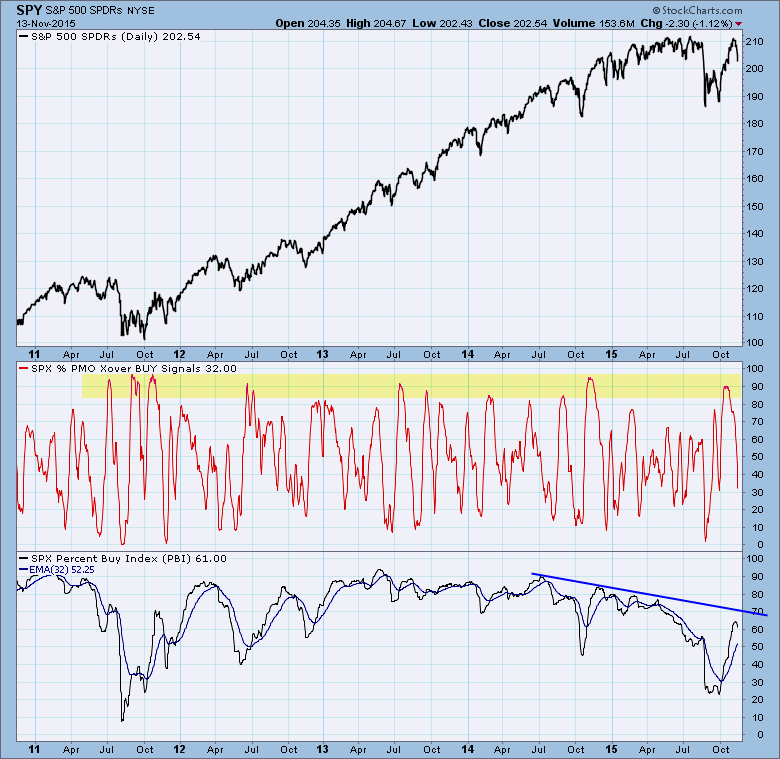
Mechanical Signal Analysis
by Carl Swenlin,
President and Founder, DecisionPoint.com
At DecisionPoint we track the status of short-term and long-term mechanical signals so that we can get an idea of the level of participation in each of those time frames. The chart below shows the shorter-term Percentage of PMO Crossover BUY Signals as well as the longer-term Percent Buy Index...
READ MORE
MEMBERS ONLY
$GOLD Back to SELL Signal
by Carl Swenlin,
President and Founder, DecisionPoint.com
About a month ago $GOLD went on an IT Trend Model BUY signal, and I had this to say about it: The overall picture for $GOLD is bearish but showing improvement. The current BUY signal may offer some opportunities on the long side, and may even prove to be a...
READ MORE
MEMBERS ONLY
Market on the Verge of Something
by Carl Swenlin,
President and Founder, DecisionPoint.com
Market on the verge of what? That is the question. The 50EMA is very close to crossing up through the 200EMA, which would change the long-term status from bearish to bullish. And SPY is only about 2.5% away from making new highs. What could go wrong?
Some other things...
READ MORE
MEMBERS ONLY
Strong Price, Fading Internals
by Carl Swenlin,
President and Founder, DecisionPoint.com
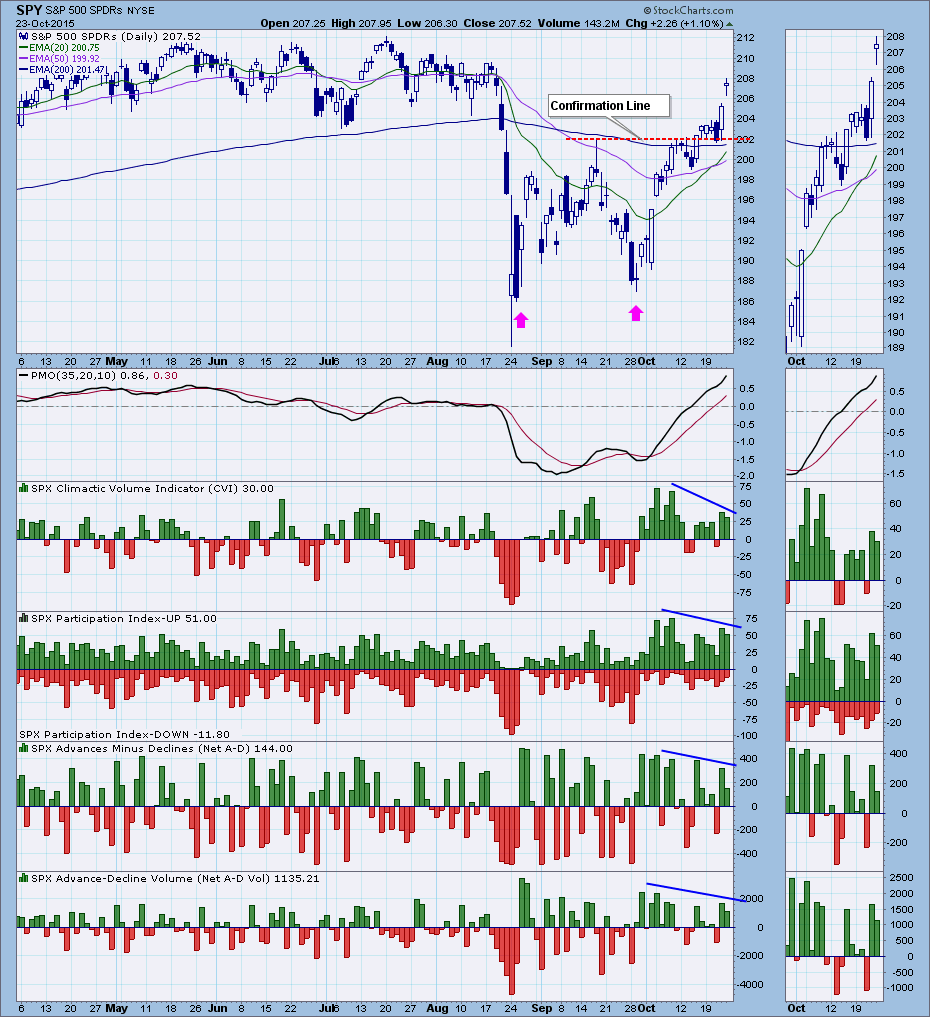
After the strong upside price action we've had in the last two days, I was expecting to see strong internal readings as well. But no. While price is within about two percent of record highs, internal readings are fading.
On the chart above the green bars, which represent...
READ MORE
MEMBERS ONLY
Bear Market, Bullish Behavior
by Carl Swenlin,
President and Founder, DecisionPoint.com
Based upon the fact that the 50EMA is below the 200EMA, I consider that we are in a bear market, and that we should expect negative outcomes more often than positive ones; however, we should remember that positive outcomes are also possible some of the time. Case in point, the...
READ MORE
MEMBERS ONLY
Gold: New BUY Signal
by Carl Swenlin,
President and Founder, DecisionPoint.com
On Wednesday of last week $GOLD generated a DecisionPoint Trend Model BUY signal when the 20EMA crossed up through the 50EMA. As we frequently stress, these signals are intended to be information flags, not action flags. They should prompt investigation, not blind response.
Looking at the one-year chart above we...
READ MORE
MEMBERS ONLY
S&P 500 Earnings Trending Downward
by Carl Swenlin,
President and Founder, DecisionPoint.com
This is one of my favorite charts, although I look at it infrequently because it's a little like watching grass grow. Instead just showing a graph of earnings, it puts earnings in a different context by presenting a set of bands that show where the S&P...
READ MORE
MEMBERS ONLY
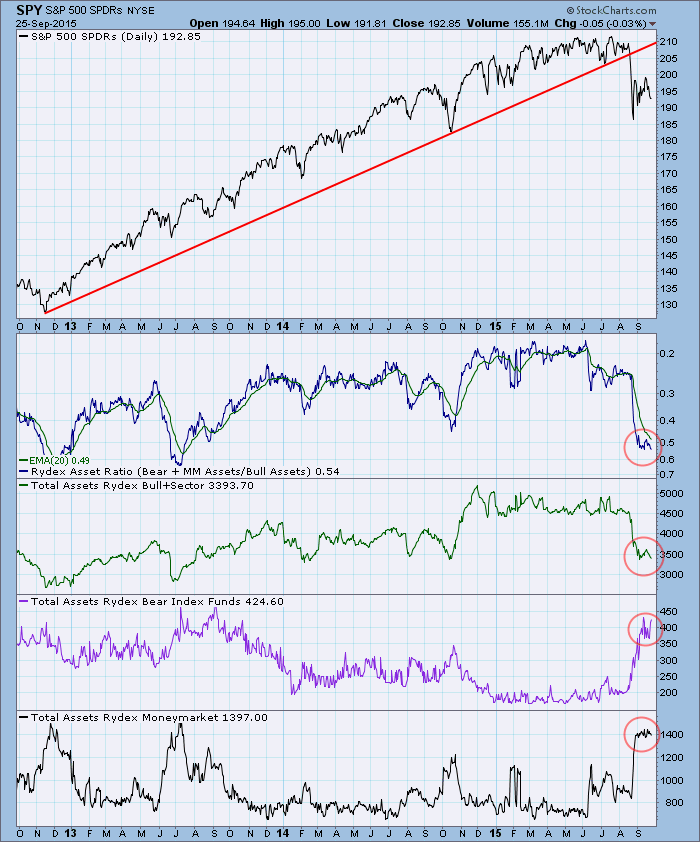
Rydex Asset Ratio Relatively Oversold . . . At First Glance
by Carl Swenlin,
President and Founder, DecisionPoint.com
The Rydex Asset Ratio is a solid sentiment indicator because it is based upon an analysis of where people are actually putting their money, not just how they are feeling about the market. It is calculated by dividing *Rydex Bear Fund plus Money Market Assets by *Rydex Bull Fund Assets....
READ MORE
MEMBERS ONLY
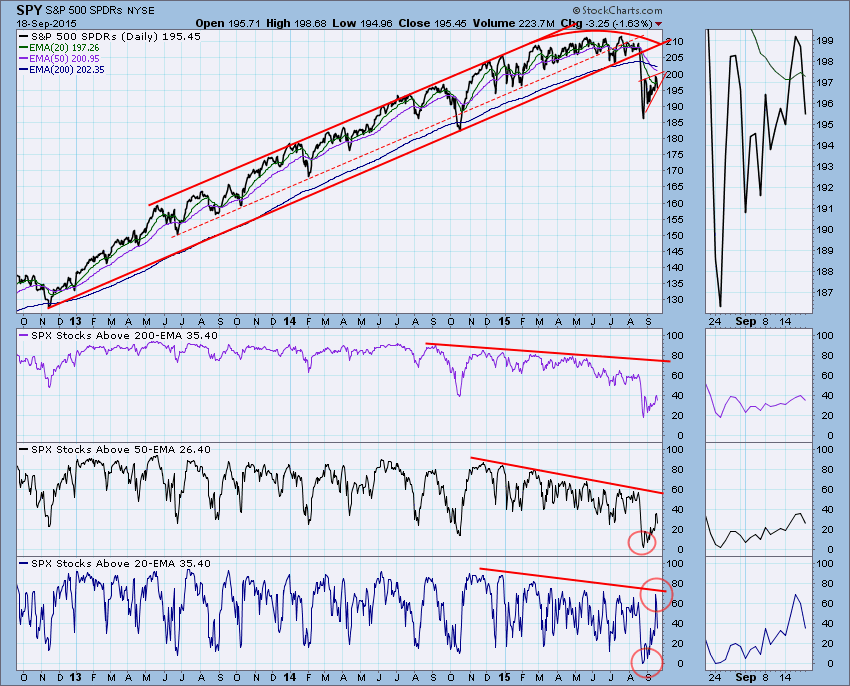
Percentage of Stocks Above Moving Averages Hints at Market Top
by Carl Swenlin,
President and Founder, DecisionPoint.com
We track the percentage of stocks above their 20EMA, 50EMA, and 200EMA because this helps us determine market condition in the short, medium, and long time frames. While this indicator is available for numerous market and sector indexes, we usually concentrate on the stocks S&P 500 Index for...
READ MORE
MEMBERS ONLY
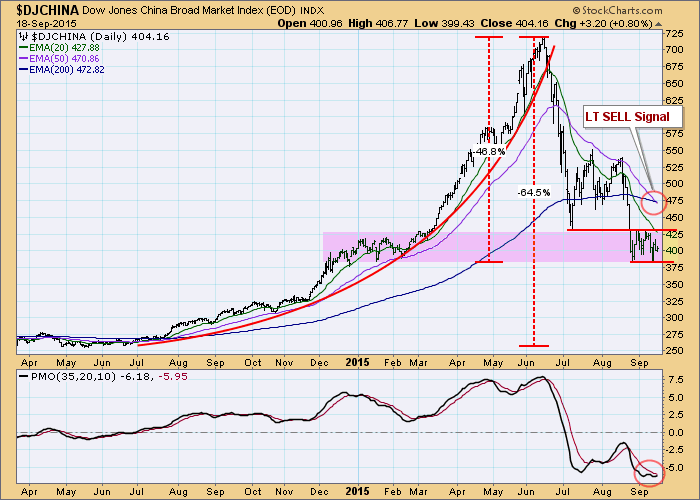
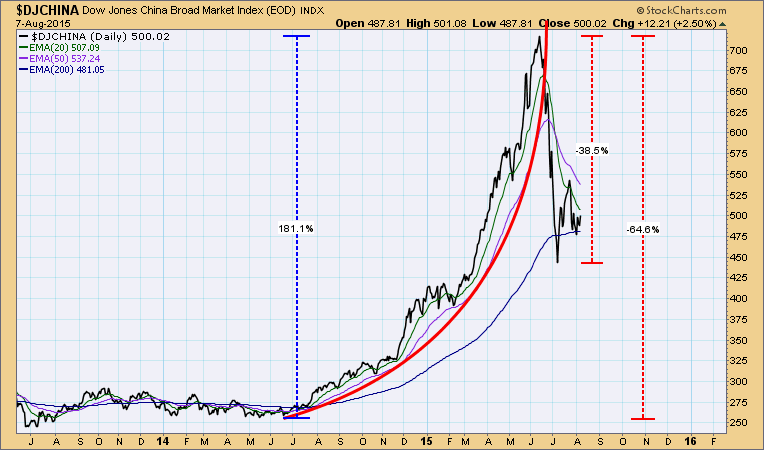
China Long-Term SELL Signal--Kinda Late
by Carl Swenlin,
President and Founder, DecisionPoint.com
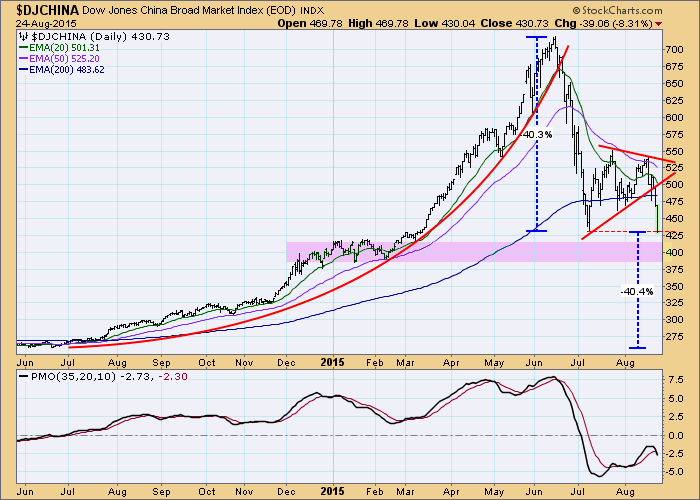
This week the DecisionPoint Long-Term Trend Model generated a long-term SELL signal for $DJCHINA, but it was a tad late, considering how far that index has fallen. This chart provides us with a good example of when mechanical signals need to be ignored.
In this particular case, $DJCHINA experienced a...
READ MORE
MEMBERS ONLY
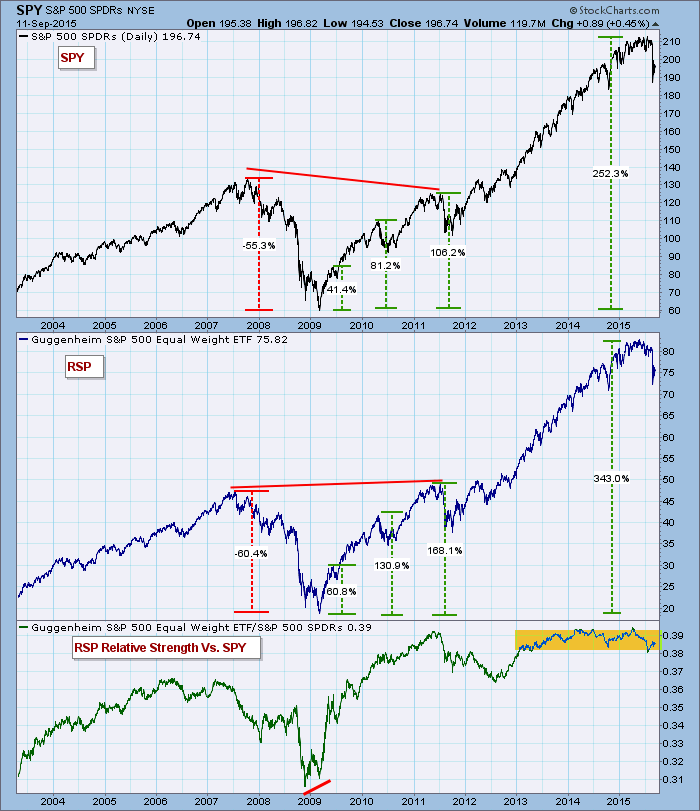
Relative Strength Anomaly
by Carl Swenlin,
President and Founder, DecisionPoint.com
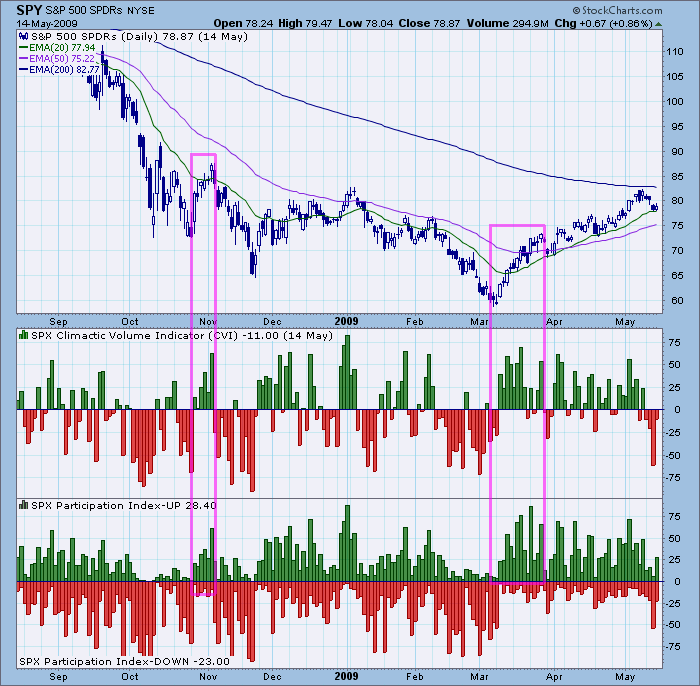
Last week I highlighted CVI and Participation Index readings I had never seen before. This week I want to point out some useful relative strength behavior I just noticed for the first time. My focus is on the S&P 500 SPDR (SPY) and the S&P 500...
READ MORE
MEMBERS ONLY
Big Rally, Anti-Climax
by Carl Swenlin,
President and Founder, DecisionPoint.com
In the last two weeks I observed something I don't recall ever seeing before. Two market indicators, that I never fail to review at the end of every trading day, are the Climactic Volume Indicator (CVI) and the UP and DOWN Participation Indexes (PI). The CVI is based...
READ MORE
MEMBERS ONLY
Taking the Technical Temperature
by Carl Swenlin,
President and Founder, DecisionPoint.com
In the last two weeks the stock market put on quite a show. Many months of sideways boredom was finally ended with a dramatic breakdown and a scary drop of -14.4% (intraday for SPY) from the all-time high in July. From that low, SPY then rebounded nearly +10%. On...
READ MORE
MEMBERS ONLY
China Did It!
by Carl Swenlin,
President and Founder, DecisionPoint.com
In early August I wrote an article about China's stock market crash, wherein I stated, "It is incomprehensible to me that such action in China will have no effect elsewhere in the global financial markets." Actually, it has been having effect on global markets, and last...
READ MORE
MEMBERS ONLY
Gold Seeing Enthusiastic Rally
by Carl Swenlin,
President and Founder, DecisionPoint.com
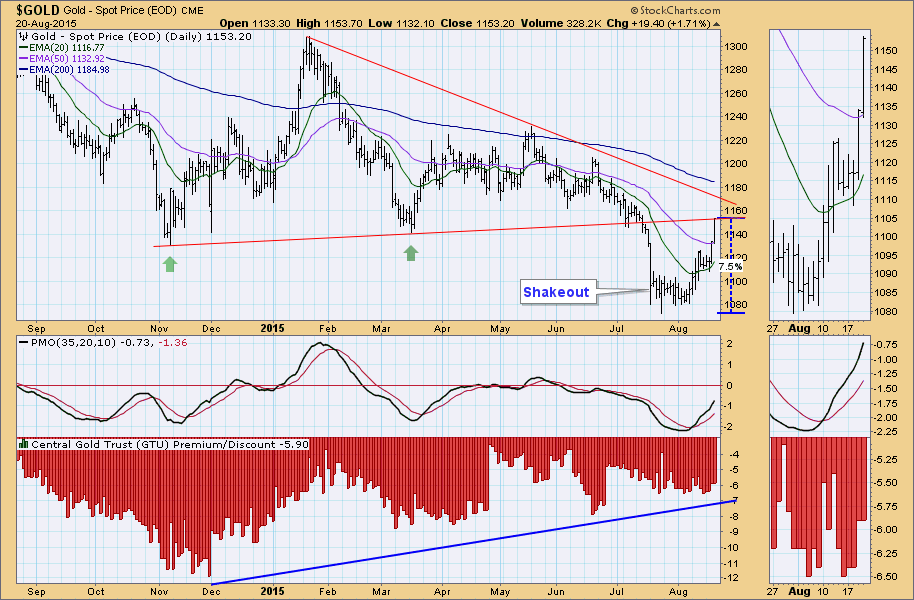
After months of sagging prices, gold ($GOLD) is finally coming back to life. From the July low it has rallied +7.5%. After a promising November/March double bottom, the subsequent rally failed, support was broken, and new lows were made in July. In view of the current rally, that...
READ MORE
MEMBERS ONLY
Big Commodities Rally Coming?
by Carl Swenlin,
President and Founder, DecisionPoint.com
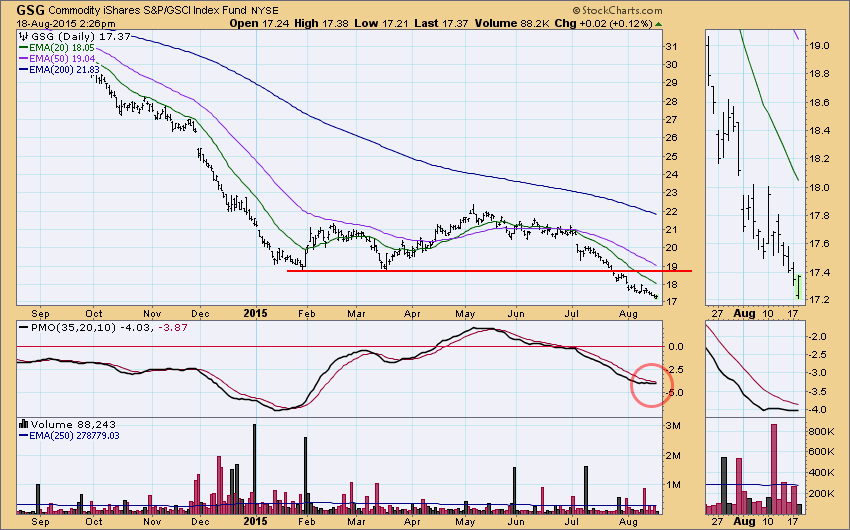
I have seen a couple of comments around the Internet speculating that a big commodities rally is coming. Let's look at a few charts to see if there is anything to back that up. We'll use the Commodities iShares (GSG) as a surrogate for commodities. On...
READ MORE
MEMBERS ONLY
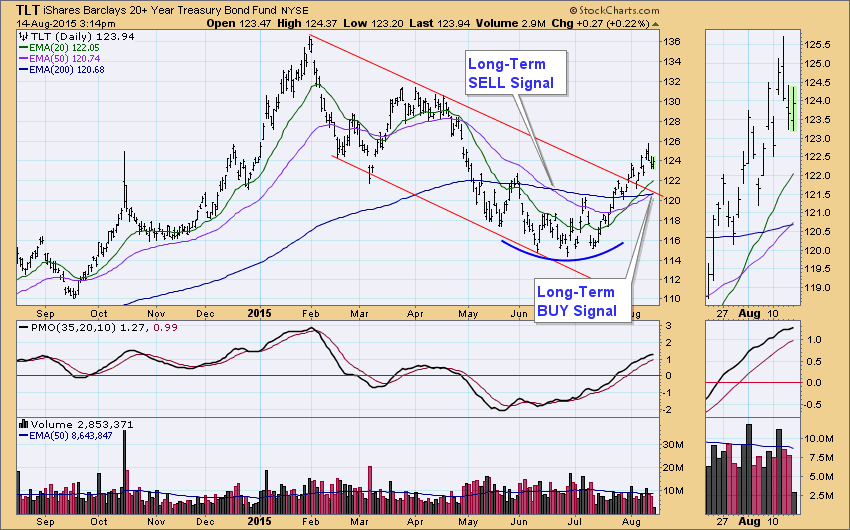
BONDS: Two Months is Long Term??
by Carl Swenlin,
President and Founder, DecisionPoint.com
At the end of June I published an article showing where bonds (TLT) had generated a Trend Model long-term SELL signal when the 50EMA crossed down through the 200EMA; however, as of Friday's close the 50EMA crossed back up through the 200EMA, generating a long-term BUY signal. Two...
READ MORE
MEMBERS ONLY
China Crash Probably Not Over
by Carl Swenlin,
President and Founder, DecisionPoint.com
The Chinese stock market made news recently, dropping nearly -40% from its June top to a low in early July. With that market having bounced off the crash low, many are saying that the decline is over, but I think that assessment is premature. First of all, the advance prior...
READ MORE
MEMBERS ONLY
Crude Testing Important Support
by Carl Swenlin,
President and Founder, DecisionPoint.com
The price of crude oil is certainly getting a lot of headlines, but, as usual, we need to look at some charts to get the true picture. Our surrogate for crude is the U.S. Oil Fund ETF (USO), which reflects the price of oil less the costs of actually...
READ MORE
MEMBERS ONLY
Longer-Term Indicators Continue to Show Internal Erosion
by Carl Swenlin,
President and Founder, DecisionPoint.com
The price index on the chart below has continued to edge higher, but we can see that pattern is becoming congested. The lower panel shows the 1% EMA of the Advance-Decline Ratio* and its 50EMA. The daily data is pretty volatile, so the 50EMA is easier to interpret. Also, when...
READ MORE
MEMBERS ONLY
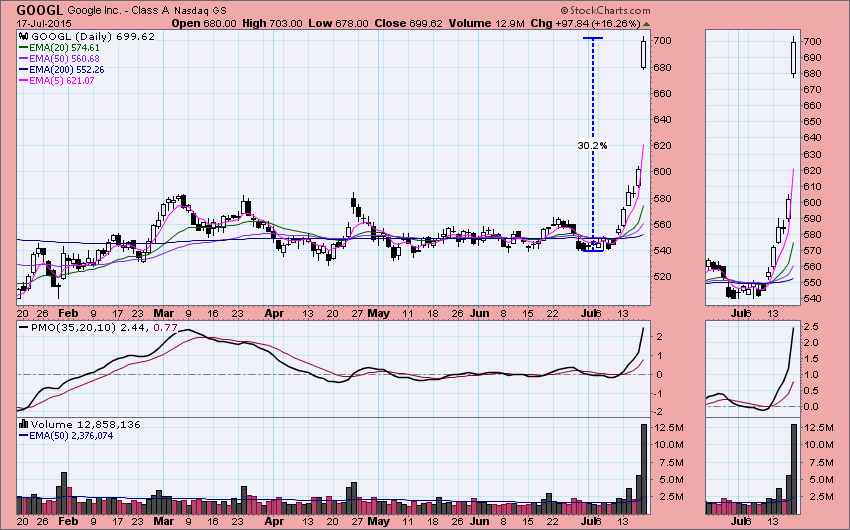
Google Warps Nasdaq 100 and S&P 500 Indexes
by Carl Swenlin,
President and Founder, DecisionPoint.com
Friday was a big day for Google (GOOG and GOOGL) with both the class "A" and class "C" stock up over +16% on earnings news. Actually, so far July has been a big month with GOOGL and GOOG being up about +30% since the July 7...
READ MORE
MEMBERS ONLY
Bulls-Eyes Are Great, but First Get the Arrow onto the Target
by Carl Swenlin,
President and Founder, DecisionPoint.com
If you've ever practiced archery, you know that your ultimate objective is to put the arrow in the bulls-eye, but just putting it on the target still feels pretty good. While we aim at perfection, we'll happily settle for competence. If you are good enough to...
READ MORE
MEMBERS ONLY
PMO Time Frame Relationships?
by Carl Swenlin,
President and Founder, DecisionPoint.com
Webinar Question: Does a reversal in the daily PMO (Price Momentum Oscillator) have any effect on the PMO on weekly and monthly charts?
Carl's Answer: PMOs for the daily, weekly, and monthly time frames, while calculated with the same formula, are essentially different indicators. They are different because...
READ MORE
MEMBERS ONLY
Different Moving Averages for Different Time Frames
by Carl Swenlin,
President and Founder, DecisionPoint.com
QUESTION: In the StockCharts DecisionPoint documentation, it says that the weekly (17EMA and 43EMA) and monthly charts (6EMA and 10EMA) can be used to show long-term trends, but in the webinar, Erin said that they use only the daily chart.
CARL'S ANSWER: While the best way to determine...
READ MORE
MEMBERS ONLY
SPY: Longer-Term Internals Still Looking Bearish
by Carl Swenlin,
President and Founder, DecisionPoint.com
On Thursday the DP Trend Model for SPY changed from BUY (long the market) to NEUTRAL (in cash or fully hedged) when the 20EMA crossed down through the 50EMA. Why doesn't the model change from BUY to SELL (short the market)? Because the 50EMA is still above the...
READ MORE
MEMBERS ONLY
Long-Term SELL Signal for Long Bonds
by Carl Swenlin,
President and Founder, DecisionPoint.com
The most important feature on the chart below is the fact that the 50EMA has crossed down through the 200EMA, generating a Long-Term Trend Model SELL signal for long bonds, and this tells us that bonds are in a bear market. In our analysis we use TLT as the ETF...
READ MORE
MEMBERS ONLY
SPY: Do PMO SELL Signals in All Three Time Frames Spell Doom?
by Carl Swenlin,
President and Founder, DecisionPoint.com
We received the following question following ourDecisionPoint LIVEwebinar:
Currently for the S&P500, all three PMO signals (short-, medium-, and long-term) are in bearish mode. Have there been previous times in the past where the market turned up from here rather than have a sharp correction first? In other...
READ MORE