MEMBERS ONLY
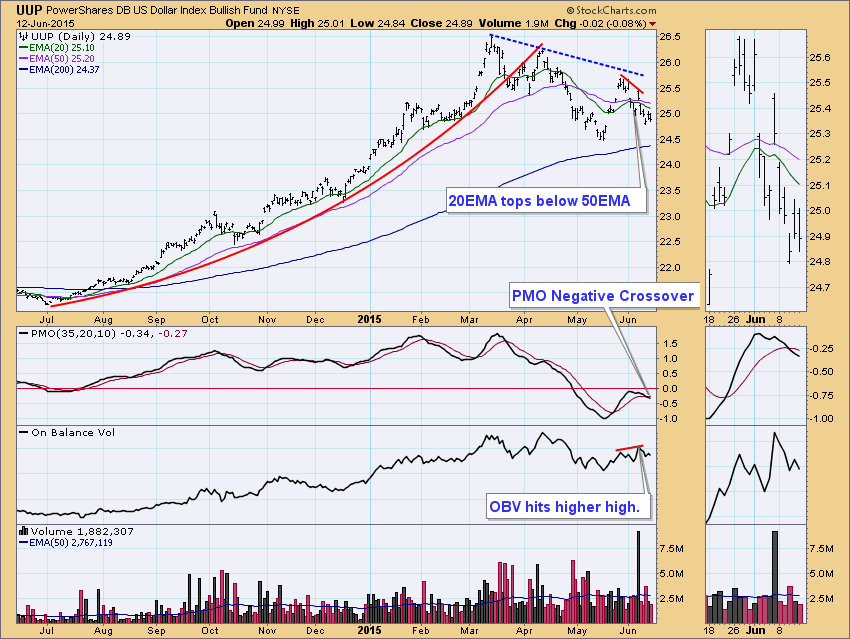
GOLD: Picture Improving Slightly
by Carl Swenlin,
President and Founder, DecisionPoint.com
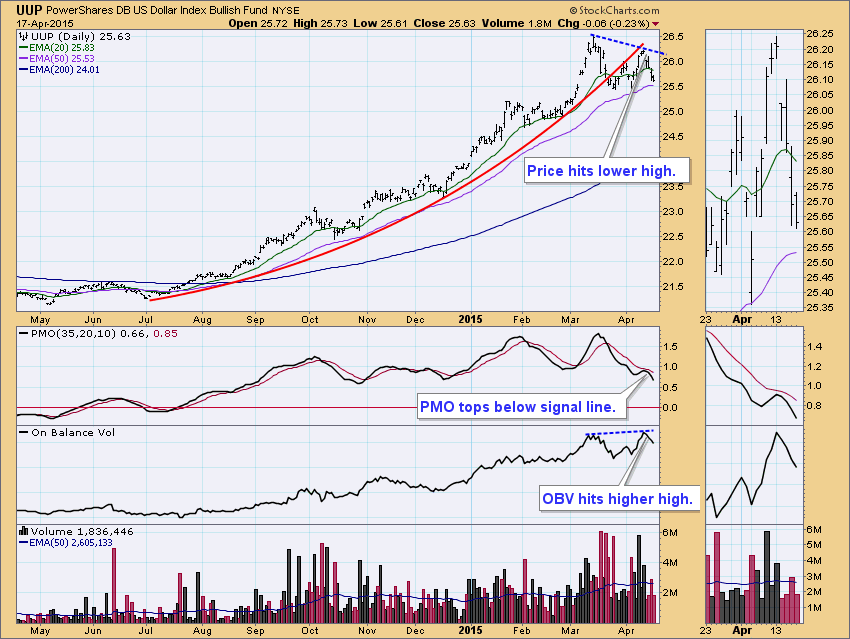
The outlook for gold depends primarily on the outlook for the U.S. dollar, so let's look at the chart of the dollar ETF. After declining for about two months from the March top, UUP rallied in May, but topped before it could reach the declining tops line....
READ MORE
MEMBERS ONLY
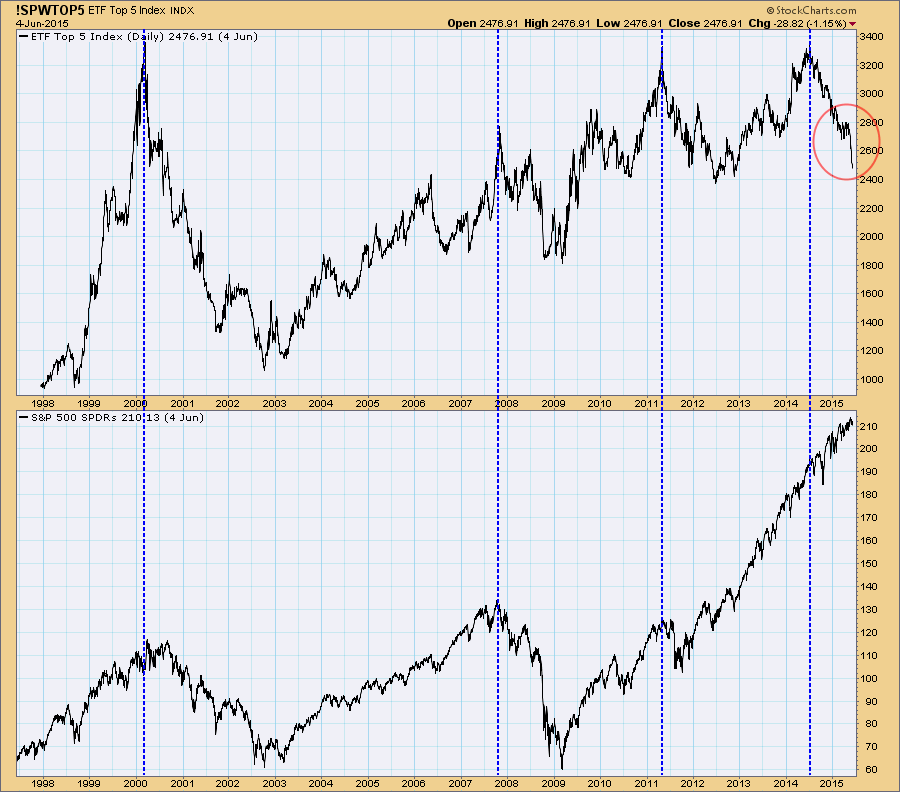
ETF Top 5 Index Accelerating Downward
by Carl Swenlin,
President and Founder, DecisionPoint.com
In the late-1990s I developed the ETF Top 5 Index (!SPWTOP5), which tracked the top five ranked ETFs (by PMO value) from our Tracker list of 100 ETFs. My original intention was to exploit the upward momentum of the ETFs with the highest PMO readings, presumably the strongest in the...
READ MORE
MEMBERS ONLY
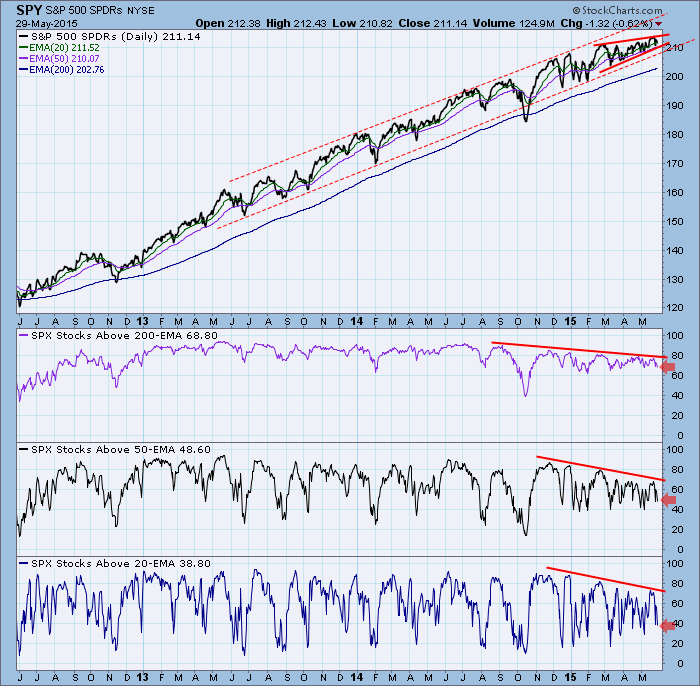
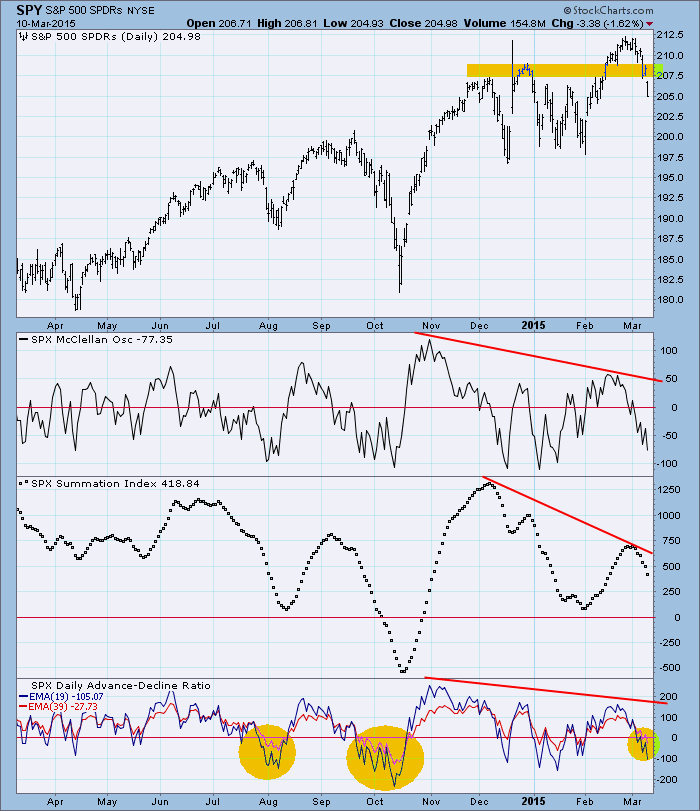
SPY: Negative Divergences Persist
by Carl Swenlin,
President and Founder, DecisionPoint.com
Last week I pointed out in my article that the SPY price chart had a bearish rising wedge pattern, and that there were negative divergences on various medium-term indicator charts. This week we can see that the rising wedge remains intact, but the expectation is that it will resolve to...
READ MORE
MEMBERS ONLY
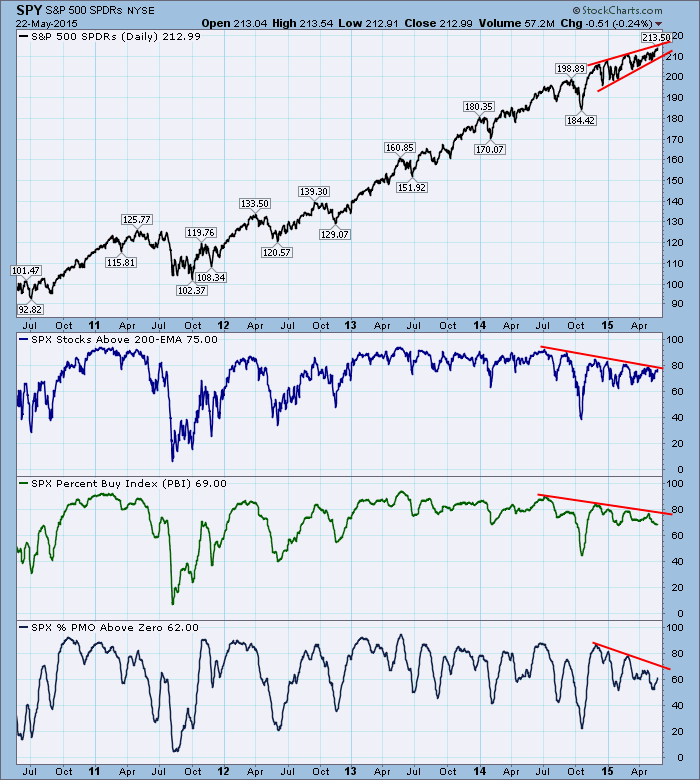
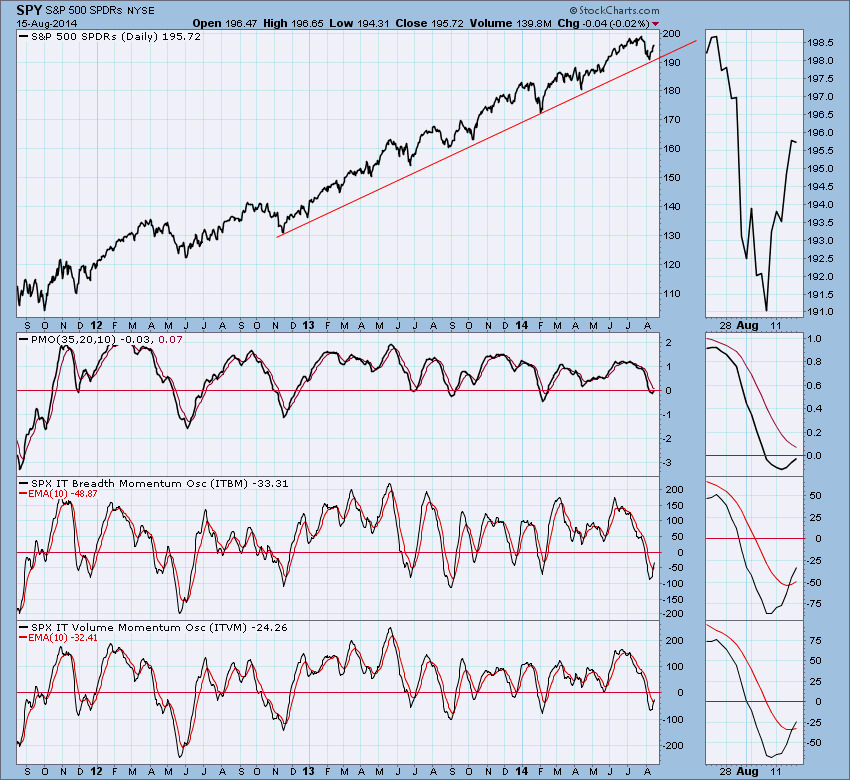
SPY Rising Wedge Implies Correction
by Carl Swenlin,
President and Founder, DecisionPoint.com
One of the things I have regularly stressed is the reliability of rising wedge formations, meaning that they have a high likelihood of breaking down. Currently, SPY has a pronounced rising wedge that has been forming over the last six months or so, as seen on the chart below. The...
READ MORE
MEMBERS ONLY
Trend Model Signals Now In DP Tracker Spreadsheets
by Carl Swenlin,
President and Founder, DecisionPoint.com
Recently StockCharts.com stopped publishing the DecisionPoint Tracker reports, but links to the Tracker Chart Books and Spreadsheets are still available in the DP Reports Blog. The Tracker Spreadsheets provide the same information as the old reports, but it is in a much more compact format. Additionally, we have added...
READ MORE
MEMBERS ONLY
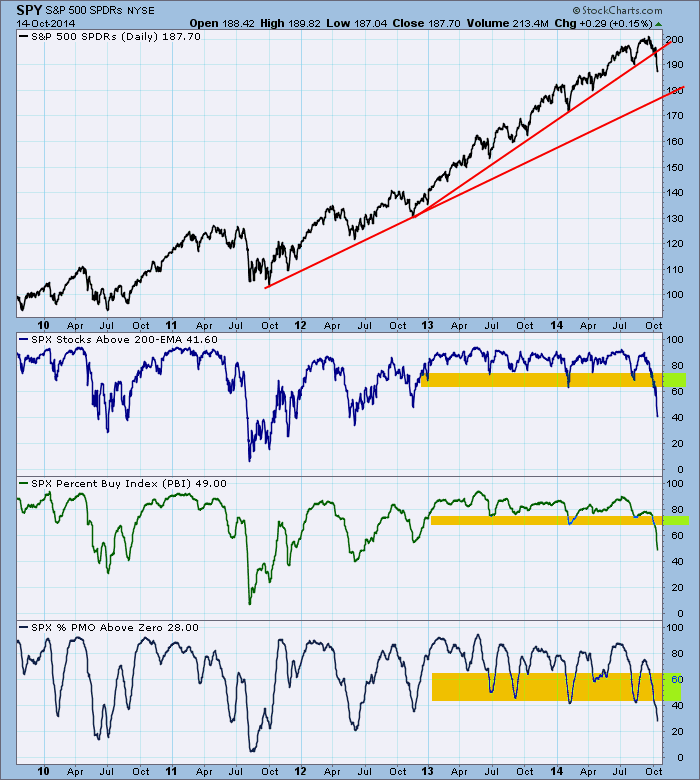
Short-Term Signal Aggregate Flashing Strong Warning
by Carl Swenlin,
President and Founder, DecisionPoint.com
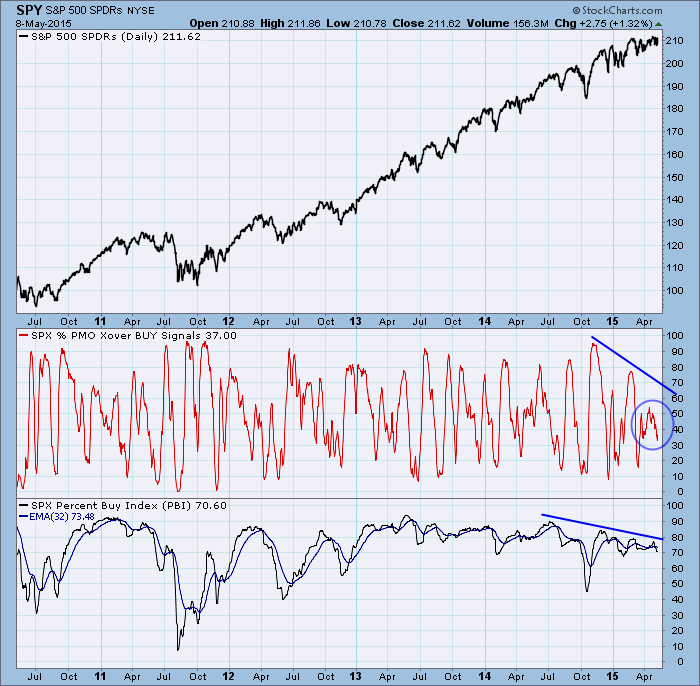
One of the charts we like to review from time to time is the Mechanical Signal Analysis chart. It shows the percentage of S&P 500 stocks on PMO crossover BUY signals (short-term), and the Percent Buy Index (PBI), which shows the percentage of S&P 500 stocks...
READ MORE
MEMBERS ONLY
BUY, Neutral, SELL -- Trading the PMO -- What Are Trend Model Signals Good For?
by Carl Swenlin,
President and Founder, DecisionPoint.com
During our last webinar we received questions and comments to which we were unable to respond due to time constraints, so we will take this opportunity to address some of the ones deemed to have broad interest.
Q: Please review the definitions of Buy, Neutral, and Sell signals.
A: First...
READ MORE
MEMBERS ONLY
SPY Monthly PMO: Long-Term SELL Signal Lurking
by Carl Swenlin,
President and Founder, DecisionPoint.com
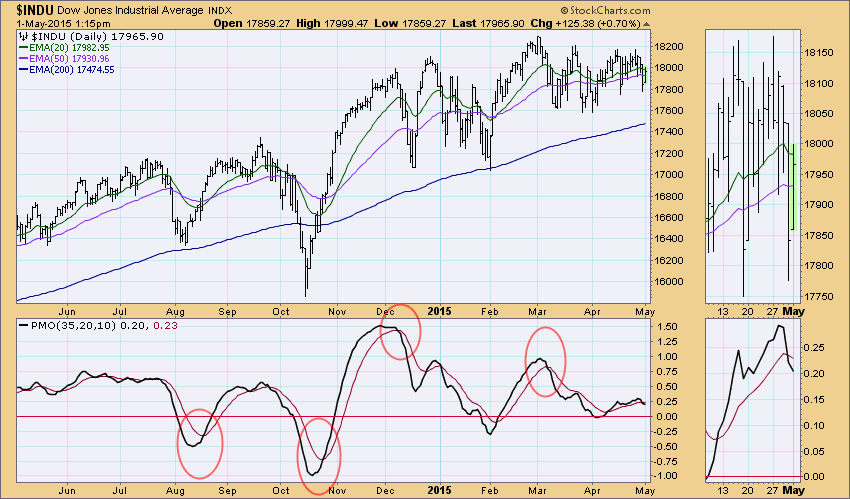
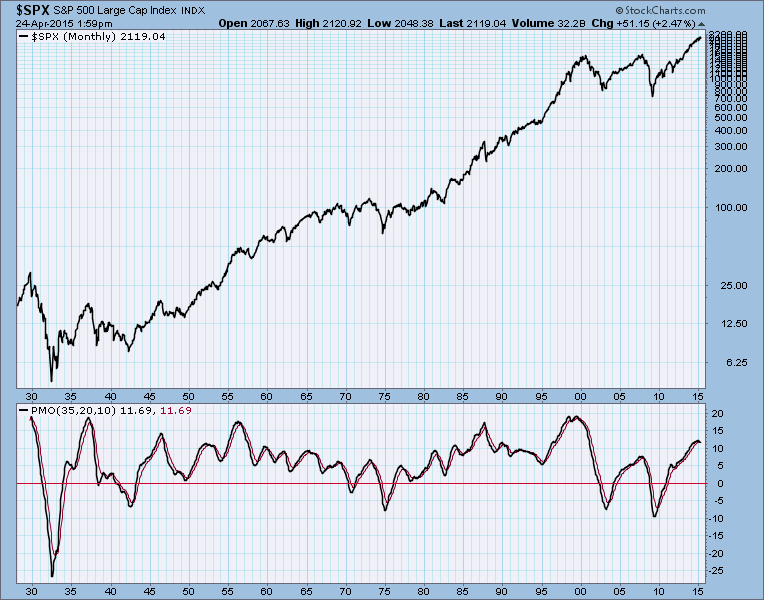
For most of this month we have been watching the monthly PMO (Price Momentum Oscillator) because it topped in December, and in April it crossed below its trigger line, potentially generating a long-term SELL signal. This hasn't happened for over seven years, so it really is kind of...
READ MORE
MEMBERS ONLY
U.S. Dollar: Evidence of Important Top
by Carl Swenlin,
President and Founder, DecisionPoint.com
The U.S. Dollar has been chopping around its recent high for over a month, and we think it is probably topping out after a major advance. While the current EMA structure is still strongly bullish (50EMA above the 200EMA, and 20EMA above the 50EMA), we can see some technical...
READ MORE
MEMBERS ONLY
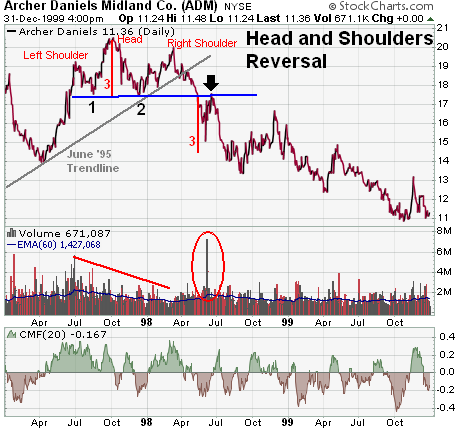
$GOLD Head and Shoulders? -- Earnings Improvement? -- Last SELL Signal? -- Flat PMO?
by Carl Swenlin,
President and Founder, DecisionPoint.com
During our last webinar we received questions and comments to which we were unable to respond due to time constraints, so we will take this opportunity to address some of them.
Q: On $GOLD you see a double bottom. I see a potential head and shoulders top, implying further declines....
READ MORE
MEMBERS ONLY
2014 Q4 Earnings Finalized
by Carl Swenlin,
President and Founder, DecisionPoint.com
Standard & Poors finalized 2014 Q4 earnings on Thursday, and I like to review the numbers and the earnings chart. (Note that earnings are reported during the three months following the end of each quarter.) First we have an excerpt from the DP Overview of Market Fundamentals Report which we...
READ MORE
MEMBERS ONLY
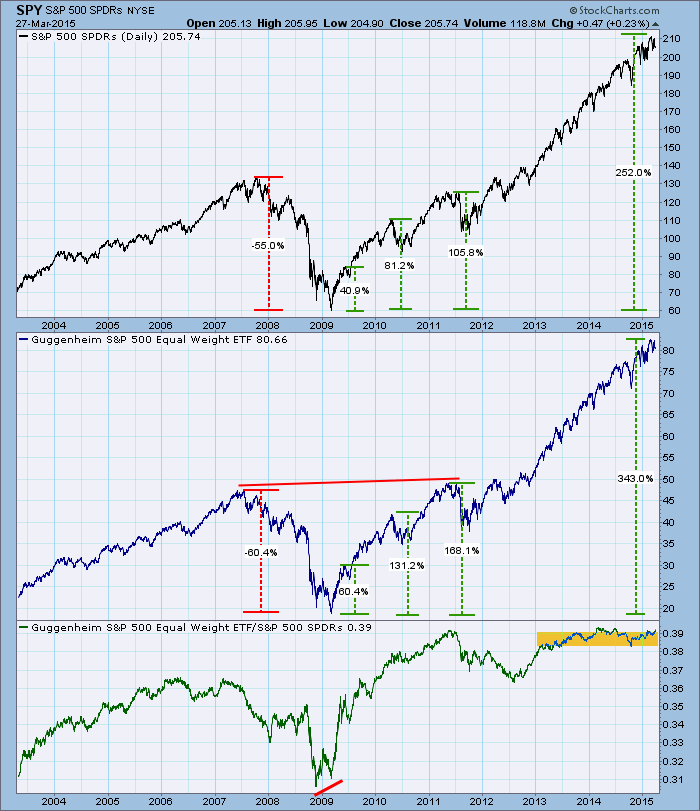
Equal-Weight Versus Cap-Weighted Indexes
by Carl Swenlin,
President and Founder, DecisionPoint.com
I have always been a fan of equal-weighted indexes as opposed to capitalization-weighted indexes because equal-weighted indexes generally give us more bang for the buck. The reason is that cap-weighted indexes weight the constituents based upon their market capitalization; whereas, equal-weighted indexes give each constituent an equal weight in the...
READ MORE
MEMBERS ONLY
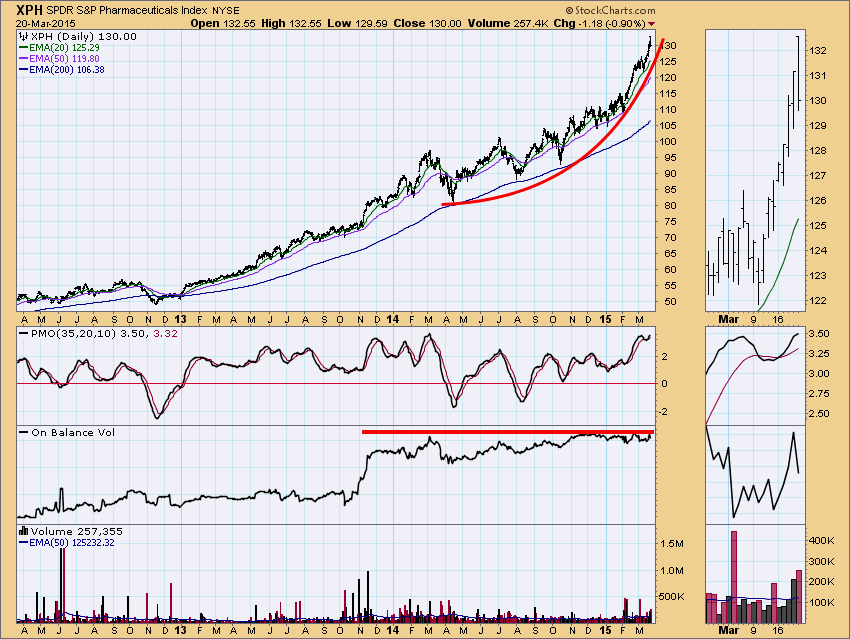
Be Careful of the Parabolic Advances
by Carl Swenlin,
President and Founder, DecisionPoint.com
When prices arc upward at ever-increasing speed, they form a parabolic curve, which should cause us to feel ever-increasing caution. With parabolic moves we never know when the final top will arrive because of the frenzy of buying driving the move, but we know that vertical moves cannot be sustained,...
READ MORE
MEMBERS ONLY
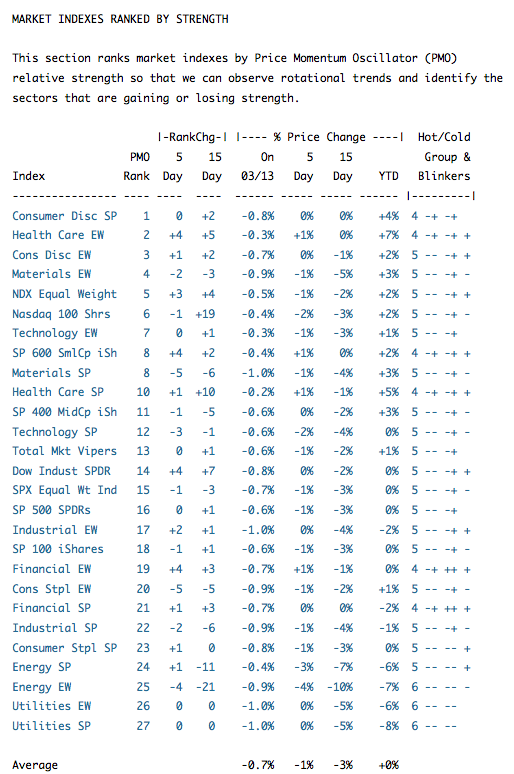
Understanding PMO Rankings With Hot and Cold Group & Blinkers
by Carl Swenlin,
President and Founder, DecisionPoint.com
In the DecisionPoint Daily Report and Tracker reports we sort the lists by PMO (Price Momentum Oscillator) rank using the current PMO value and listing the stocks/indexes from the strongest to the weakest, but as usual, we can't take the rankings at face value. There is more...
READ MORE
MEMBERS ONLY
McClellan Oscillator Components Moving Below Zero
by Carl Swenlin,
President and Founder, DecisionPoint.com
The McClellan Oscillator is a venerable indicator that was introduced in the late 1960s by Sherman and Marian McClellan. It is still followed today by many technical analysts, but I think many people find it a little intimidating, so I'd like to quickly review how I use it...
READ MORE
MEMBERS ONLY
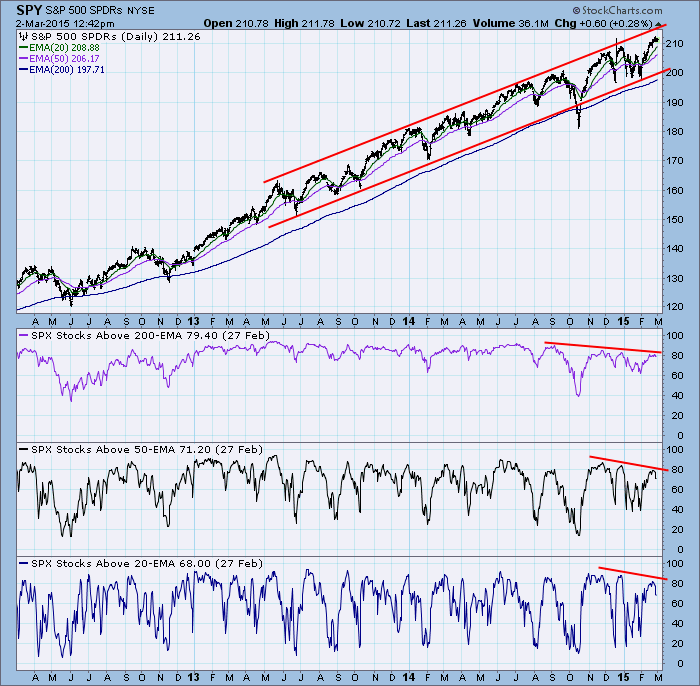
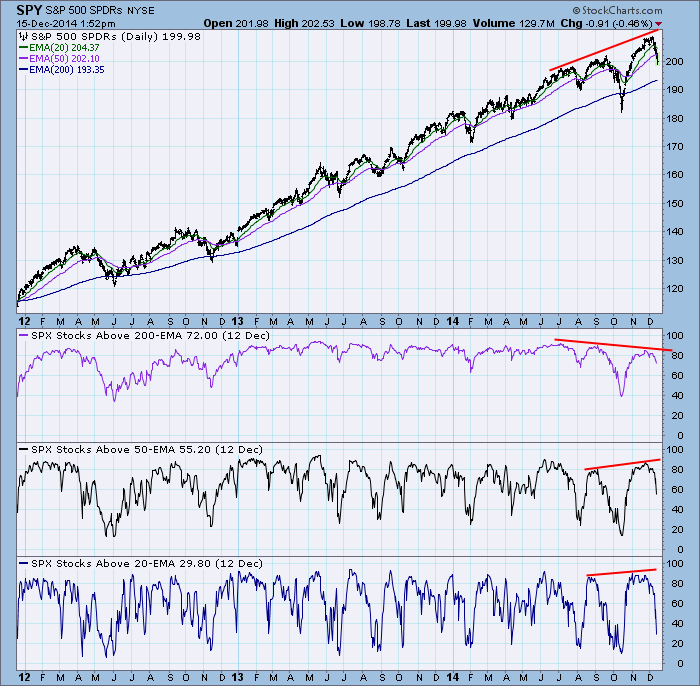
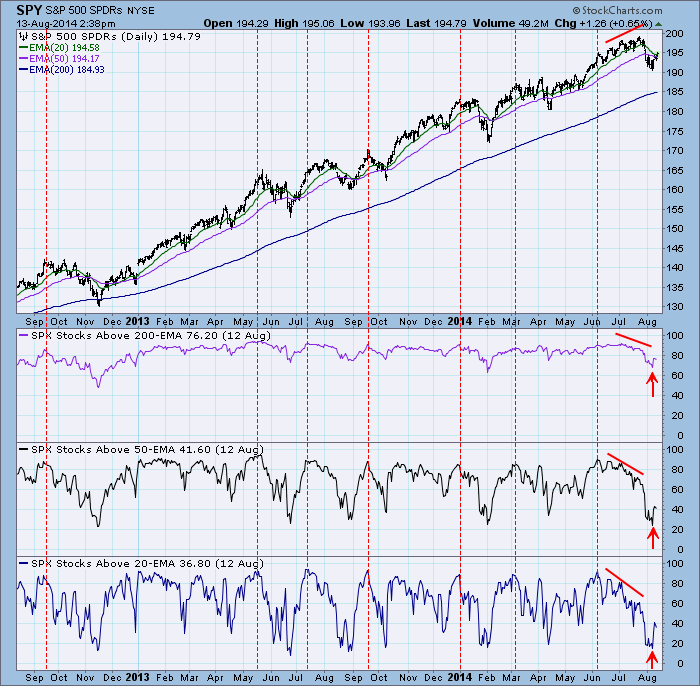
Market Correction Indicated as Fewer Stocks Participate in Current Rally
by Carl Swenlin,
President and Founder, DecisionPoint.com
A good way to gauge internal strength is by examining the percentage of stocks above their moving averages. On the chart below we can see the percentage of S&P 500 stocks above their 20EMA (short-term), 50EMA (medium-term) and 200EMA (long-term). The point of interest I have highlighted is...
READ MORE
MEMBERS ONLY
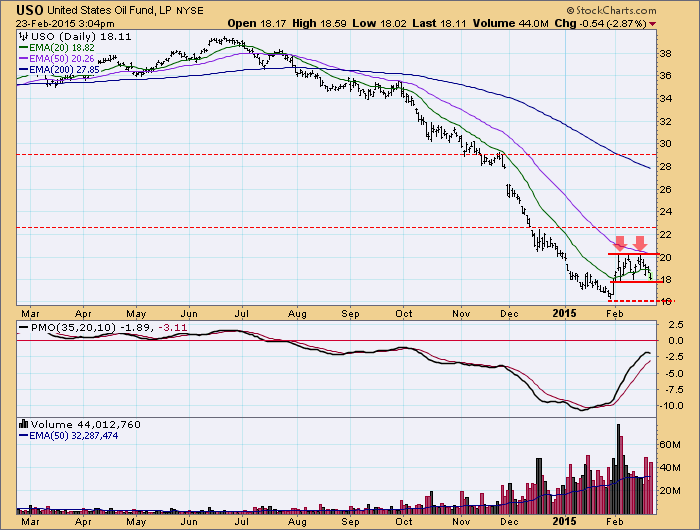
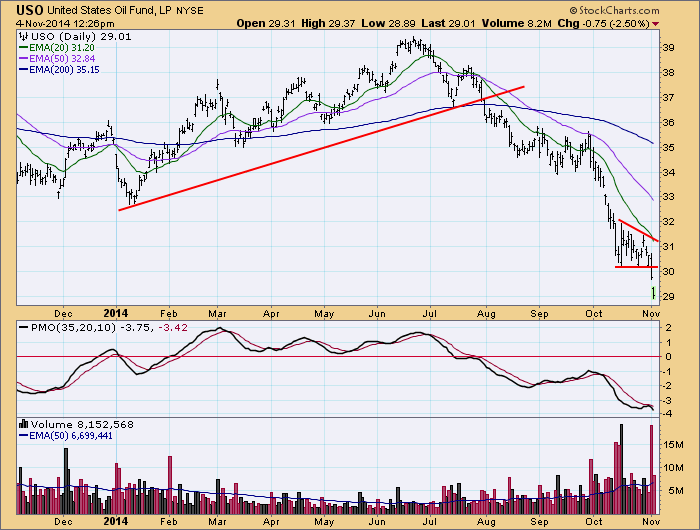
Oil Bottom Looking Shaky
by Carl Swenlin,
President and Founder, DecisionPoint.com
Crude oil has been trying hard to make a bottom, but it may take a little more work to get it done. After hitting an important low in January, U.S. Oil Fund (USO) bounced and has been consolidating for nearly a month. The consolidation may hold, but as of...
READ MORE
MEMBERS ONLY
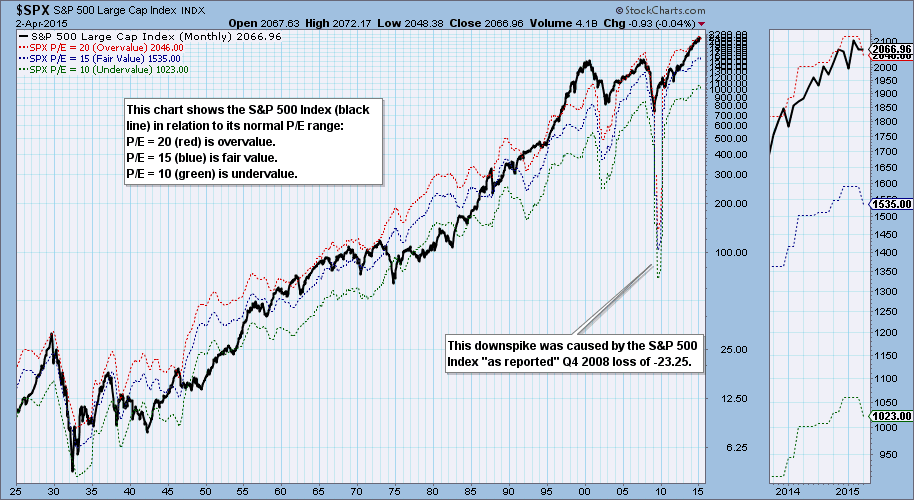
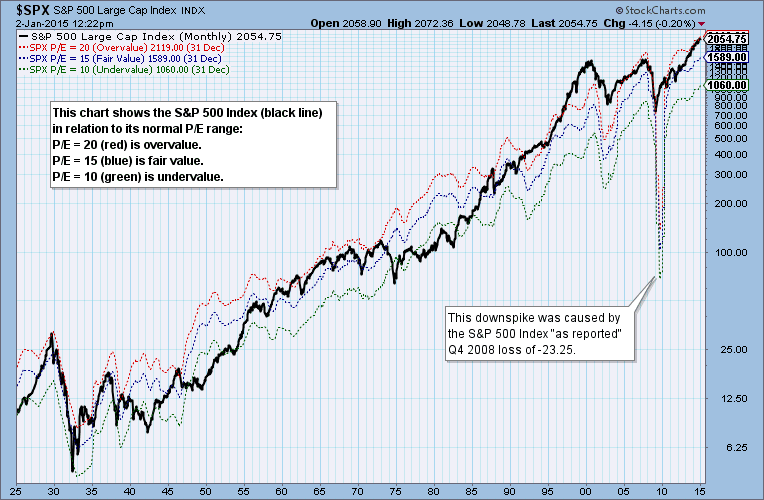
Q3 Earnings Results: Market Overvalued
by Carl Swenlin,
President and Founder, DecisionPoint.com
Standard & Poors has published preliminary S&P 500 results for the third quarter of 2014. Here is an excerpt from the DP Overview of Market Fundamentals report, which is available daily in the DP Reports Blog. We can see that, while the P/E is very close to...
READ MORE
MEMBERS ONLY
Carl, Again With the Crude?!!
by Carl Swenlin,
President and Founder, DecisionPoint.com
My last two articles have been about crude oil, so I thought I should give it a rest, but as I cast about for possible topics for a new article, crude is still the most interesting to me. Actually, it seems as though it is still interesting to our readers...
READ MORE
MEMBERS ONLY
Energy Rebound Suspicious
by Carl Swenlin,
President and Founder, DecisionPoint.com
A few weeks ago we looked at the possibility that the Energy SPDR (XLE) was setting up for a double bottom, which, unfortunately did not happen. More recently it has rallied strongly off the low of the XLE bear market, with a PMO positive divergence and contracting volume at the...
READ MORE
MEMBERS ONLY
Price Relative to Moving Averages: Decline Not Over
by Carl Swenlin,
President and Founder, DecisionPoint.com
One of our favorite analysis methods is to compare price to one of its moving averages. It is not infallible, but it is thoroughly objective. In particular we track stocks in relation to their 20EMA, 50EMA, and 200EMA because that gives us views of the short, medium, and long term....
READ MORE
MEMBERS ONLY
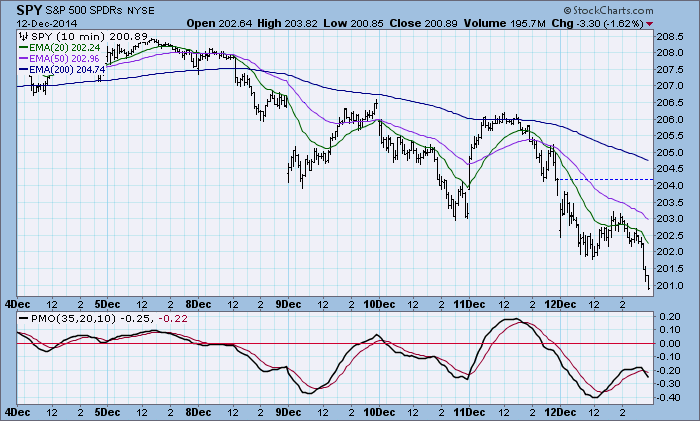
DP Weekly Update: Bad Week for Stocks and Oil - December 12, 2014
by Carl Swenlin,
President and Founder, DecisionPoint.com
The market opened down today and quickly took out Wednesday's lows. There was an attempt at consolidation, but it finally broke down to close very near the lows for the day. SPY has declined about -3.8% from the all-time high reached last week.
The purpose of the...
READ MORE
MEMBERS ONLY
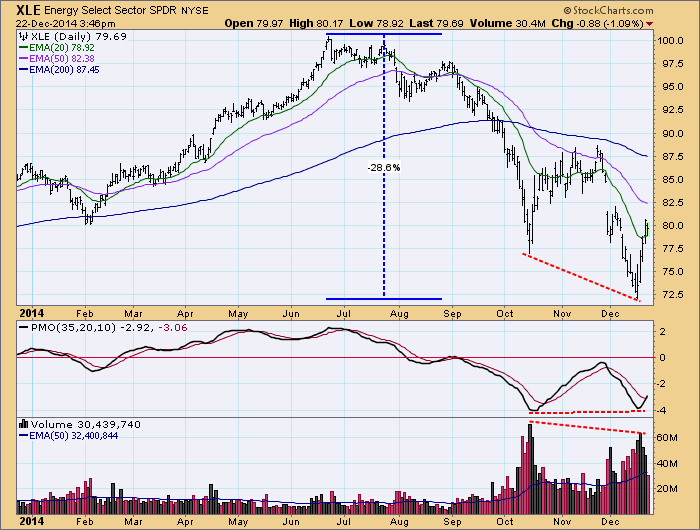
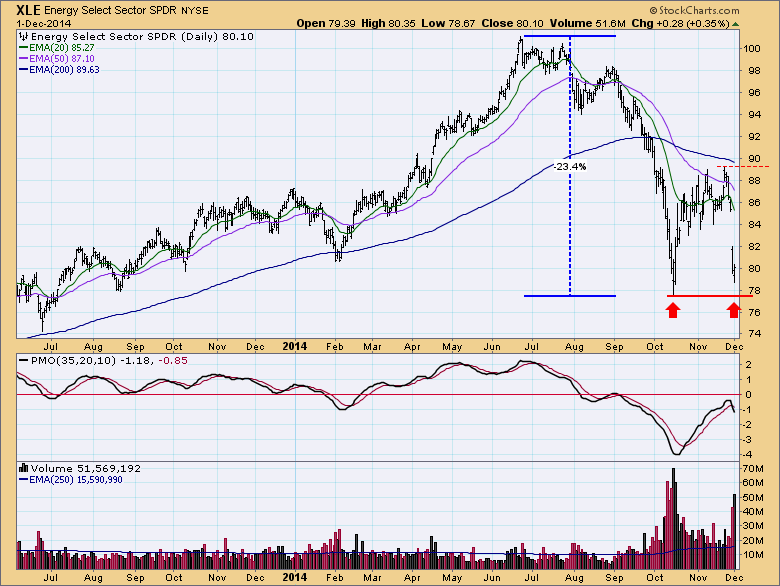
Buying Opportunity for Energy?
by Carl Swenlin,
President and Founder, DecisionPoint.com
The energy sector has gotten pretty beaten up, and we were wondering if a buying opportunity might present in the near future. After looking at the chart we see that there is the possibility of a double bottom. The Energy SPDR (XLE) has declined over -23% since the June top,...
READ MORE
MEMBERS ONLY
"Model Behavior" - Focus on the DecisionPoint Price Momentum Model (PMM)
by Carl Swenlin,
President and Founder, DecisionPoint.com
The purpose of a trading model is to define certain conditions that, when met, alert us to consider making a decision to buy or sell. We assume that a large majority of technical analysts use trading models of some kind to assist in their trading decisions. DecisionPoint uses the DP...
READ MORE
MEMBERS ONLY
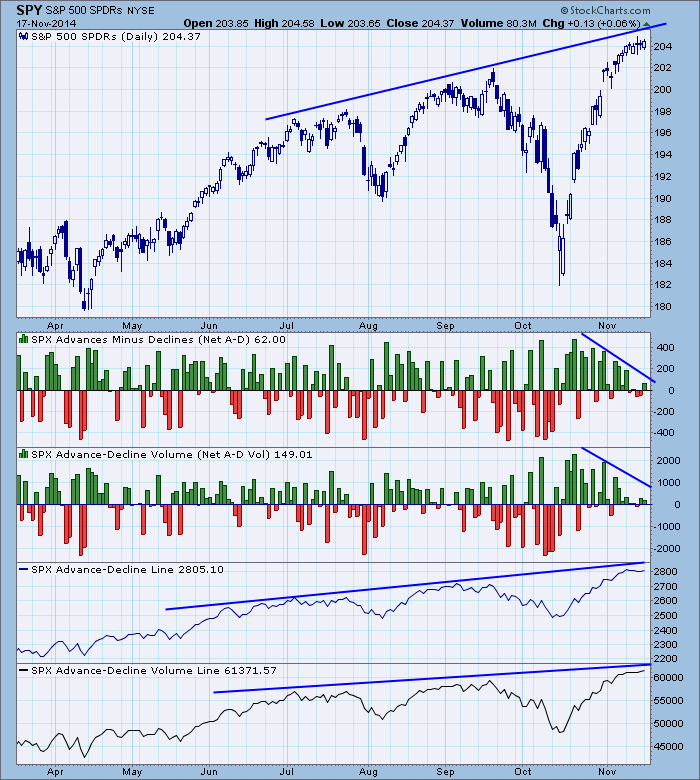
Advance-Decline Lines Still Confirming Market Highs
by Carl Swenlin,
President and Founder, DecisionPoint.com
We see plenty of indicators that tell us that there is a possibility for a correction, but not all indicators are sending that message. One in particular is the Advance-Decline Line (A-D Line). It is one of the first technical indicators ever developed, and it is simply a cumulative total...
READ MORE
MEMBERS ONLY
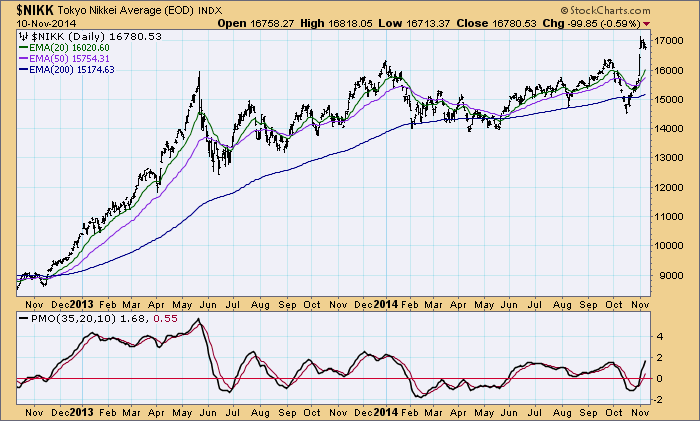
LT Double Bottom on the Nikkei
by Carl Swenlin,
President and Founder, DecisionPoint.com
We've been hearing how Japan's latest foray into money printing has been such a great help for their stock market, but it is always best to see if the chart matches the story. After rising strongly off the late-2012 low, the Nikkei moved sideways for over...
READ MORE
MEMBERS ONLY
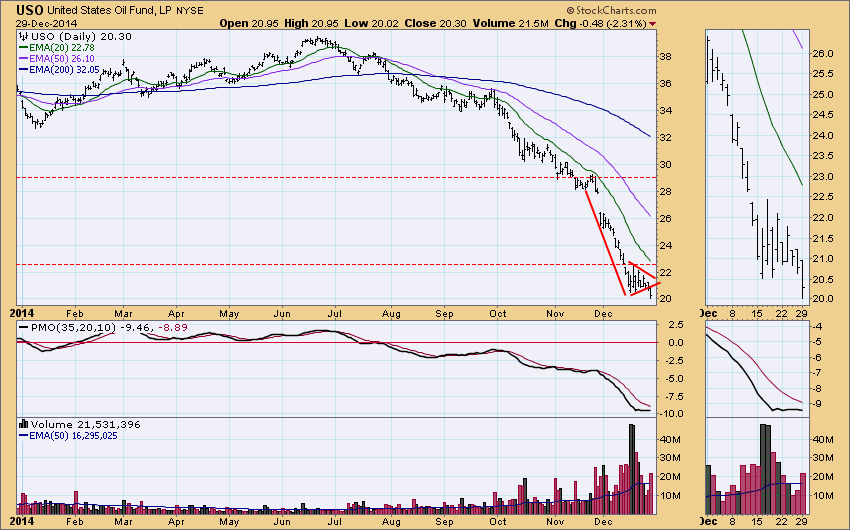
Crude Oil (USO) Reaches Important Support
by Carl Swenlin,
President and Founder, DecisionPoint.com
Crude oil has dropped below $80.00 and is currently trading at about $76.50. We use the U.S. Oil Fund ETF (USO) as a surrogate for crude because it incorporates the cost of trading the futures contracts, and provides a simple vehicle for trading crude.
At the end...
READ MORE
MEMBERS ONLY
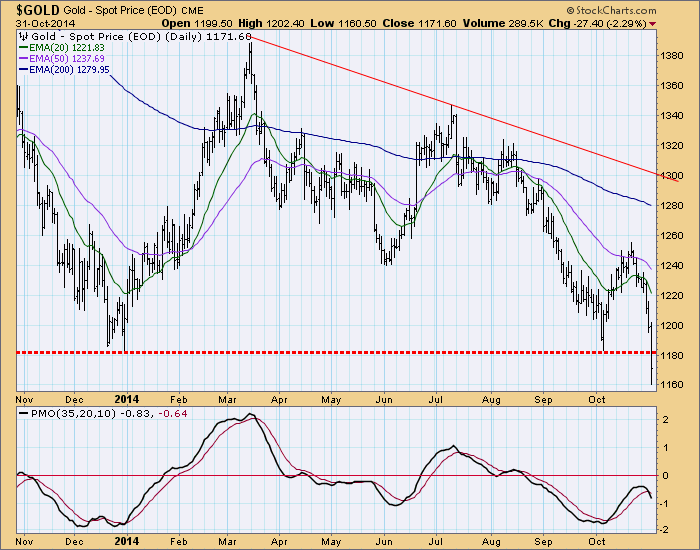
GOLD: Support Fails
by Carl Swenlin,
President and Founder, DecisionPoint.com
We have been watching gold for a possible triple bottom, a base for the next strong rally. Earlier this month gold bounced off an important support line, offering hope to gold bulls that the third bottom in the series would be successful. However, the price of gold has slipped badly...
READ MORE
MEMBERS ONLY
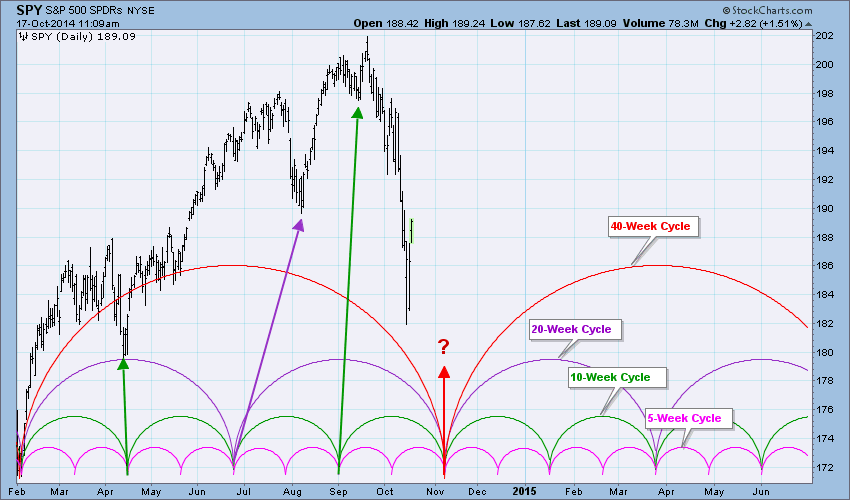
Important Cycle Low Due Soon
by Carl Swenlin,
President and Founder, DecisionPoint.com
Fair warning! If you read this article and get hooked on cycle analysis, you will rue the day. If we look at price charts, we can clearly see that prices move up and down in cycles, but trying to use this tool can be frustrating beyond words. There are certainly...
READ MORE
MEMBERS ONLY
Longer-Term Indicators Finally Moving Deeper
by Carl Swenlin,
President and Founder, DecisionPoint.com
We have some longer-term indicators that we like because they are derived from price movement, rather than breadth or volume. They have a finite range (0-100) and reflect the percentage of index component stocks in a particular status. For almost two years they have stayed at unusually high levels, never...
READ MORE
MEMBERS ONLY
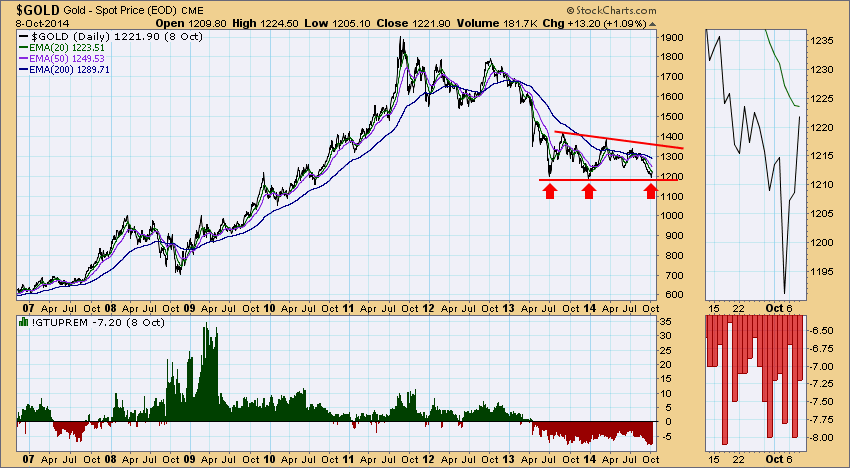
GOLD: Bouncing Off Support
by Carl Swenlin,
President and Founder, DecisionPoint.com
In our article on September 23 we postulated that gold seemed to be setting up for a triple bottom, but it was too soon to tell for sure. As of this week gold has reached the level of support drawn from the two previous bottoms, and it has bounced off...
READ MORE
MEMBERS ONLY
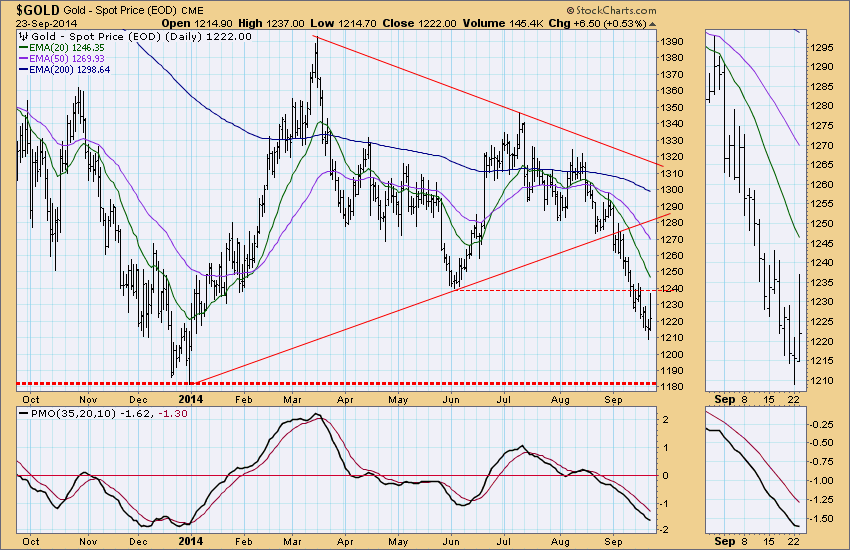
GOLD: Possible Triple Bottom
by Carl Swenlin,
President and Founder, DecisionPoint.com
Gold has been performing badly for some time, but especially since August 21st when our Trend Model changed from a BUY to a SELL. The chart is completely negative with price below the 20EMA, which is below the 50EMA, which is below the 200EMA. Recent support at 1240 failed quickly,...
READ MORE
MEMBERS ONLY
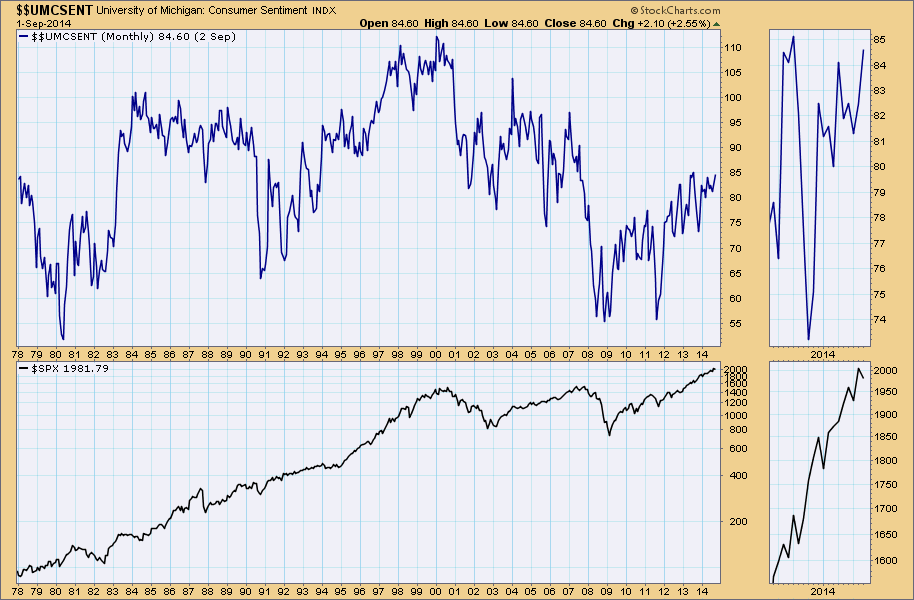
Consumer Sentiment Improves but Is Historically Mediocre
by Carl Swenlin,
President and Founder, DecisionPoint.com
Just a quick note here to look at the University of Michigan Consumer Sentiment chart. It has been reported that Consumer Sentiment improved this month, and that it is near last year's high; however, in the historical context it is only midway its 35-year range. This is notable...
READ MORE
MEMBERS ONLY
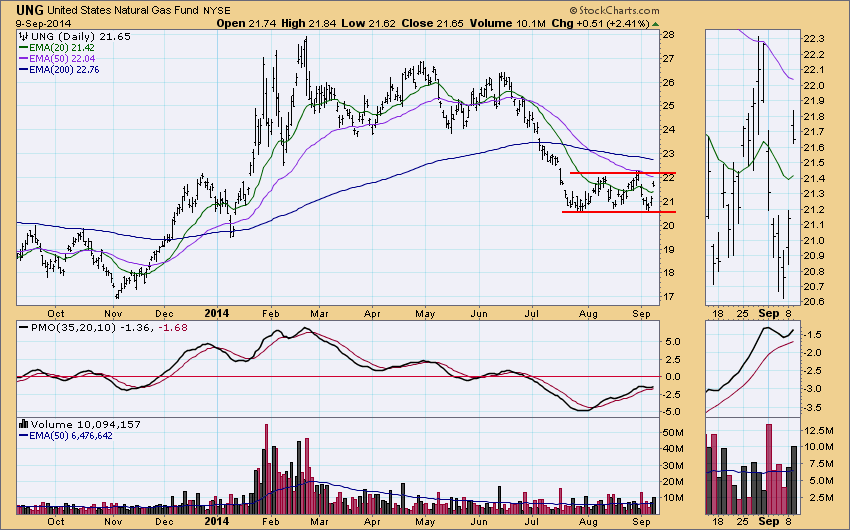
UNG (Natural Gas) Still Basing
by Carl Swenlin,
President and Founder, DecisionPoint.com
UNG, the Natural Gas ETF, caught our attention in today's ETF Tracker Report because it had the largest percentage up change at +2.41%. A quick check of the chart shows it being in a trading range for over a month, and today's move was not...
READ MORE
MEMBERS ONLY
Short-Term Weakness Possible
by Carl Swenlin,
President and Founder, DecisionPoint.com
We have a set of very short-term indicators we look at every day, and they are showing some internal deterioration in that time frame (days). Note that they have been backing off from the overbought readings of just a few days ago, even as price has moved higher. The peak...
READ MORE
MEMBERS ONLY
Getting a Quick Daily Market Overview
by Carl Swenlin,
President and Founder, DecisionPoint.com
After Erin's presentation at ChartCon 2014 many attendees responded positively to learning about the DP Daily Update, which is located in the DP Reports Blog (available to StockCharts EXTRA and above subscribers). The purpose of the DP Daily Update is to quickly review the day's action,...
READ MORE
MEMBERS ONLY
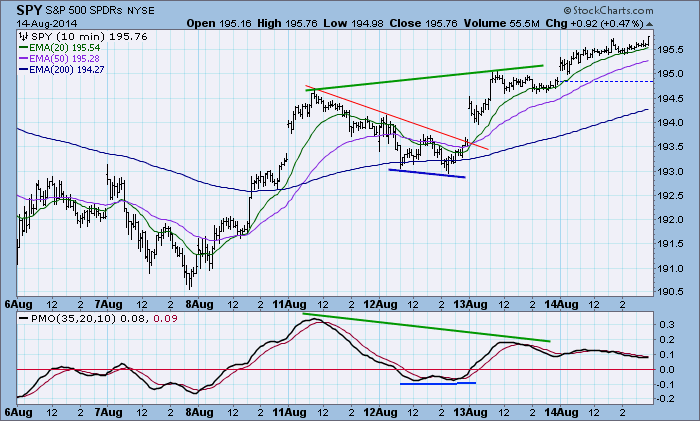
DP Daily Update: Drifting Above Resistance - August 14, 2014
by Carl Swenlin,
President and Founder, DecisionPoint.com
This is a sample of the DP Daily Update, which is available to StockCharts EXTRA and above subscribers. The purpose of the DecisionPoint Daily Update is to quickly review the day's action, internal condition, and Trend Model status of the broad market (S&P 500), the nine...
READ MORE
MEMBERS ONLY
Percentage of Stocks Above Their 20/50/200-EMAs Looks Bullish
by Carl Swenlin,
President and Founder, DecisionPoint.com
Our indicators, the Percentage of Stocks Above their 20/50/200EMAs, gives us a view of market internals in three time frames: the 20EMA is short-term, the 50EMA is medium-term, and the 200EMA is long-term. When they have all reached the same extreme on either side of their normal range,...
READ MORE
MEMBERS ONLY
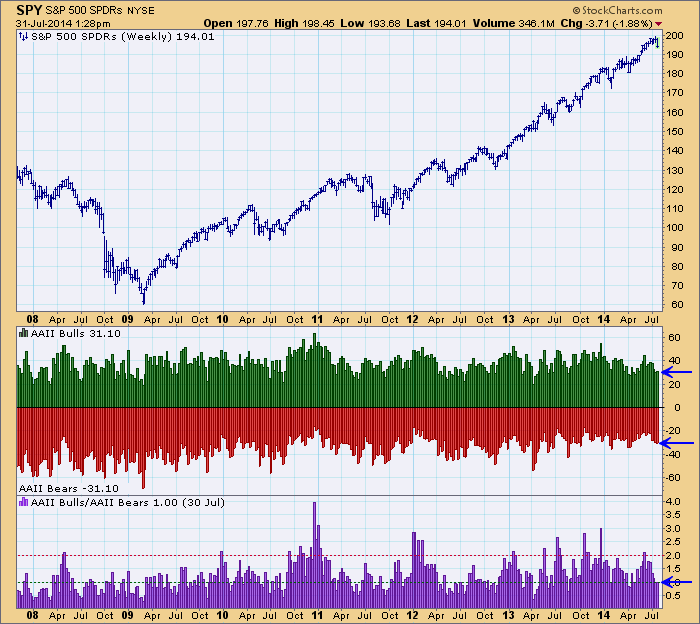
AAII Sentiment Shows Investors Cautious
by Carl Swenlin,
President and Founder, DecisionPoint.com
For the second week in a row the AAII (American Association of Individual Investors) Investor Sentiment Poll shows that the percentage of bulls and bears are about equal, resulting in a Bull/Bear ratio of 1.0. This is a mildly bullish reading, but it is a far cry from...
READ MORE
MEMBERS ONLY
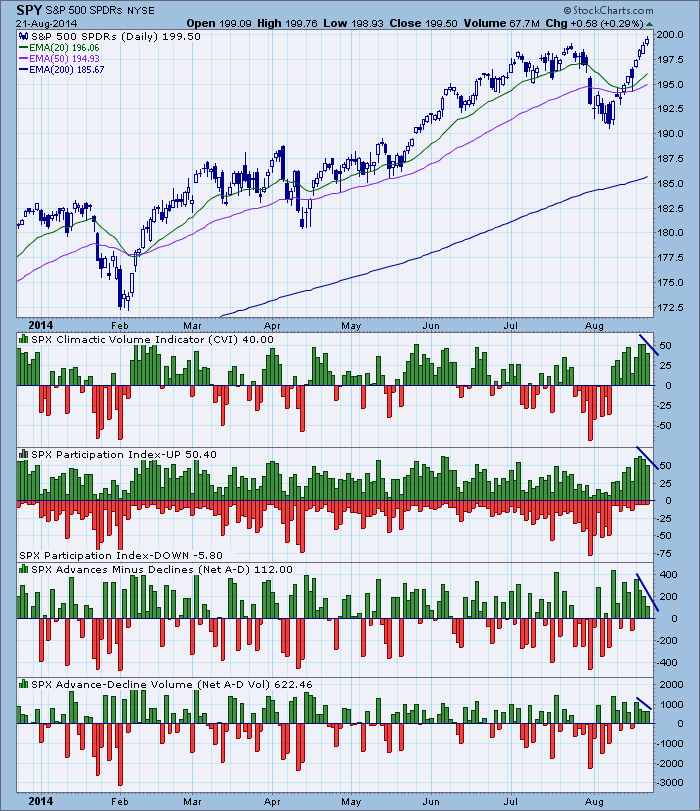
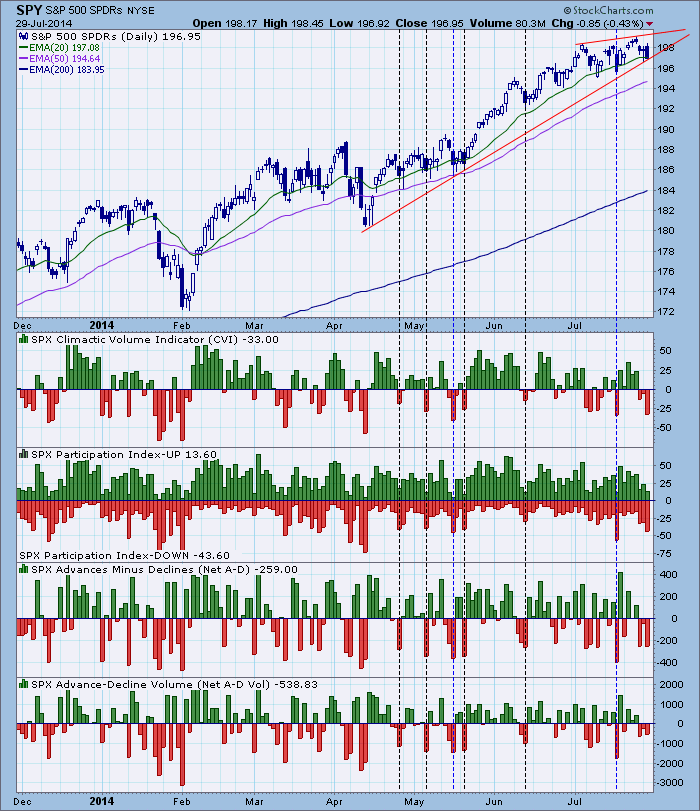
Minor Selling Climax
by Carl Swenlin,
President and Founder, DecisionPoint.com
We track a group of ultra-short-term indicators that identify buying or selling climaxes in that time frame. Climax readings typically tell us that price movement in the direction of the climax is probably exhausted, and that consolidation or price reversal is possible.
Today the Climactic Volume Indicator (CVI) and Participation...
READ MORE