MEMBERS ONLY
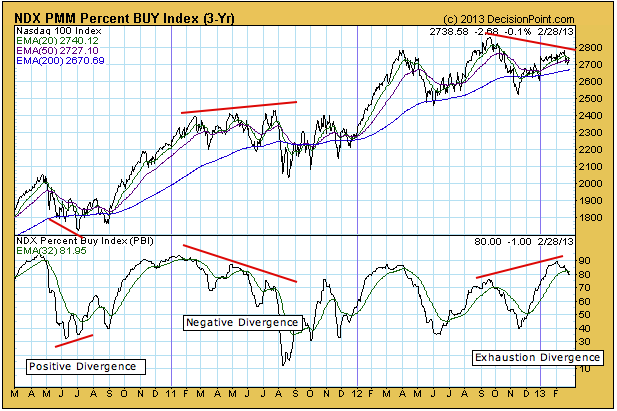
NDX Exhaustion Divergence
by Carl Swenlin,
President and Founder, DecisionPoint.com
Textbook dIvergences occur when an indicator fails to keep up with price. For example, a positive divergence is when price makes a lower bottom, but the indicator makes a higher bottom. A negative divergence is when price makes a higher top, but the indicator makes a lower top. In each...
READ MORE
MEMBERS ONLY
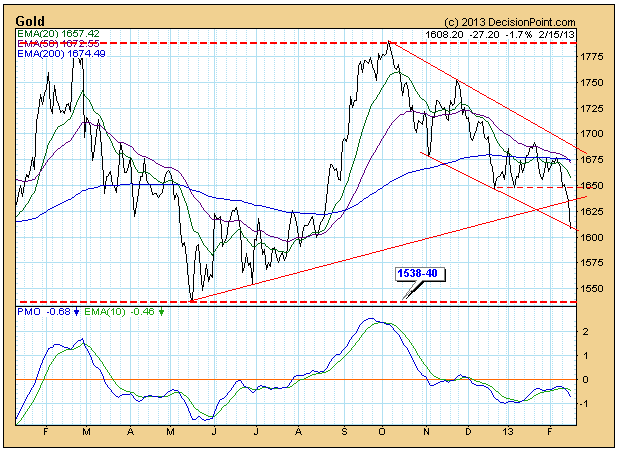
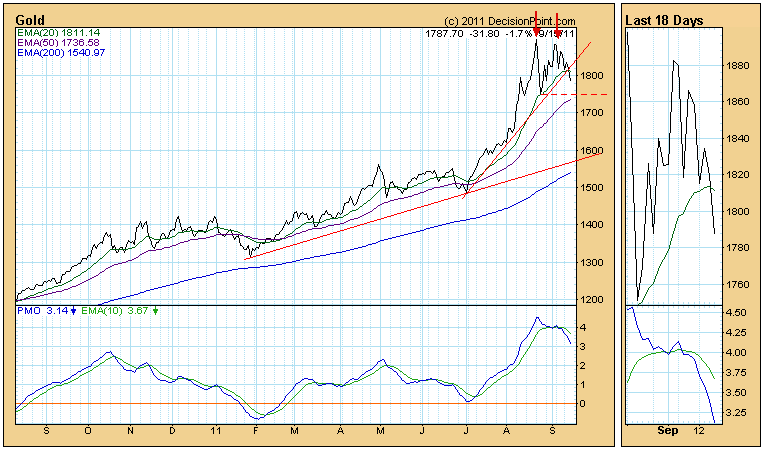
Gold Now Approaching Critical Support
by Carl Swenlin,
President and Founder, DecisionPoint.com
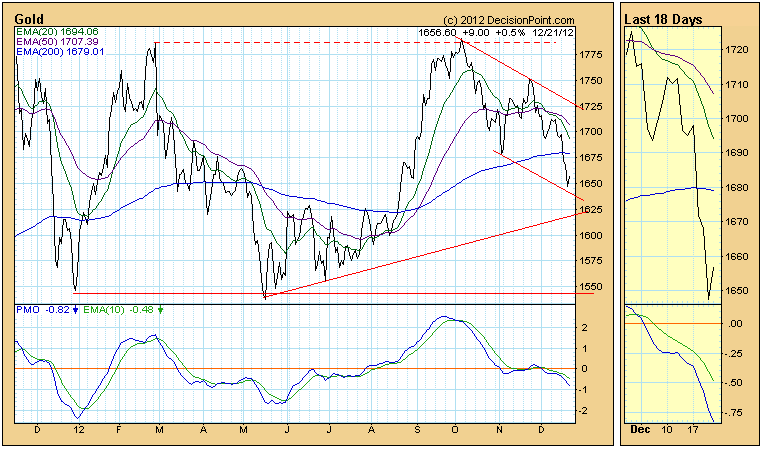
Downward pressure in gold prices continued as very large funds liquidated substantial portions of their positions in the gold ETF (GLD). (See article.) Naturally, we need to look at the charts to give this story some context. (Charts were made before the close.)
The daily chart shows that price has...
READ MORE
MEMBERS ONLY
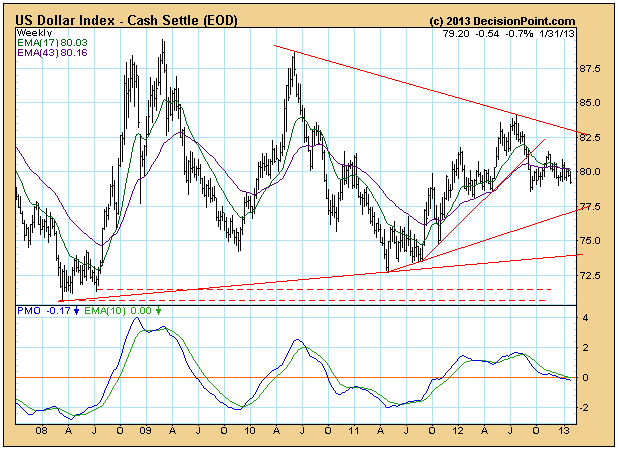
FUTURES INDEXES VERSUS ETFs
by Carl Swenlin,
President and Founder, DecisionPoint.com
READER QUESTION: I am always curious why you elect to use a surrogate of a market to provide a technical analysis. The one I have a concern with is using UUP to analyze a H&S formation and mention violation of support. However, the actual dollar chart shows that...
READ MORE
MEMBERS ONLY
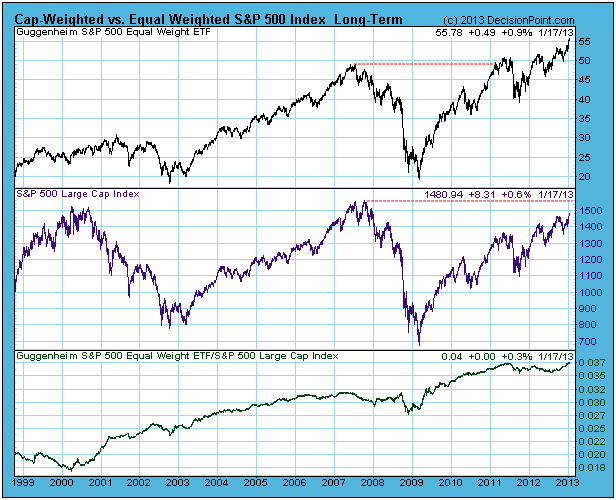
Equal-Weighted Beating Cap-Weighted Again
by Carl Swenlin,
President and Founder, DecisionPoint.com
I have long been a cheerleader for equal-weighted indexes versus cap-weighted ones, and now seems like a good time to demonstrate why. In a cap-weighted index stocks influence the price of the index based upon their market capitalization (price time number of shares). For example the top 50 stocks in...
READ MORE
MEMBERS ONLY
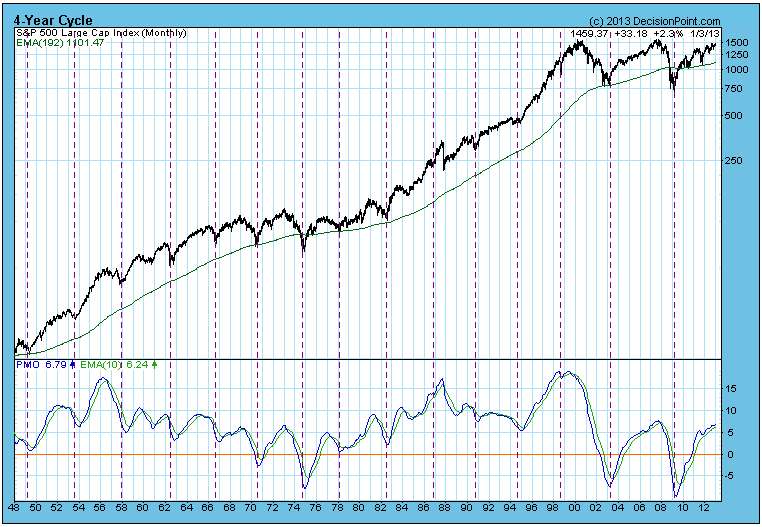
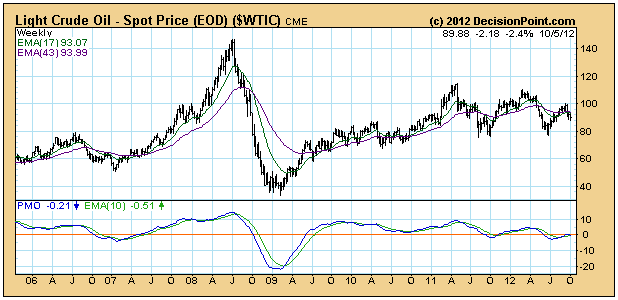
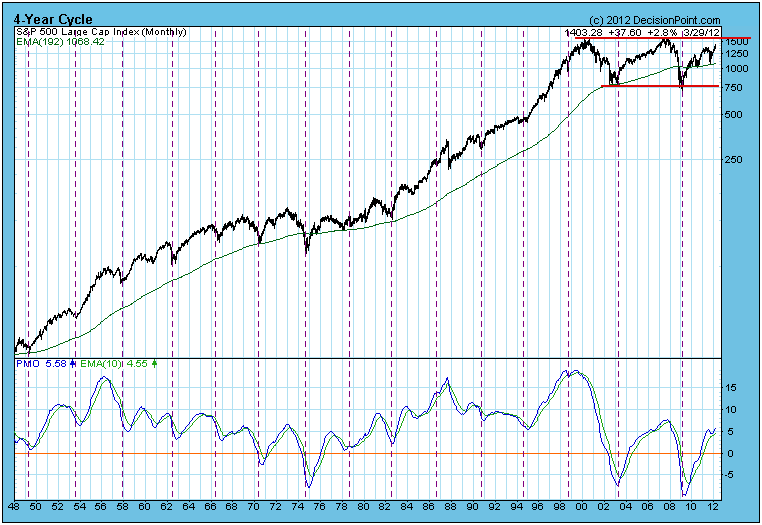
FOUR-YEAR CYCLE LOW WILL BE LATE
by Carl Swenlin,
President and Founder, DecisionPoint.com
Calculating from the Four-Year Cycle low in 2009, the next cycle low is due in two months, but unless there is a major crash, that projection will not be realized. In fact, we can't even say that there has been a cycle crest yet, although, given the proximity...
READ MORE
MEMBERS ONLY
GOLD'S WEAKNESS PERSISTS
by Carl Swenlin,
President and Founder, DecisionPoint.com
About a month ago I wrote an article stating that I thought that gold was resuming its long-term up trend, but that belief was conditioned upon price moving above the October top. That did not happen. Instead, after putting in a lower top in November, price has dropped below the...
READ MORE
MEMBERS ONLY
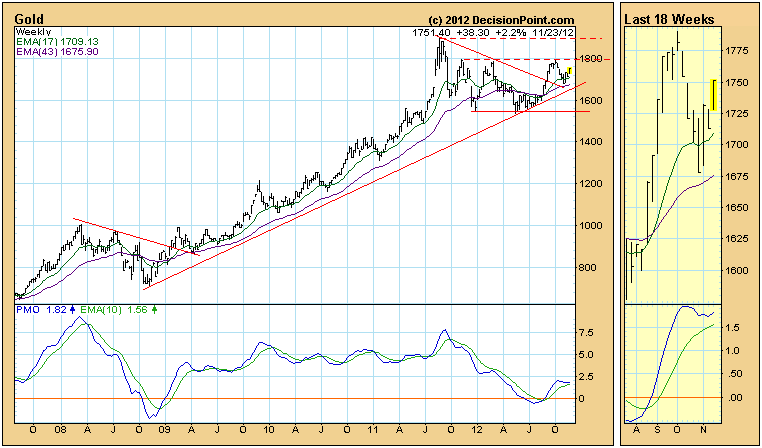
GOLD RESUMING LONG-TERM UP TREND?
by Carl Swenlin,
President and Founder, DecisionPoint.com
On the weekly chart below, we can see that, after making a new, all-time high back in August of 2011, gold went into a correction/consolidation mode, ultimately forming a descending triangle. While this formation suggests lower prices (the flat line is the weakest), price broke up through the top...
READ MORE
MEMBERS ONLY
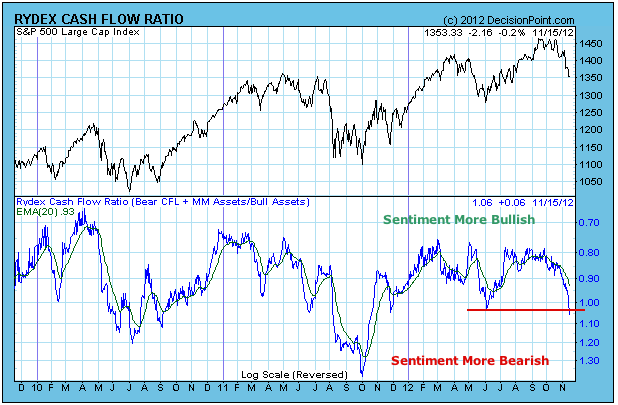
RYDEX CASH FLOW SHOWS TIMID BEARS
by Carl Swenlin,
President and Founder, DecisionPoint.com
The Rydex Cash Flow Ratio gives a view of sentiment extremes by using cumulative cash flow (CCFL) into Rydex mutual funds. It is calculated by dividing Money Market plus Bear Funds CCFL by Bull Funds plus Sector Funds CCFL. (To read more click here.) While the Ratio shows that Rydex...
READ MORE
MEMBERS ONLY
Lessons from the 1987 Crash
by Carl Swenlin,
President and Founder, DecisionPoint.com
It has been 25 years since the 1987 Crash, and I thought it would be a good time review a few things that probably won't be covered elsewhere in the media. I may have covered these issues in the past, but a refresher can't hurt.
One...
READ MORE
MEMBERS ONLY
SOARING GAS PRICES IN CALIFORNIA
by Carl Swenlin,
President and Founder, DecisionPoint.com
According to a news clip I just saw, there is a gas station in the Los Angeles area currently selling regular gasoline for $5.58/gallon. Some gas stations are shutting down because the owners don't want to buy gas at these prices for fear that they won&...
READ MORE
MEMBERS ONLY
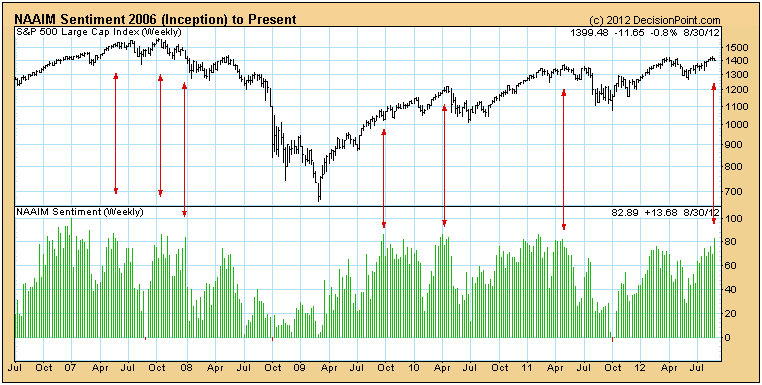
NAAIM SENTIMENT AND SEASONALITY URGE CAUTION
by Carl Swenlin,
President and Founder, DecisionPoint.com
The National Association of Active Investment Managers (NAAIM) weekly poll* shows that they are 83% long. This qualifies as an extreme level of optimism, and should cause concern.
On the following chart we can see that readings above 80% are not a magic number or an automatic sell signal; however,...
READ MORE
MEMBERS ONLY
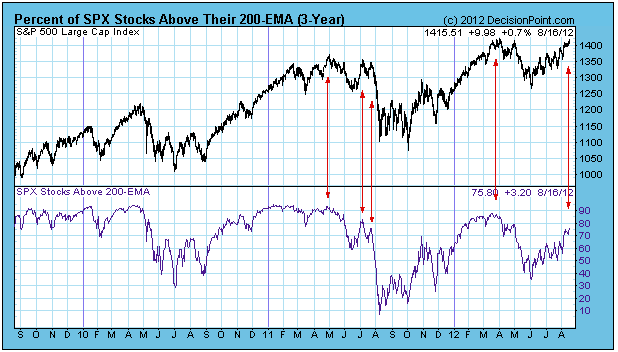
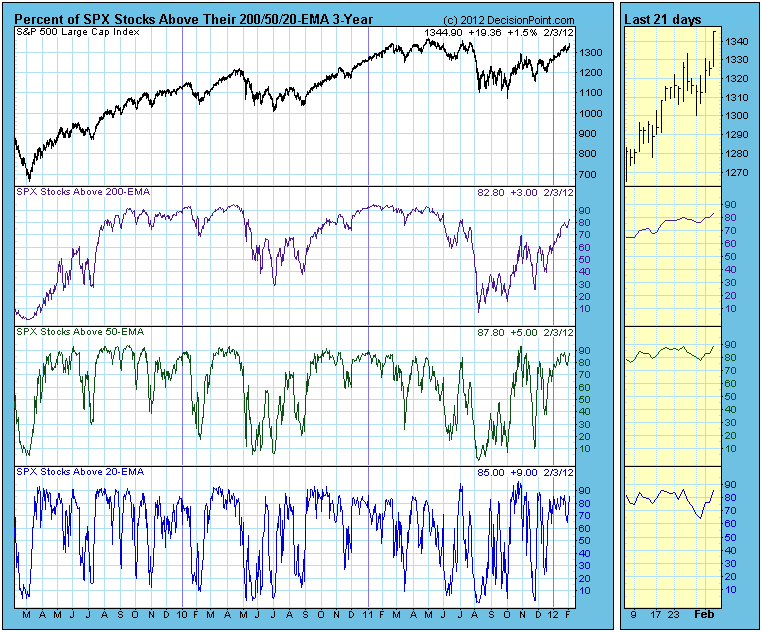
STOCKS ABOVE 200-EMA INDEX SHOWS ERODING SUPPORT
by Carl Swenlin,
President and Founder, DecisionPoint.com
When a stock is above its 200-EMA, it is considered bullish, and in the broadest sense the stock can be considered to be in a long-term rising trend. A good way to determine the amount of support behind a rally is to analyze the percentage of stocks above their 200-EMA....
READ MORE
MEMBERS ONLY
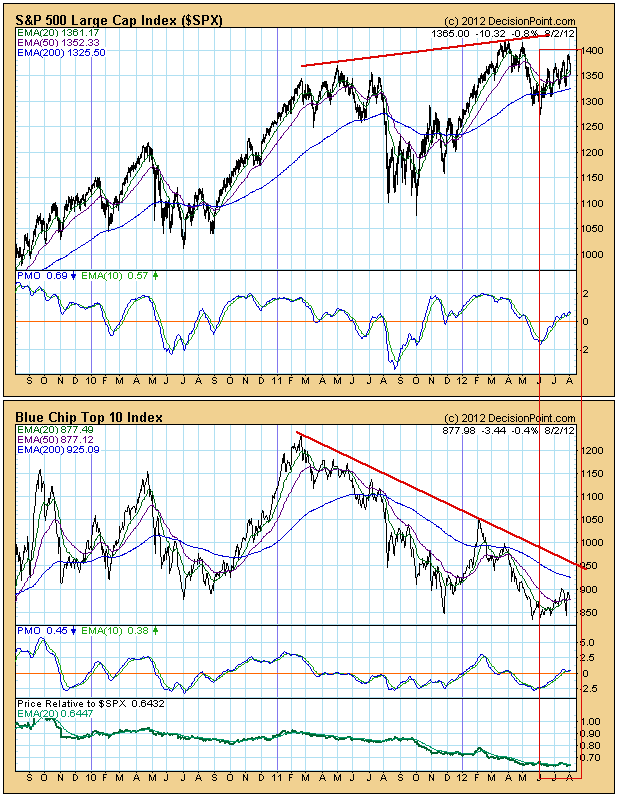
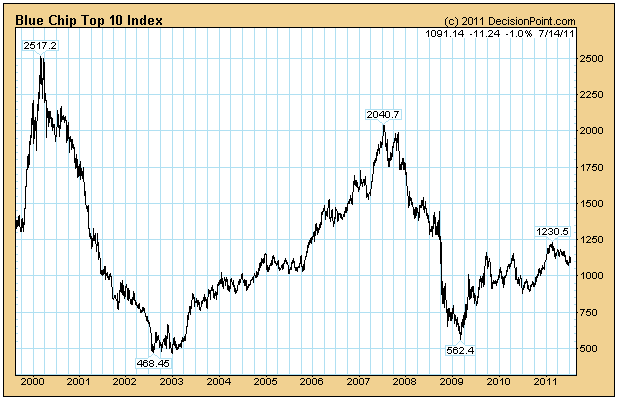
152 TOP 10 BLUE CHIP INDEX SHOWS UNHEALTHY MARKET
by Carl Swenlin,
President and Founder, DecisionPoint.com
Decision Point publishes a daily Tracker report of our 152 Blue Chip list. This list is composed of the stocks in the S&P 100 Index, the Dow 65, and some large-cap Nasdaq stocks. We also track the Top 10 stocks in ths list, ranked by relative strength measured...
READ MORE
MEMBERS ONLY
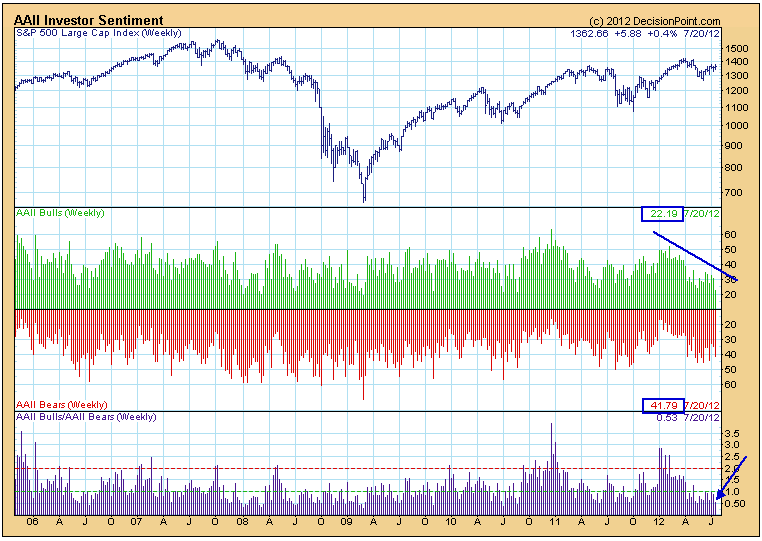
AAII INVESTOR SENTIMENT SHOWS A LOT OF BEARS
by Carl Swenlin,
President and Founder, DecisionPoint.com
Last week the Rydex Ratio was displaying very bullish sentiment, and that is still the case. In rather stark contrast AAII Investor Sentiment* (American Association of Individual Investors) reflects very bearish sentiment this week, with 22% bulls and 42% bears. The ratio of bears to bulls is 0.53.
These...
READ MORE
MEMBERS ONLY
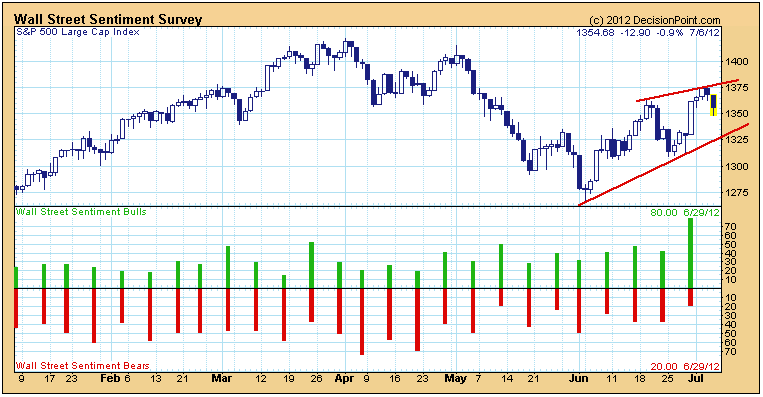
SENTIMENT CLIMAX
by Carl Swenlin,
President and Founder, DecisionPoint.com
The Wall Street Sentiment Survey* is unique in that the poll is taken on Friday after the market closes, and it asks participants for their forecast for the following week. This differs from other polls that take opinions through the week during periods when the market is active and changing....
READ MORE
MEMBERS ONLY
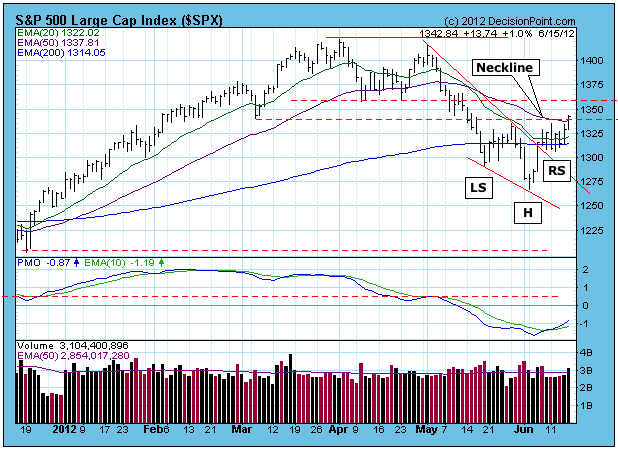
MIXED SIGNALS
by Carl Swenlin,
President and Founder, DecisionPoint.com
I have been expecting another short decline to finish out the right shoulders of a reverse head and shoulders pattern, but once again the Mr. Market said: "Expect whatever you like. I don't care."
My problem is that, being a person who likes things to be...
READ MORE
MEMBERS ONLY
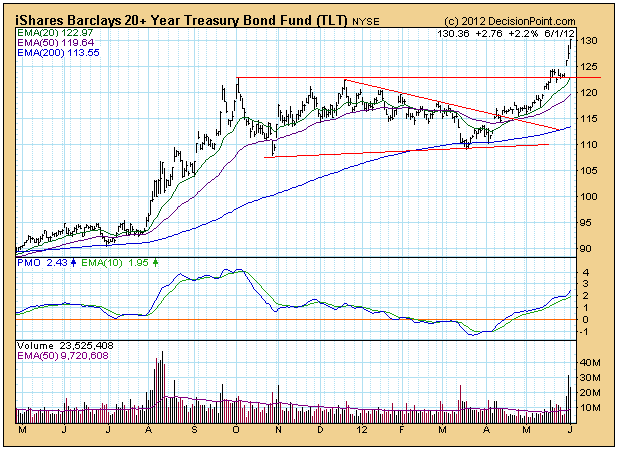
BONDS SOAR AS TLT MAKES NEW HIGH
by Carl Swenlin,
President and Founder, DecisionPoint.com
To be honest, the actual "soaring" for bonds began last July when bonds began an advance of about 33% in two months. After a five-month period of consolidation, another up leg advanced prices about 18% off the bottom of the trading range, making a total advance of about...
READ MORE
MEMBERS ONLY
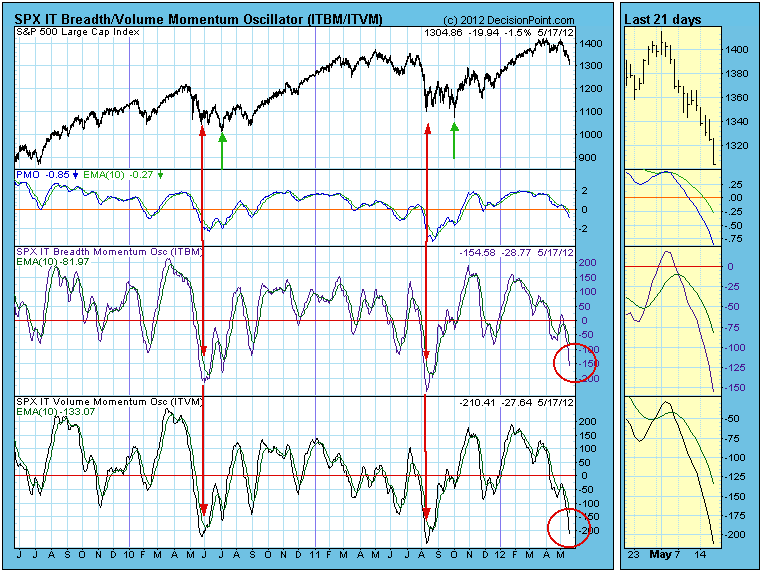
CORRECTION LOW MAY BE WEEKS AWAY
by Carl Swenlin,
President and Founder, DecisionPoint.com
The current correction is creating very oversold conditions on intermediate-term indicators, like the ITBM (breadth) and ITVM (volume). While oversold indicators often signal final price lows for a correction, extremely oversold readings are a sign that the price low for the correction probably won't arrive until weeks after...
READ MORE
MEMBERS ONLY
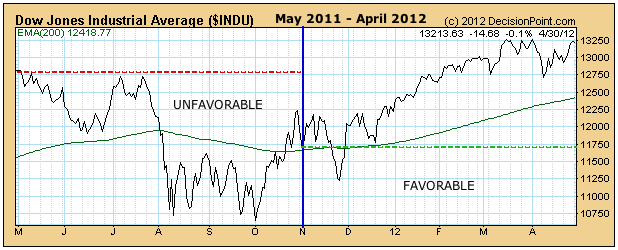
SIX-MONTH SEASONALITY TURNS UNFAVORABLE
by Carl Swenlin,
President and Founder, DecisionPoint.com
May 1 marked the beginning of a 6-month period of unfavorable seasonality. Research published by Yale Hirsch in the Trader's Almanac shows that the market year is broken into two six-month seasonality periods. From May 1 through October 31 seasonality is unfavorable, and the market most often finishes...
READ MORE
MEMBERS ONLY
SPY VERSUS SPX
by Carl Swenlin,
President and Founder, DecisionPoint.com
A subscriber brought something to my attention that I wish I had thought of before. We think (at least I did) that the SPY (ETF) and SPX (S&P 500 Index) perform pretty much the same except for some minor tracking error. However, this is not the case because...
READ MORE
MEMBERS ONLY
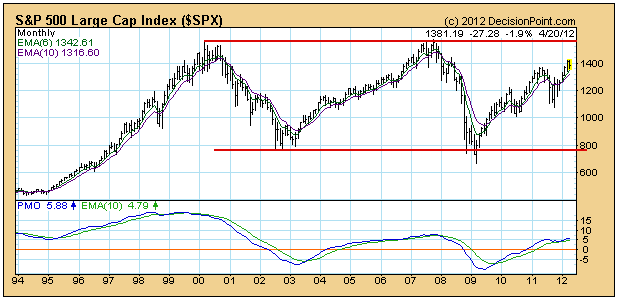
4-YEAR CYCLE APPROACHING CREST?
by Carl Swenlin,
President and Founder, DecisionPoint.com
We don't look at the 4-Year Cycle chart very often, but a subscriber's comments reminded me that now would be an excellent time to view the progress of this important cycle.
On the chart below the vertical lines show the location of all nominal 4-Year Cycle...
READ MORE
MEMBERS ONLY
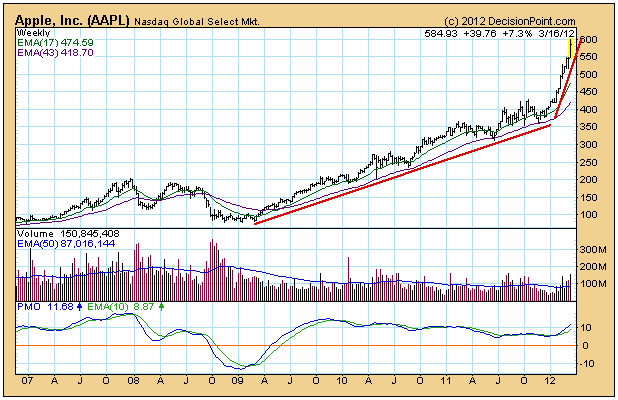
APPLE ENTERS DANGER PHASE
by Carl Swenlin,
President and Founder, DecisionPoint.com
Apple is a great company, and AAPL has been a great stock since early-2009. From that point to the end of 2011 it rose +300% in an orderly, relentless advance. The angle of the rising trend line was conservative and sustainable. Unfortunately, since the beginning of this year AAPL has...
READ MORE
MEMBERS ONLY
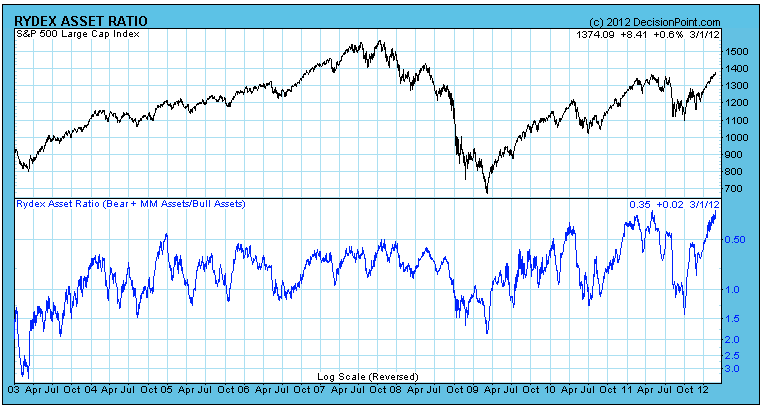
RYDEX ASSET LEVELS ARE BEARISH
by Carl Swenlin,
President and Founder, DecisionPoint.com
At Decision Point we keep a close watch on asset levels in the Rydex mutual fund group as a way of evaluating investor sentiment. An important result of these efforts is the Rydex Asset Ratio, which is calculated by dividing assets in the Bear plus Money Market Funds by the...
READ MORE
MEMBERS ONLY
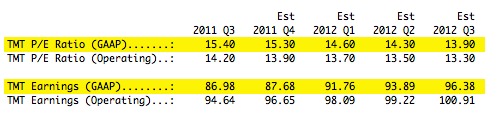
STOCKS ARE FAIRLY VALUED
by Carl Swenlin,
President and Founder, DecisionPoint.com
News headlines are usually more confusing than helpful, especially when trying to determine if stocks are overvalued, fairly valued, ot undervalued. At any given time there will be those who simultaneously claim that stocks overvalued and undervalued. Of course, they all have their own methodologies, which (surprise, surprise) support their...
READ MORE
MEMBERS ONLY
JURY DUTY, CRYSTAL BALLS AND BLACKJACK
by Carl Swenlin,
President and Founder, DecisionPoint.com
(THIS WEEK'S DECISION POINT ARTICLE WAS WRITTEN BY GUEST WRITER ERIN SWENLIN HEIM)
As many of you are aware, I've been doing my duty as a citizen of this great country by serving on a jury. It has been interesting, to say the least. The trial...
READ MORE
MEMBERS ONLY
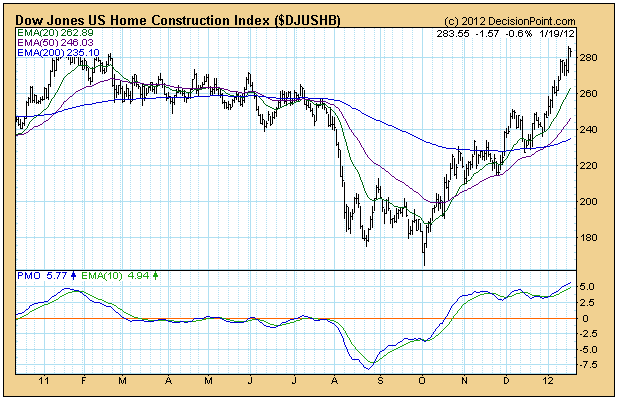
HOUSING RECOVERY?
by Carl Swenlin,
President and Founder, DecisionPoint.com
The market rally on Wednesday was driven in part by a surge in housing stocks, which was triggered by a favorable housing report. Since the fundamentals of the housing market are not too thrilling, regardless of short-term gains, my curiosity was piqued and I pulled up some charts.
The daily...
READ MORE
MEMBERS ONLY
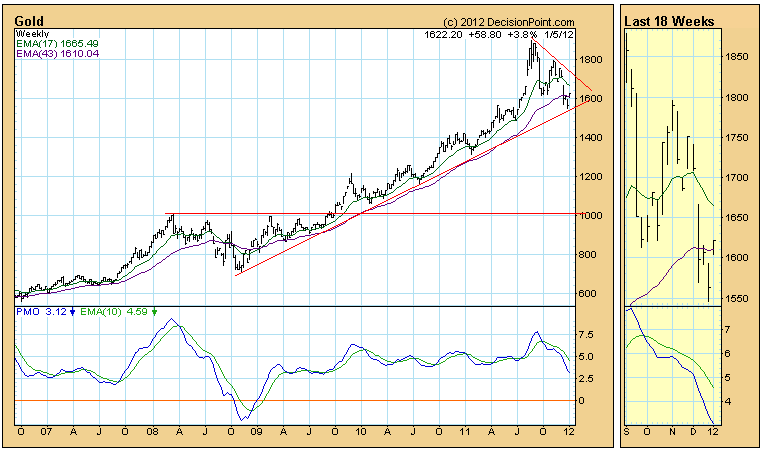
A TIMELY BOUNCE FOR GOLD
by Carl Swenlin,
President and Founder, DecisionPoint.com
After reaching an all-time high in August, gold has corrected about -18%, but a recent bounce prompts us to take a closer look to see if the correction could be over. The most encouraging technical evidence is on the weekly chart.
Note how the recent low occurred just above the...
READ MORE
MEMBERS ONLY
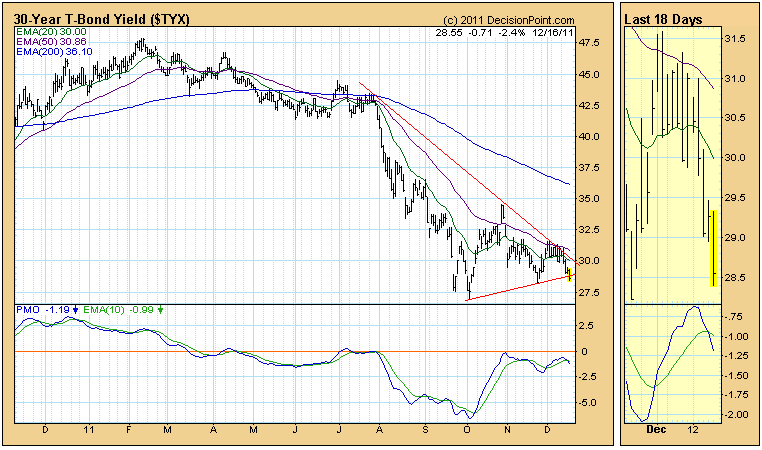
LONG-BOND YIELD: HOW LOW CAN IT GO?
by Carl Swenlin,
President and Founder, DecisionPoint.com
The 30-year bond yield has dropped below three percent many times this year, dropping as low as 2.694% in October. It has been trending up since then, but today it looks as if the October low could be retested.
On the daily bar chart below we can see that...
READ MORE
MEMBERS ONLY
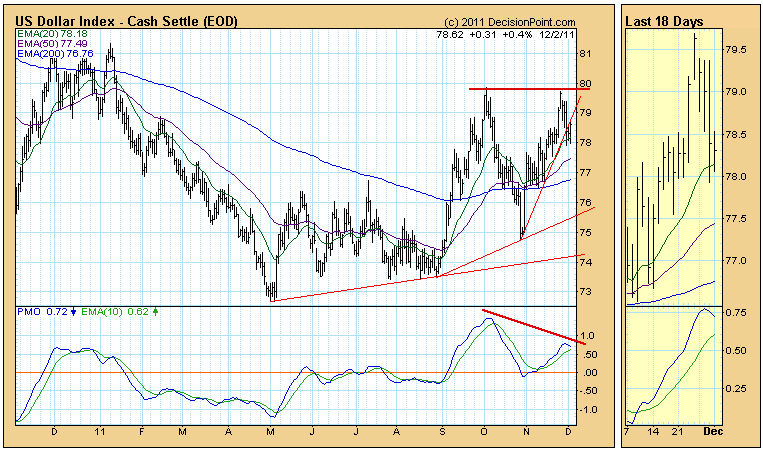
DOLLAR STARTING DOUBLE TOP?
by Carl Swenlin,
President and Founder, DecisionPoint.com
The US Dollar Index appears to be setting up for a medium-term double top. This week it broke down through a short-term rising trend line drawn from the October low after reaching a level equal to the October top. The PMO made a lower top, creating a negative divergence.
The...
READ MORE
MEMBERS ONLY
ULTRA-SHORT-TERM CLIMAXES ATTRACT ATTENTION
by Carl Swenlin,
President and Founder, DecisionPoint.com
On Thursday the S&P 500 broke down from a triangle formation, which is a kind of continuation pattern. Continuation patterns are so named because, when the pattern ends, prices are normally expected to continue in the direction they were trending before the continuation pattern (consolidation) began. In this...
READ MORE
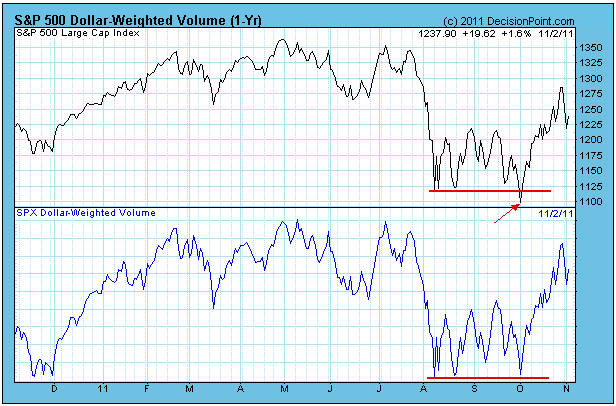
MEMBERS ONLY
DOLLAR-WEIGHTED VOLUME
by Carl Swenlin,
President and Founder, DecisionPoint.com
Over 10 years ago I developed an indicator called Dollar-Weighted Volume (DWV). It could be that I reinvented the wheel, but I am not aware of anyone else who uses this indicator. DWV is variation of On-Balance Volume (OBV), which was developed by Joe Granville. DWV is calculated by multiplying...
READ MORE
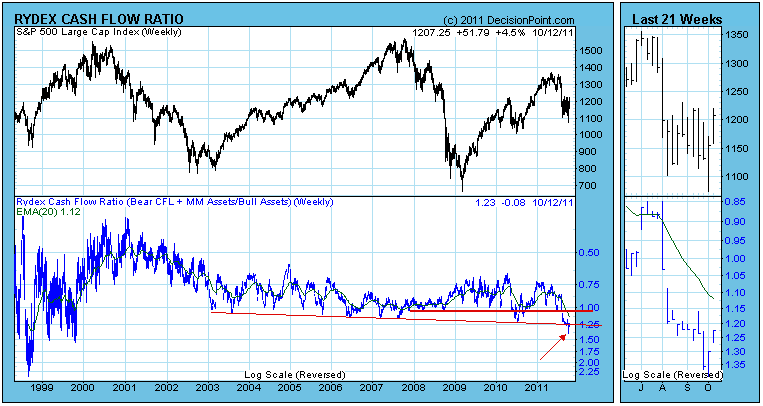
MEMBERS ONLY
RYDEX CASH FLOW RATIO OVERSOLD
by Carl Swenlin,
President and Founder, DecisionPoint.com
One of the ways we have of measuring sentiment is by tracking cash flow into and out of Rydex mutual funds through the use of our Rydex Cash Flow Ratio. The Ratio is calculated by dividing cumulative cash flow (CCFL) of Bear funds plus Money Market funds by the CCFL...
READ MORE
MEMBERS ONLY
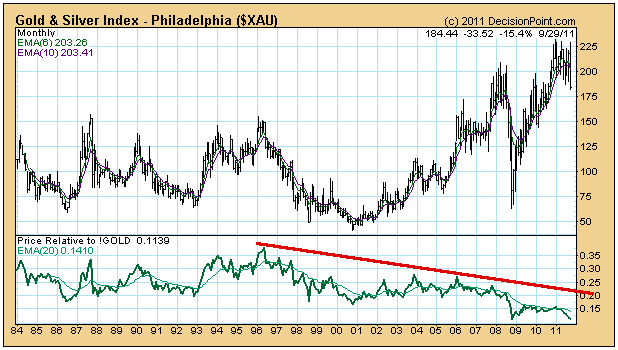
GOLD MINING STOCKS VERSUS GOLD
by Carl Swenlin,
President and Founder, DecisionPoint.com
QUESTION: Carl, I have read a lot of articles recently indicating gold miner stocks should go up and outpace gold. So far nothing but a drop in goldminers. Would it be possible for you to show charts of GDX and GDXJ with your comments on one of your daily posts?...
READ MORE
MEMBERS ONLY
GOLD DOUBLE TOP: START OF CORRECTION?
by Carl Swenlin,
President and Founder, DecisionPoint.com
In the last month or so gold has formed a double top that could be the start of a much needed correction for the metal.
Specifically the chart below shows an Adam & Eve double top. The first top is sharp and spiky, and the second is more rounded, depicting...
READ MORE
MEMBERS ONLY
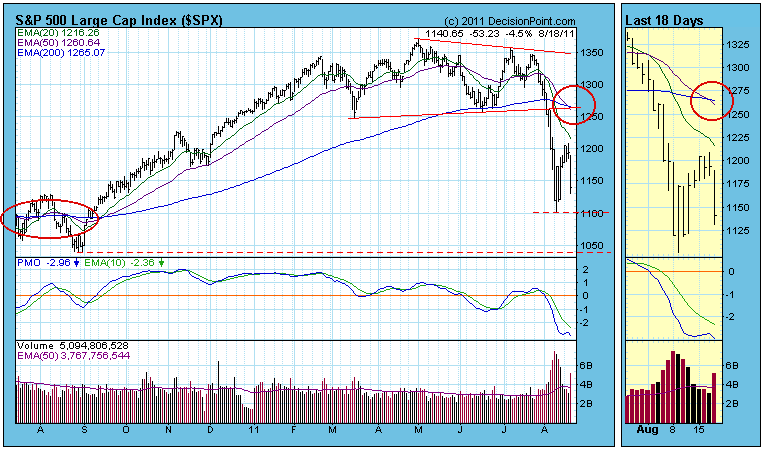
BEAR MARKET RULES APPLY
by Carl Swenlin,
President and Founder, DecisionPoint.com
It is a concept that we stress on a periodic basis, and we got another illustration this week. Technical indicators must be interpreted within the context of the overall market trend.
On August 17 the S&P 500 Index 50-EMA crossed down through the 200-EMA, declairing by our definition...
READ MORE
MEMBERS ONLY
LONG-TERM SELL SIGNALS
by Carl Swenlin,
President and Founder, DecisionPoint.com
On 8/2/2011 our mechanical Thrust/Trend Model generated a medium-term NEUTRAL signal for the S&P 500 Index just in time to avoid the market break on 8/4. (Neutral means to be market neutral -- in cash or fully hedged.) After the breakdown we believed we...
READ MORE
MEMBERS ONLY
FINDING VOLUME
by Carl Swenlin,
President and Founder, DecisionPoint.com
READER COMMENT: I have written to you before regarding your comments on volume ("where is the volume?") which imply that volume "confirms" a move. To me, like many others, volume no longer means anything, or at least not what it used to mean.
See the recent...
READ MORE
MEMBERS ONLY
BULL MARKET HAS WEAK LEADERSHIP
by Carl Swenlin,
President and Founder, DecisionPoint.com
While this bull market has rallied +105% from the 2009 low (basis the S&P 500), I have had a sense that there was something "squishy" about it. One thing was the absence of convincing volume, something analysts have been complaining about since the bull market began....
READ MORE
MEMBERS ONLY
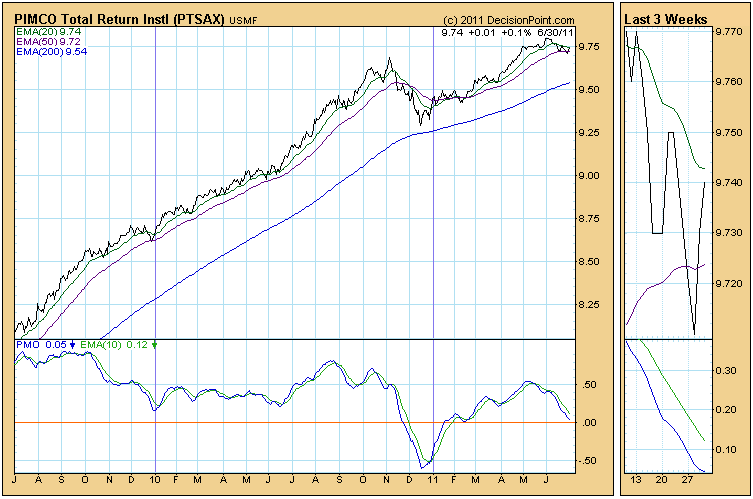
QUESTION ABOUT DISTRIBUTIONS AND THE TREND MODEL
by Carl Swenlin,
President and Founder, DecisionPoint.com
QUESTION: Carl, is it okay to use the Trend Model on bond fund NAV's to manage risk, or is it inappropriate because you can't factor in monthly payouts? I own PTSAX, Bill Gross' total return investor class bond fund, and it looks like the 20-EMA...
READ MORE
MEMBERS ONLY
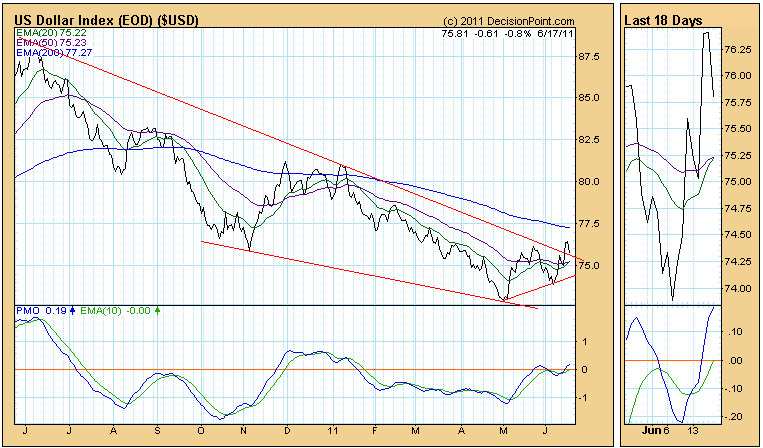
WHAT'S "UUP" WITH THE DOLLAR
by Carl Swenlin,
President and Founder, DecisionPoint.com
While the U.S. Dollar Index didn't do so well Friday, it is getting ready to generate a Trend Model buy signal. Note on the chart below that the 20-EMA is less than a hair away from crossing up through the 50-EMA, which will mechanically generate the buy...
READ MORE