MEMBERS ONLY
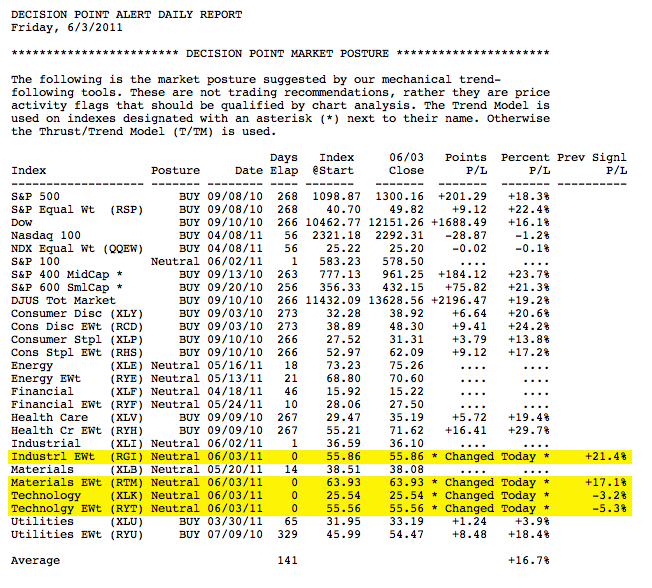
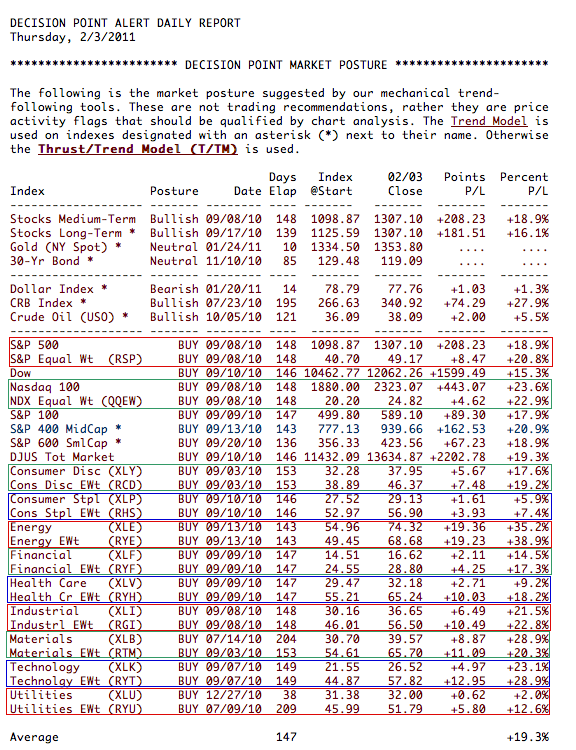
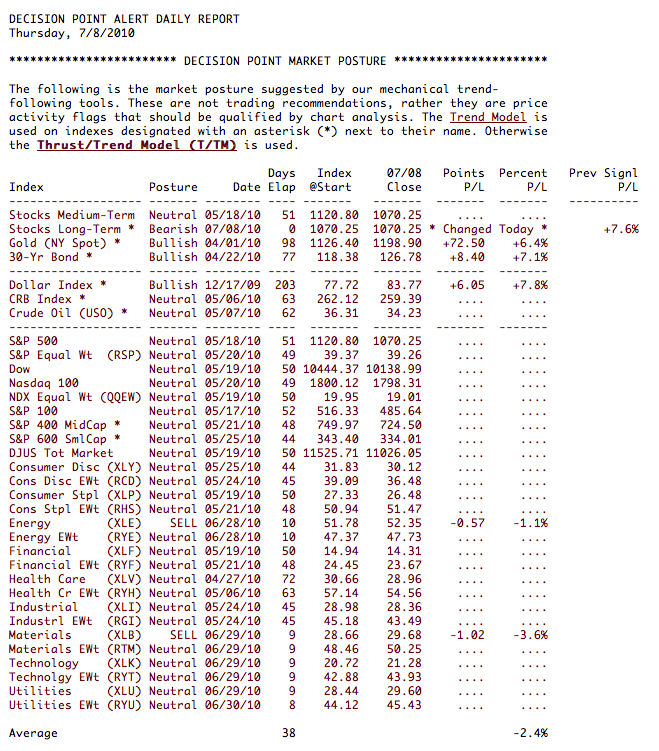
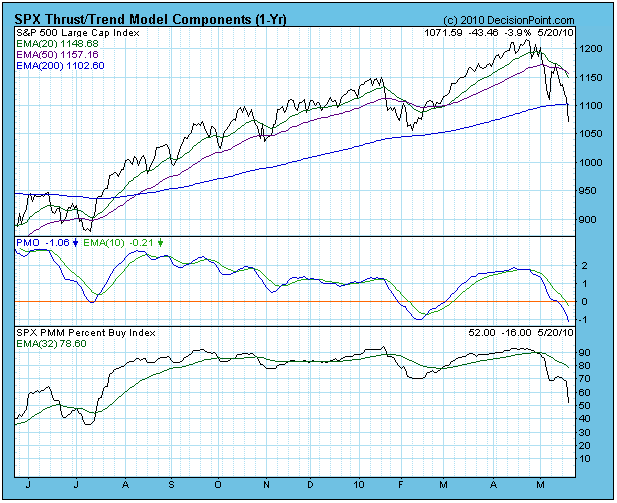
TIMING SIGNALS SHOW MARKET WEAKENING
by Carl Swenlin,
President and Founder, DecisionPoint.com
For over three months the market has been chopping around and making very little progress. In the process internals have been weakening, a fact that is reflected in the signal table below. In our Decision Point Alert Daily Report we track mechanical timing signals on 27 market and sector indexes....
READ MORE
MEMBERS ONLY
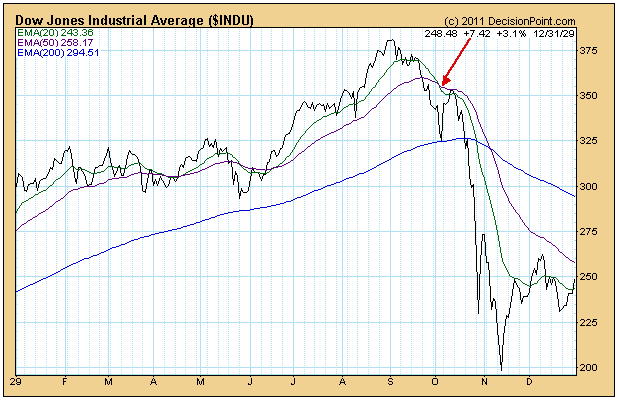
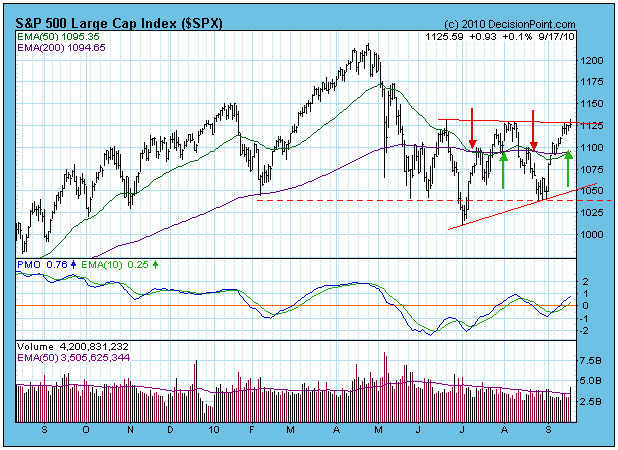
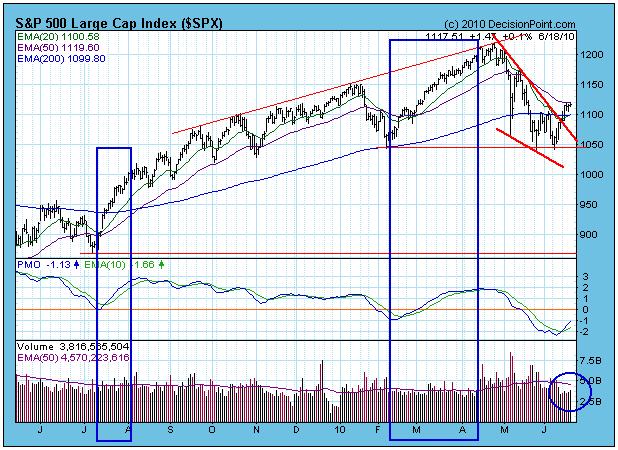
POSSIBLE MARKET TOP
by Carl Swenlin,
President and Founder, DecisionPoint.com
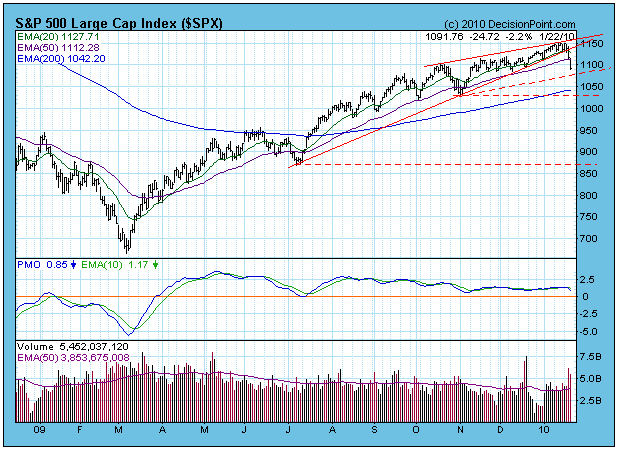
A reader recently called me a perma-bull, which is amusing, since by nature I'm usually disposed toward bearishness. I will, however, remain bullish until our mechanical timing model switches from a buy. The model will be bullish until the 20-EMA for the S&P 500 crosses down...
READ MORE
MEMBERS ONLY
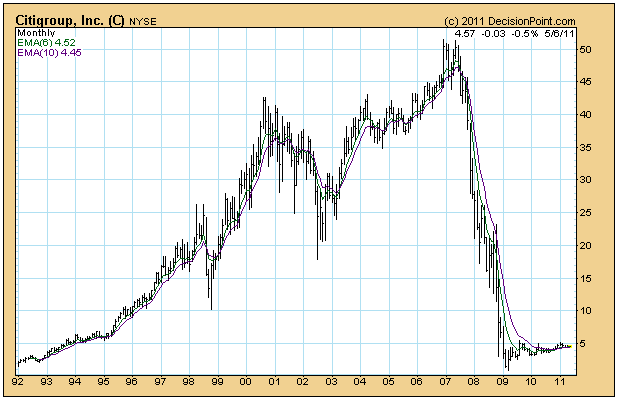
CITIGROUP 10-FOR-1 REVERSE SPLIT
by Carl Swenlin,
President and Founder, DecisionPoint.com
On Monday, May 9, Citigroup (C) stock will undergo a 10-for-1 reverse split. What this means is that 10 shares of C will be merged into one share, and holders of C will own one-tenth as many shares, but each share will be worth ten times the value of pre-split...
READ MORE
MEMBERS ONLY
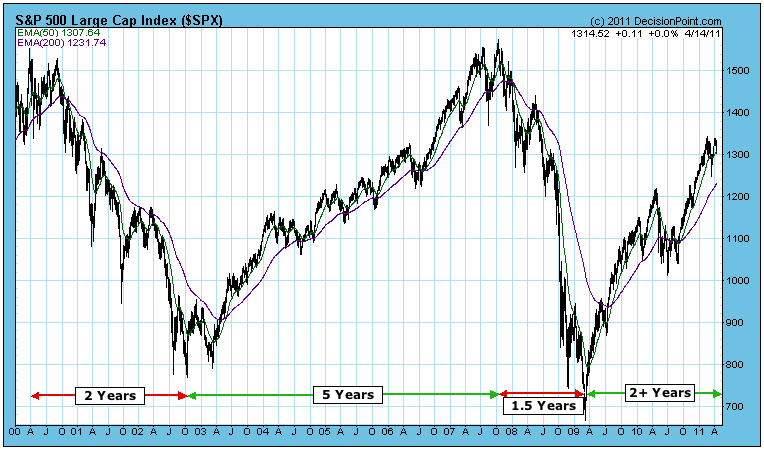
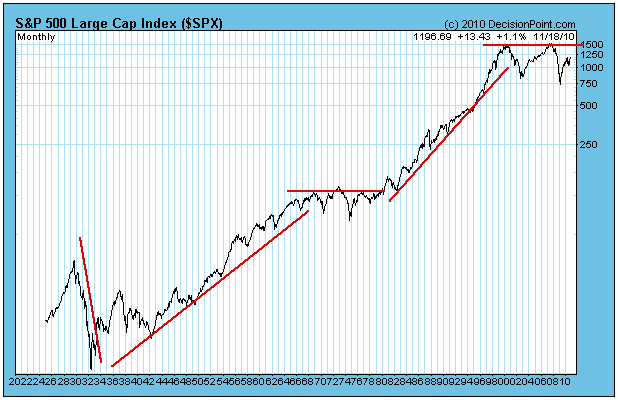
AGING BULL
by Carl Swenlin,
President and Founder, DecisionPoint.com
It is a rule-of-thumb that the average bull/bear cycle lasts about four years trough to trough -- 2.5 years of bull market followed by 1.5 years of bear market. Like most of these kinds of rules, it is good to keep them in mind, but don'...
READ MORE
MEMBERS ONLY
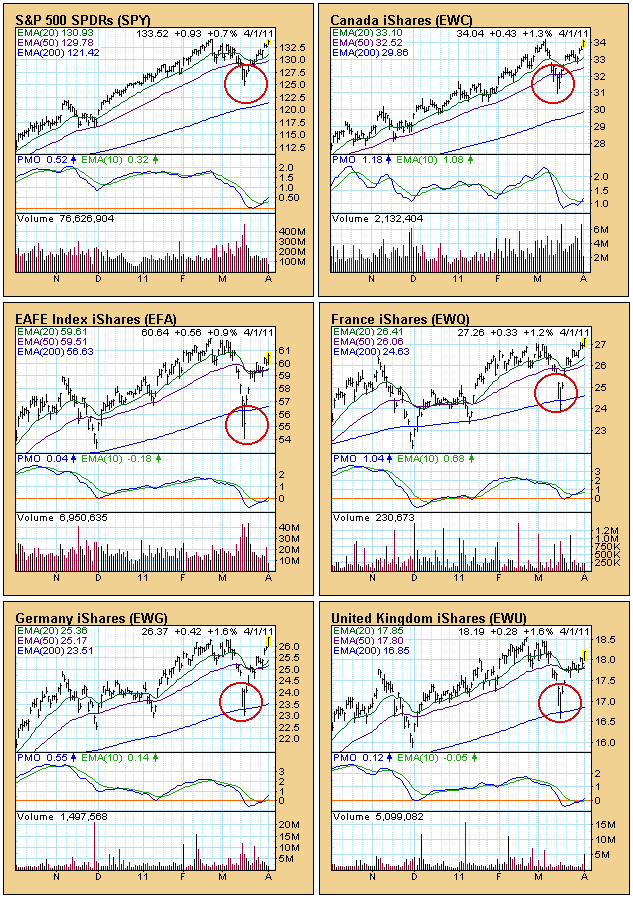
GLOBAL MARKETS ENHANCE PERSPECTIVE
by Carl Swenlin,
President and Founder, DecisionPoint.com
(This is an excerpt from Friday's blog for Decision Point subscribers.)
If nature abhors a vacuum, technicians abhor "V" bottoms. Once prices bounced out of the March lows, the technical expectation was that, after a week or two of rally, prices would turn down again and...
READ MORE
MEMBERS ONLY
PREPARING FOR THE "BANG!"
by Carl Swenlin,
President and Founder, DecisionPoint.com
(This is an excerpt from Friday's blog for Decision Point subscribers.)
My wife is something of an insomniac, so she listens to a lot of nighttime talk shows -- not the best cure for insomnia, I'll bet. Recently she told me about the comments of some...
READ MORE
MEMBERS ONLY
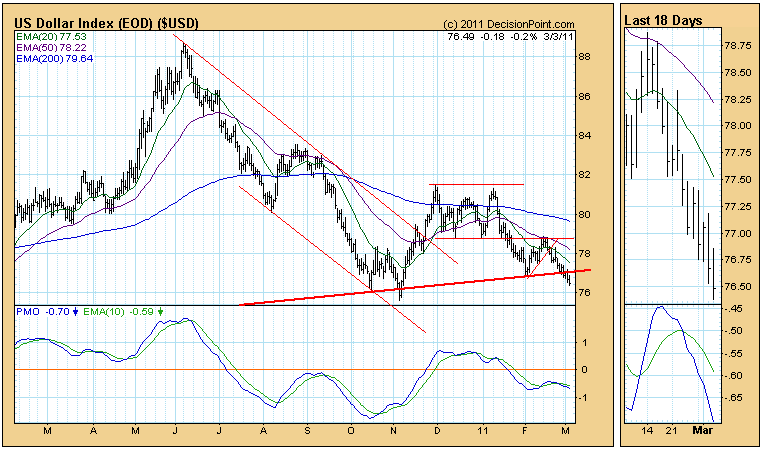
DOLLAR INDEX BREAKING DOWN AGAIN
by Carl Swenlin,
President and Founder, DecisionPoint.com
(This is an excerpt from Friday's blog for Decision Point subscribers.)
The U.S. Dollar Index is in immediate danger again, so lets take a close look at charts from all three time frames, beginning with the daily bar chart. The most important feature on the chart is...
READ MORE
MEMBERS ONLY
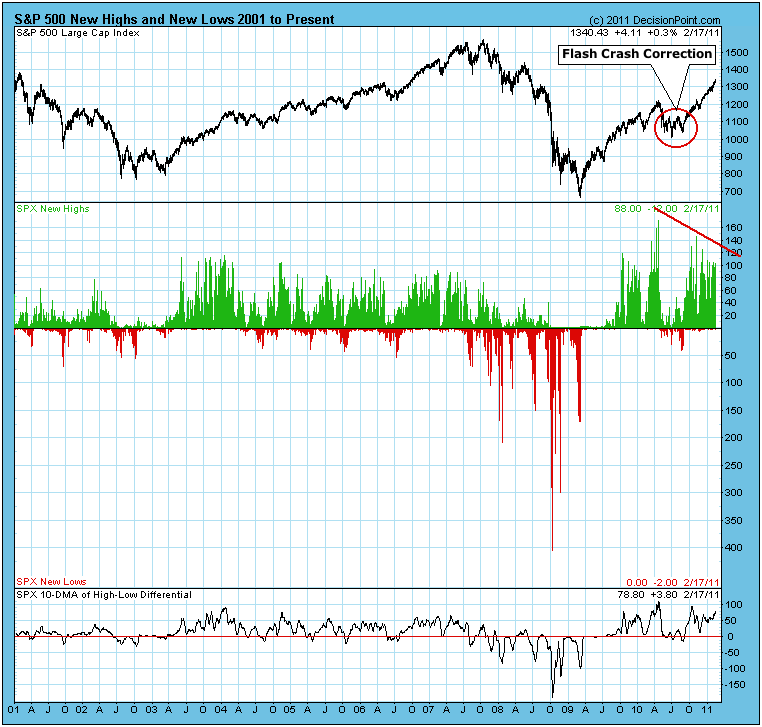
S&P 500 NEW HIGHS
by Carl Swenlin,
President and Founder, DecisionPoint.com
The daily number of New Highs and New Lows (NHNL) refers to stocks reaching their highest or lowest price during the most recent 52-week period. Below is a NHNL chart for the stocks that compose the S&P 500 Index, and we can learn a few things from it....
READ MORE
MEMBERS ONLY
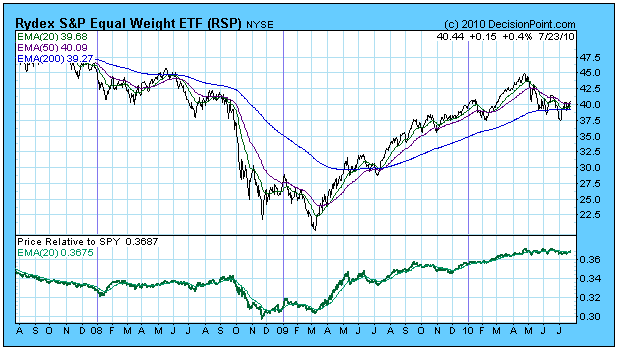
EQUAL-WEIGHT INDEXES STILL LEADING
by Carl Swenlin,
President and Founder, DecisionPoint.com
(This is an excerpt from Monday's blog for Decision Point subscribers.)
One of the things I constantly flog in this blog is that equal-weight indexes usually perform better than cap-weighted indexes. The reason they perform better is that smaller-cap stocks normally perform better than large-cap stocks, and the...
READ MORE
MEMBERS ONLY
WHY THE MARKET IS WRONG
by Carl Swenlin,
President and Founder, DecisionPoint.com
In my business I am exposed to the writings of a lot of really smart people, and it is never hard to find a few who are trying to explain to us why the market is wrong. The market is wrong, of course, because it has blithely gone its merry...
READ MORE
MEMBERS ONLY
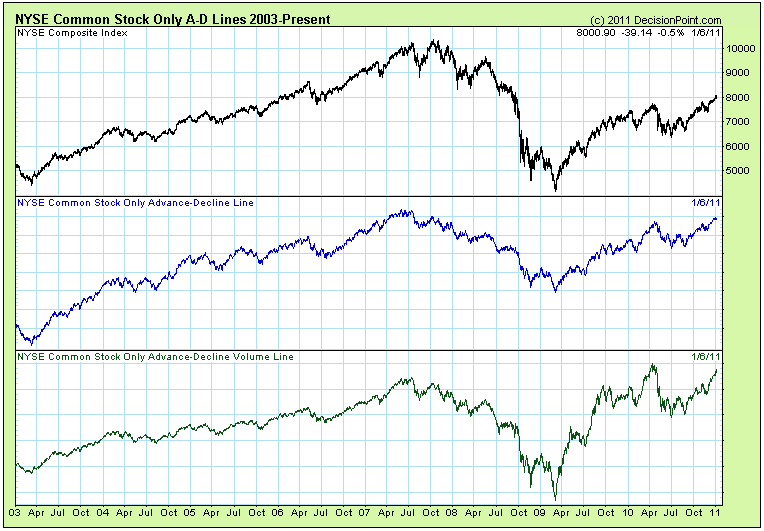
NYSE Common Stock Only Indicators
by Carl Swenlin,
President and Founder, DecisionPoint.com
QUESTION FROM READER: I've been noticing some anomalous behavior in the NYSE Advance-Decline data and other indicators based on NYSE data that does not match up with other measures of breadth. I've read comments from other authors on numerous occasions that refer to the same problem...
READ MORE
MEMBERS ONLY
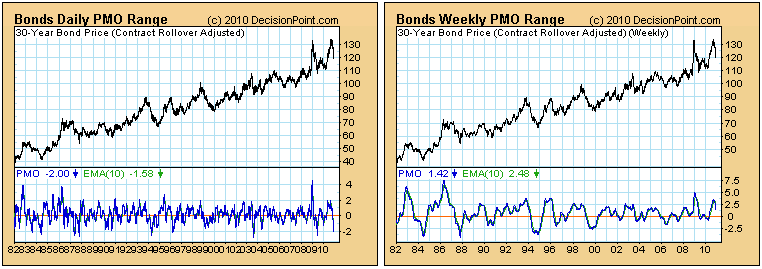
WHEN WILL BONDS BOTTOM?
by Carl Swenlin,
President and Founder, DecisionPoint.com
Bonds are in a "waterfall" decline, and some people are beginning to wonder where the bottom will be. A subscriber comments: "I'm always anxious to see the reaction time of the DP Trend Model as compared to what I look for in the momentum of...
READ MORE
MEMBERS ONLY
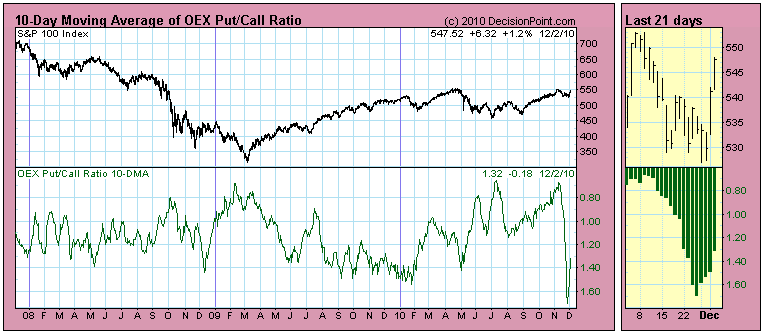
OEX PUT/CALL RATIO - WHAT'S GOING ON?
by Carl Swenlin,
President and Founder, DecisionPoint.com
Last week some subscribers asked me what was going on with the OEX Put/Call Ratio. You can see on the 10-Day Moving Average chart that it took a sharp dive off the November price top. (Actually the ratio reading went higher, but we reverse the scale to make oversold...
READ MORE
MEMBERS ONLY
SECULAR STATUS
by Carl Swenlin,
President and Founder, DecisionPoint.com
According to our mechanical timing models, as well as my conclusions through visual analysis, we are in a bull market, a cyclical bull market, which refers to the bull/bear cycle that occurs about every four years. A subscriber wanted to know if we were also in a secular bull...
READ MORE
MEMBERS ONLY
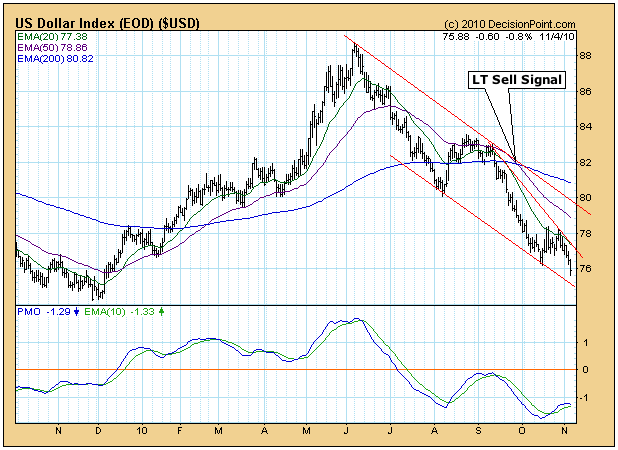
US DOLLAR INDEX BREAKS LONG-TERM SUPPORT
by Carl Swenlin,
President and Founder, DecisionPoint.com
(This is an excerpt from Friday's blog for Decision Point subscribers.)
As of 7/14/2010 the US Dollar has been on a Trend Model NEUTRAL signal, and it has been in a bear market since the end of September when the 50-EMA crossed down through the 200-EMA....
READ MORE
MEMBERS ONLY
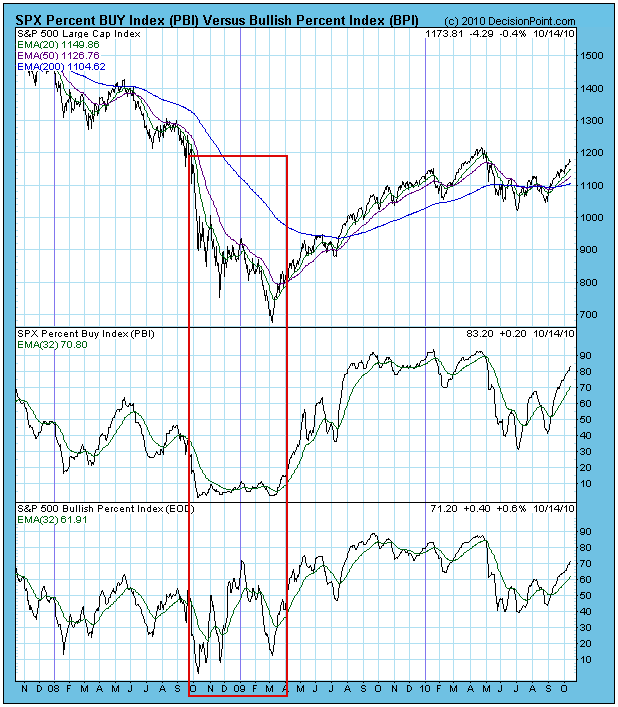
PERCENT BUY INDEX VS. BULLISH PERCENT INDEX
by Carl Swenlin,
President and Founder, DecisionPoint.com
A subscriber had some questions about the Percent Buy Index (PBI) versus the Bullish Percent Index (BPI). The PBI is my creation, and it tracks the percentage of Price Momentum Model (PMM) buy signals for the components in a given index. (In the case of this discussion we will be...
READ MORE
MEMBERS ONLY
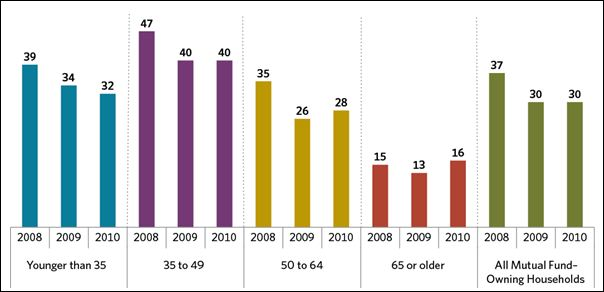
RISK TOLERANCE STILL DOWN
by Carl Swenlin,
President and Founder, DecisionPoint.com
According to the Investment Company Institute Annual Mutual Fund Shareholder Tracking Survey, shareholders' willingness to take "substantial or above average risk" has not recovered since the beginning of the financial crisis started in 2008. (Click here to read the entire article.) The chart below shows that there...
READ MORE
MEMBERS ONLY
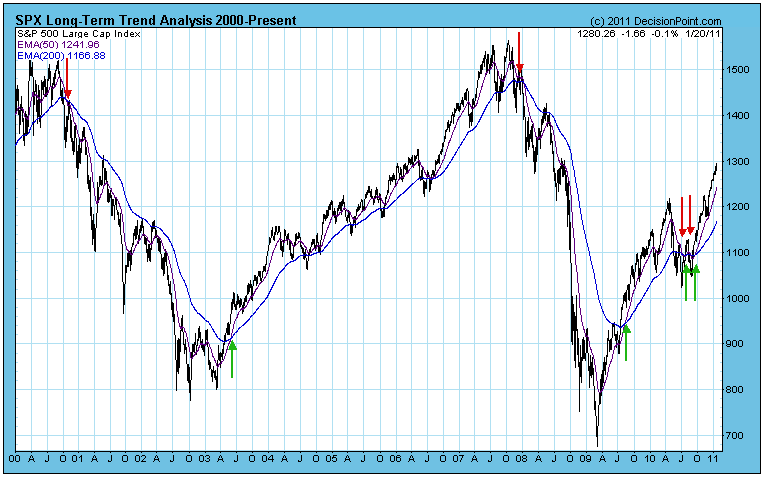
NEW LONG-TERM BUY SIGNAL
by Carl Swenlin,
President and Founder, DecisionPoint.com
Today another long-term buy signal was generated when the S&P 500 Index 50-EMA crossed up through the 200-EMA. Normally, we have high confidence in these signals, but, unfortunately, the long-term model has generated four, count 'em, four "long-term" signals in less than three months. On...
READ MORE
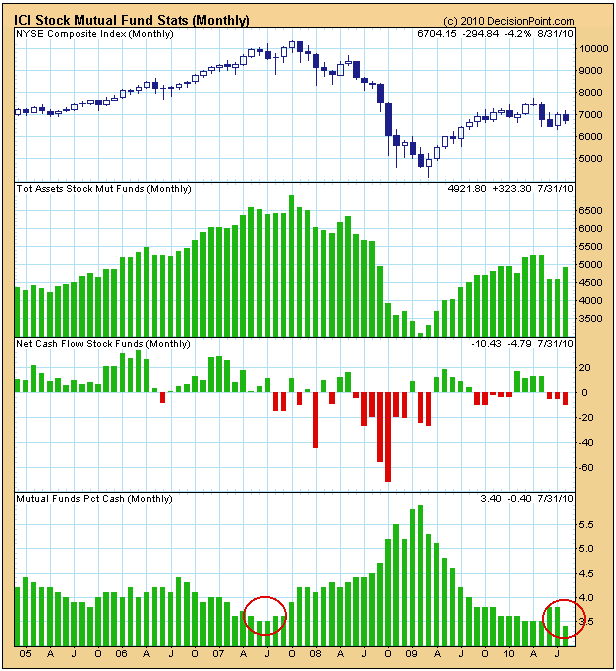
MEMBERS ONLY
ICI MUTUAL FUND STATISTICS
by Carl Swenlin,
President and Founder, DecisionPoint.com
The Investment Company Institute (ici.org) compiles statistics on mutual funds and publishes them monthly. (There is a one month delay between the end of the month being reported and publication.) Decision Point has been collecting these data for almost five years, and we finally have enough to start charting...
READ MORE
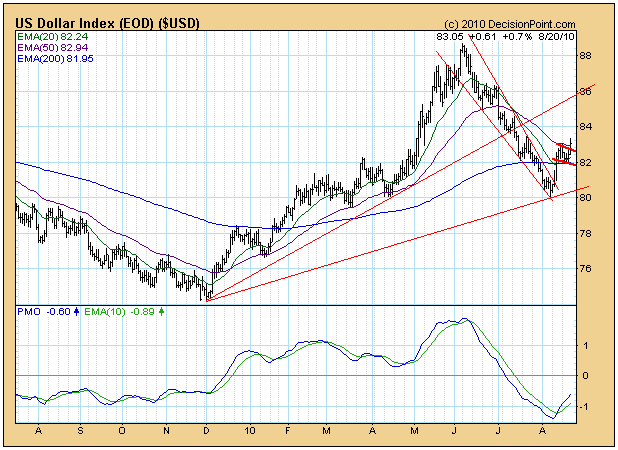
MEMBERS ONLY
US DOLLAR RALLIES
by Carl Swenlin,
President and Founder, DecisionPoint.com
Looking at a weekly chart of the U.S. Dollar Index we can see that it entered a steep correction off the June top when it encountered long-term resistance from a declining tops line reaching back to 2006. During the correction a rising trend line drawn from the December 2009...
READ MORE
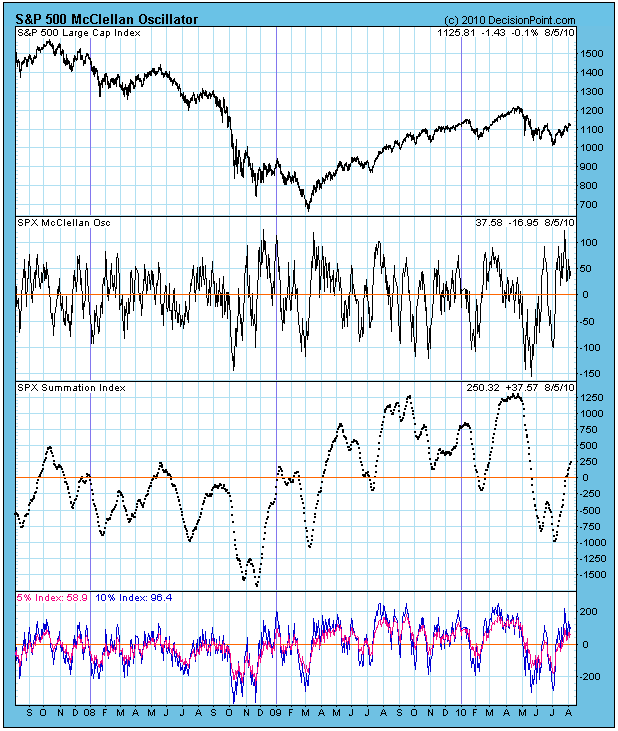
MEMBERS ONLY
McClellan Oscillator Is Positive
by Carl Swenlin,
President and Founder, DecisionPoint.com
The McClellan Oscillator chart could be voted one of the most likely charts to cause the glazing over of multitudes of eyeballs; however, with a little effort you can understand it and appreciate the wealth of information it conveys. Take a moment and read and let the following paragraph sink...
READ MORE
MEMBERS ONLY
MONITORING EQUAL-WEIGHT INDEXES
by Carl Swenlin,
President and Founder, DecisionPoint.com
We have added a new page of charts to help us monitor the relative strength of equal-weighted indexes against their capitalization-weighted counterparts. Cap-weighted index values are dominated by the larger-cap stocks in the index. For example, the 50 largest-cap stocks in the S&P 500 represent about 70% of...
READ MORE
MEMBERS ONLY
NEW LONG-TERM SELL SIGNAL GENERATED
by Carl Swenlin,
President and Founder, DecisionPoint.com
As you can see in our Decision Point Alert Daily Report below our Trend Model has triggered a Long-Term SELL signal for stocks. This occurs when the 50-EMA crosses below the 200-EMA. It has been headed this direction for quite some time so it is not unexpected. Note on the...
READ MORE
MEMBERS ONLY
THE VOLUME ISSUE
by Carl Swenlin,
President and Founder, DecisionPoint.com
One of the issues that has concerned many analysts is the lack of volume supporting the rally from the June lows, but looking back over the last year we can see that volume has not been at all impressive for either of the rallies beginning in July 2009 or February...
READ MORE
MEMBERS ONLY
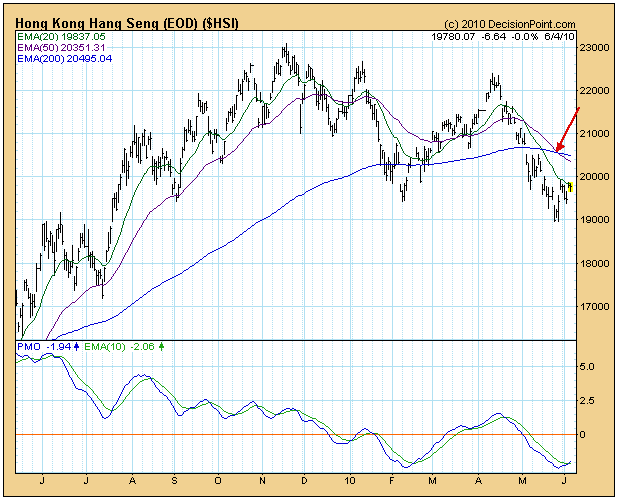
A REVIEW OF GLOBAL MARKETS
by Carl Swenlin,
President and Founder, DecisionPoint.com
A question from a subscriber yesterday prompted me to make a quick review of global markets. I rarely look at global markets because (1) my overriding focus is on the U.S. market and (2) it is my observation that international markets and the U.S. market tend to run...
READ MORE
MEMBERS ONLY
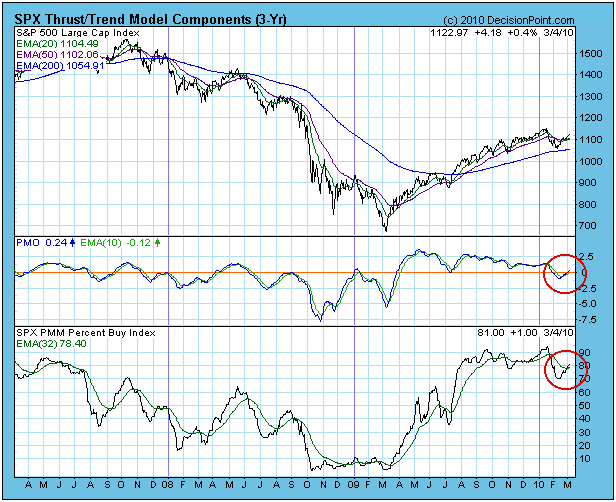
WHERE'S THE SELL SIGNAL?
by Carl Swenlin,
President and Founder, DecisionPoint.com
With the market in a dizzying decline, some of our subscribers are wondering why our market posture is only neutral. Where's the sell signal? The short answer is that the Thrust/Trend Model (T/TM) can only give a intermediate-term neutral signal if the long-term signal is still...
READ MORE
MEMBERS ONLY
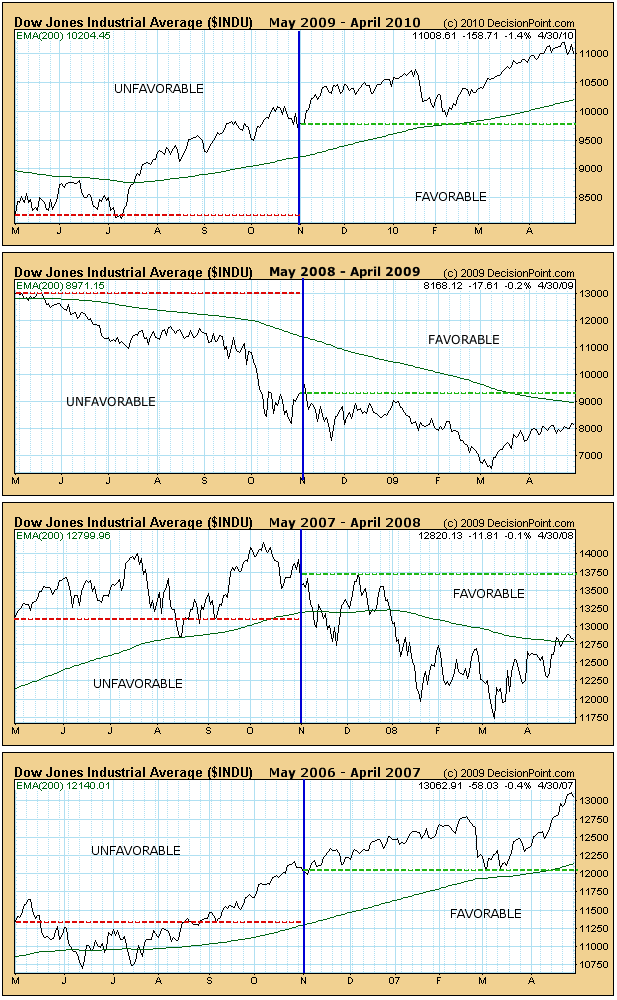
6-MONTH SEASONALITY GOING NEGATIVE
by Carl Swenlin,
President and Founder, DecisionPoint.com
SIX-MONTH SEASONALITY: Research published by Yale Hirsch in the Trader's Almanac shows that the market year is broken into two six-month seasonality periods. From May 1 through October 31 is seasonally unfavorable, and the market most often finishes lower than it was at the beginning of the period....
READ MORE
MEMBERS ONLY
BREAKOUT FAILS
by Carl Swenlin,
President and Founder, DecisionPoint.com
STOCKS: Based upon a 3/1/2010 Thrust/Trend Model buy signal, our current intermediate-term market posture for the S&P 500 is bullish. The long-term component of the Trend Model is on a buy signal as of 8/11/2009.
On Wednesday the S&P 500 broke...
READ MORE
MEMBERS ONLY
MORE NORMAL EARNINGS PICTURE
by Carl Swenlin,
President and Founder, DecisionPoint.com
S&P has still not finalized 2009 Q4 earnings, but 99% of companies have reported, and I want to get the most current earnings picture out there, so I have updated our database to TMT earnings as of Q4 2009. This causes the horrible Q4 2008 numbers to drop...
READ MORE
MEMBERS ONLY
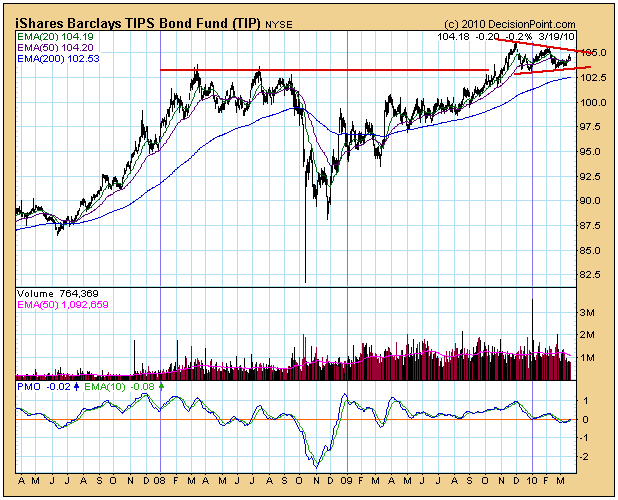
A TIP ON TIPS
by Carl Swenlin,
President and Founder, DecisionPoint.com
TIPS are bonds that provide inflation protection. While Erin covered this subject in yesterday's blog, I wanted to cover it with a little more depth and from a somewhat different perspective. Our default "first look" charts are usually set for one year, but I personally like...
READ MORE
MEMBERS ONLY
THRUST/TREND BUY SIGNAL FOR S&P 500
by Carl Swenlin,
President and Founder, DecisionPoint.com
Looking at the S&P 500, a new Thrust/Trend buy signal was generated on Monday, changing from a neutral stance. Specifically, the signal was generated by the PMO (Price Momentum Oscillator) and PBI (Percent Buy Index) crossing up through their EMAs. The Thrust Component signal was confirmed later...
READ MORE
MEMBERS ONLY
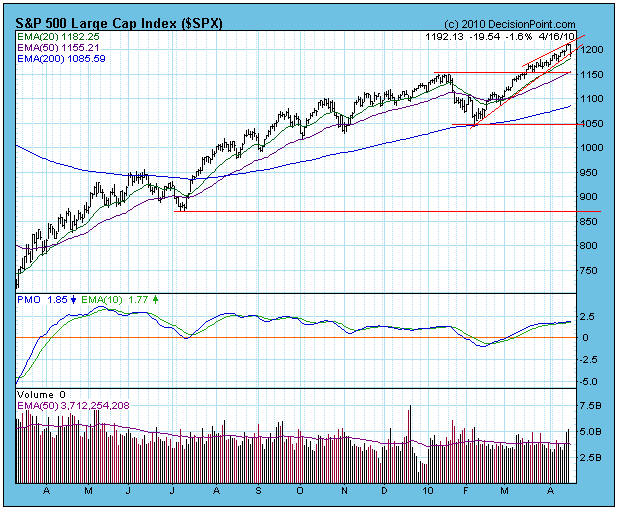
POSSIBLE BULL TRAP
by Carl Swenlin,
President and Founder, DecisionPoint.com
Last week we were looking at a bearish reverse flag formation, but this week prices broke above a short-term declining trend line, effecting a bullish resolution of the flag and changing the short-term outlook to bullish. This was confirmed by a PMO (Price Momentum Oscillator) buy signal, generated as the...
READ MORE
MEMBERS ONLY
CHANGED TO NEUTRAL POSTURE
by Carl Swenlin,
President and Founder, DecisionPoint.com
On Thursday our mechanical Thrust/Trend Model changed from a buy to neutral, based upon the 20-EMA crossing down through the 50-EMA. Now our hope is that there will be enough continuing decline to cover what may turn out to be a whipsaw signal. No guarantees in that regard, but...
READ MORE
MEMBERS ONLY
FINALLY A BREAKDOWN
by Carl Swenlin,
President and Founder, DecisionPoint.com
The S&P 500 has finally decisively broken down through the support formed by the rising trend line that marks the bottom of the ascending wedge formation. This was the technical expectation, but the market sure did fight it. The break has also carried the price index through the...
READ MORE
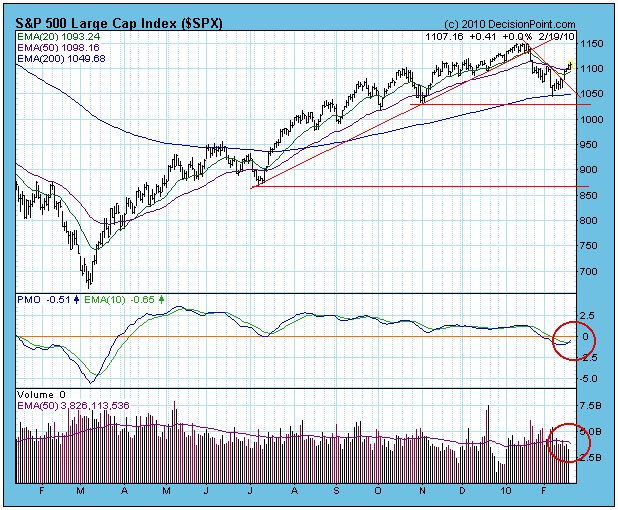
MEMBERS ONLY
STILL NO DECISIVE MOVE
by Carl Swenlin,
President and Founder, DecisionPoint.com
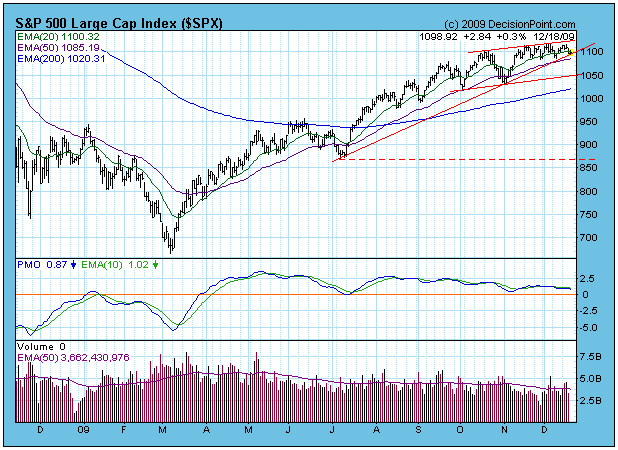
One would think, after a three-week hiatus, that there would be plenty to write about the market. But there isn't. The S&P 500 has drifted higher in an ever-narrowing ascending wedge pattern, making little progress. Since the mid-October top, the S&P 500 has only...
READ MORE
MEMBERS ONLY
ANALYSIS OF THREE TIME FRAMES
by Carl Swenlin,
President and Founder, DecisionPoint.com
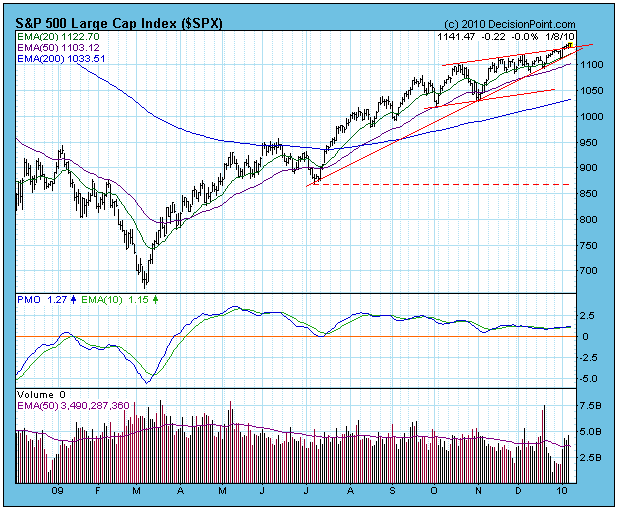
Since this will be our last article for 2009, I thought it would be appropriate to do an analysis of the short-, medium-, and long-term charts and synthesize a broad outlook for the market.
In my December 4 article I said we should expect an upside breakout, but the market...
READ MORE
MEMBERS ONLY
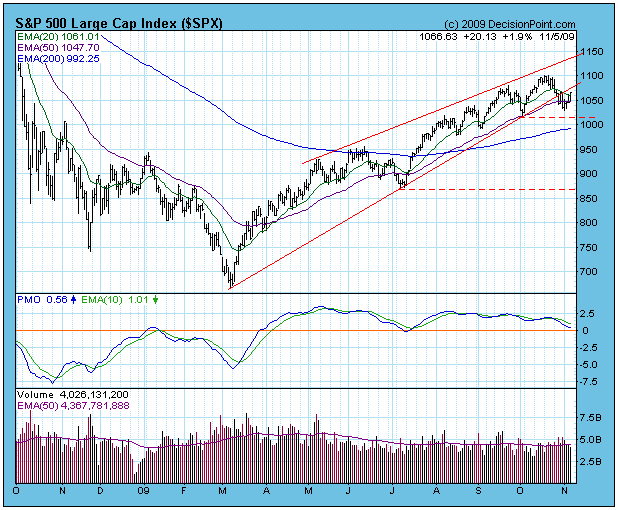
EXPECTING UPSIDE BREAKOUT
by Carl Swenlin,
President and Founder, DecisionPoint.com
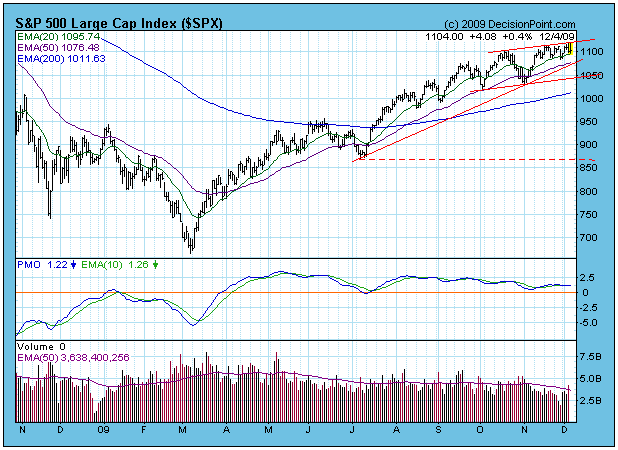
On Thanksgiving Day Dubai announced that it would be delaying loan payments by six months. This resulted in a global selloff, in which the U.S. markets participated on the following day. There was virtually no follow through selling this week. Looking at the S&P 500 chart below,...
READ MORE
MEMBERS ONLY
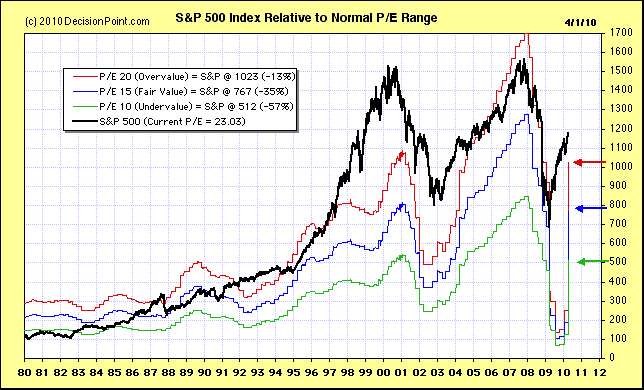
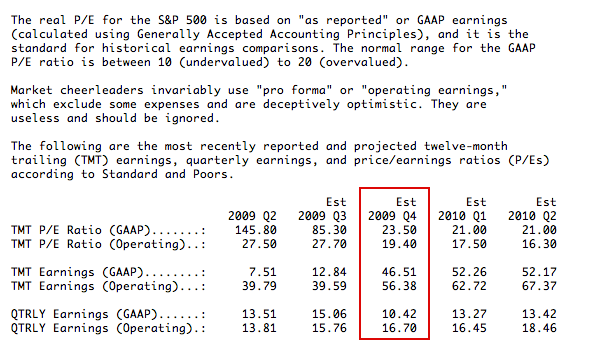
STOCKS STILL OVERVALUED
by Carl Swenlin,
President and Founder, DecisionPoint.com
Stocks have been in the overvalued end of the normal P/E range since the early-1990s, and this condition shows no sign of abating. Below is an excerpt from our daily earnings summary that will offer readers a better perspective. I have outlined the 2009 Q4 results because that is...
READ MORE
MEMBERS ONLY
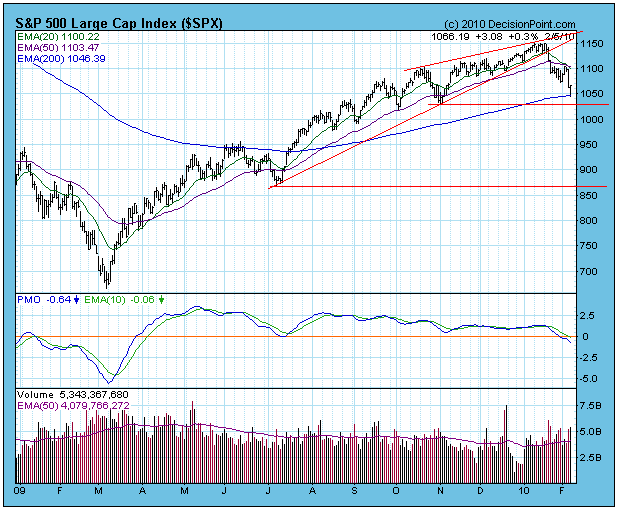
MARKET IS STRONG, BUT CORRECTION SHOULD CONTINUE
by Carl Swenlin,
President and Founder, DecisionPoint.com
Looking at the S&P 500 chart below, the breakdown from the ascending wedge pattern is clear enough, and expectation of the breakdown has been fulfilled. The rising trend line violation brings with it the expectation of a continued decline, but I do not have a price target at...
READ MORE
MEMBERS ONLY
OIL ETF BACK ON BUY SIGNAL
by Carl Swenlin,
President and Founder, DecisionPoint.com
In my September 25 article I headlined the fact that the Oil ETF (USO) had generated convincing sell signal, so I think it is appropriate to report that the signal has recently turned to a buy. Below is the chart from the 9/25 article showing the breakdown from the...
READ MORE