MEMBERS ONLY
SUPPORT STILL HOLDS CORRECTING PRICES
by Carl Swenlin,
President and Founder, DecisionPoint.com
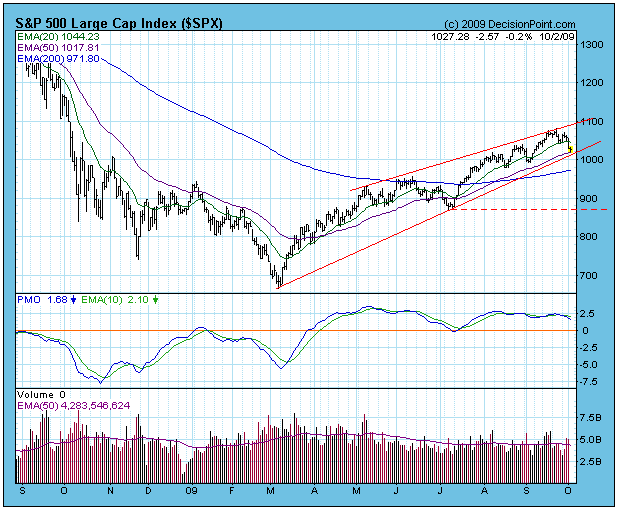
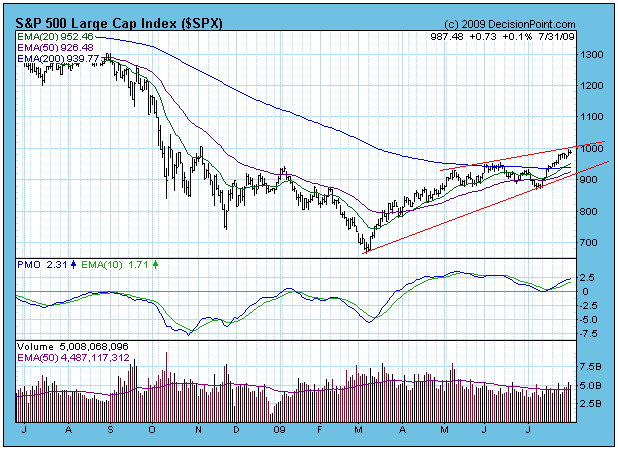
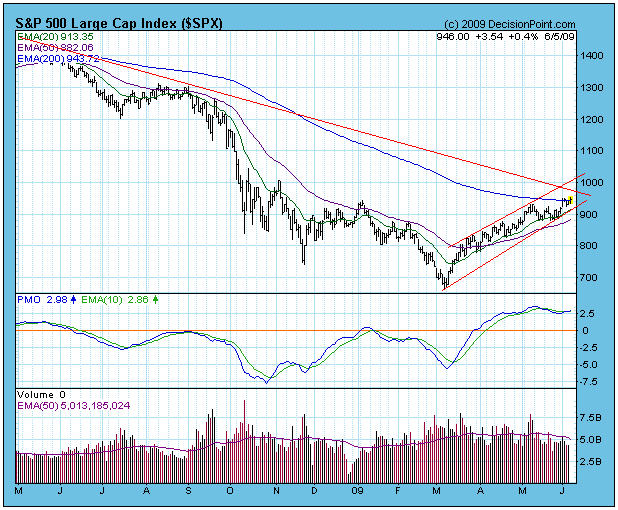
The market has begun another correction, but so far no serious technical damage has been done. The S&P 500 remains within the grasp of an ascending wedge formation, the dominant feature on the daily chart. On Friday prices hit their lowest level of the correction, but they remained...
READ MORE
MEMBERS ONLY
BULL MARKET RULES STILL APPLY
by Carl Swenlin,
President and Founder, DecisionPoint.com
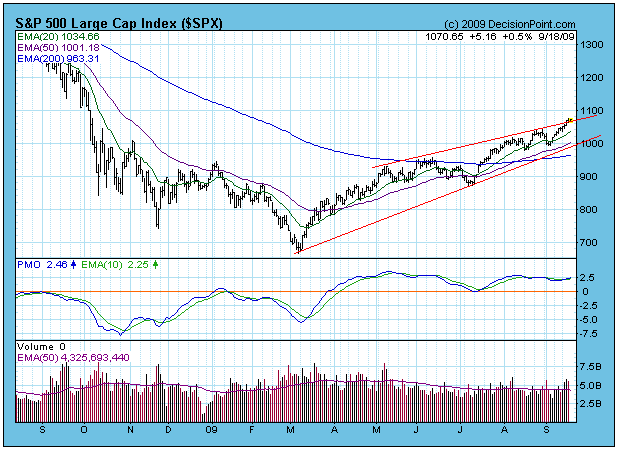
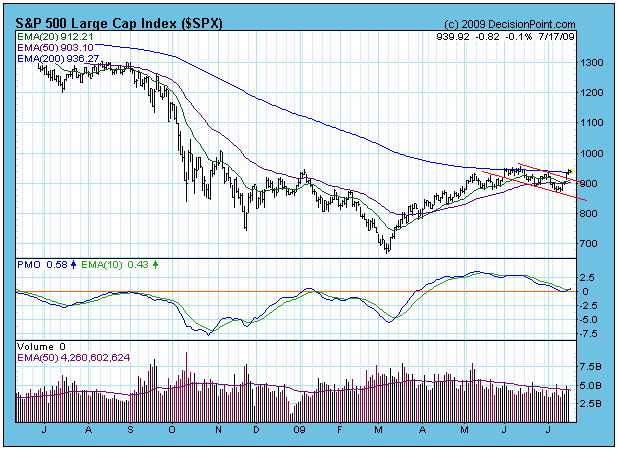
For weeks we have been looking for a correction, and a time or two we experienced some trepidation that the bull market might be over, but all the market has done is produce a series of minor pullbacks. At the present it is trying to break out of a rising...
READ MORE
MEMBERS ONLY
LOOKING BACK
by Carl Swenlin,
President and Founder, DecisionPoint.com
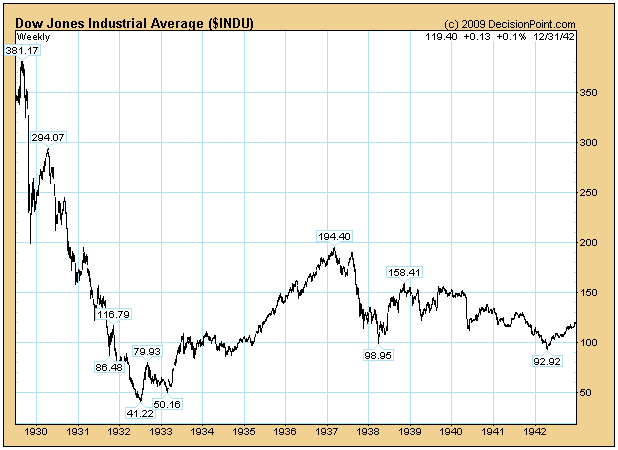
I continue to get mail from people who question how it is possible to be bullish in the face of the worst fundamentals since the Great Depression, so I thought it would be useful to look at a chart of the 1929 Crash and the decade that followed it.
Squeezed...
READ MORE
MEMBERS ONLY
LONG-TERM BUY SIGNAL
by Carl Swenlin,
President and Founder, DecisionPoint.com
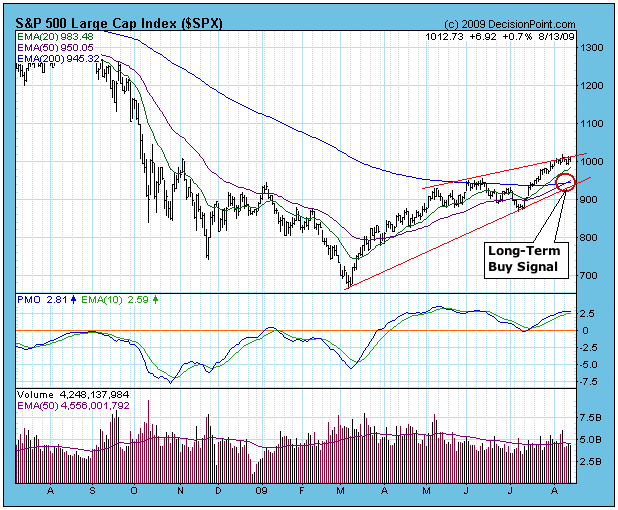
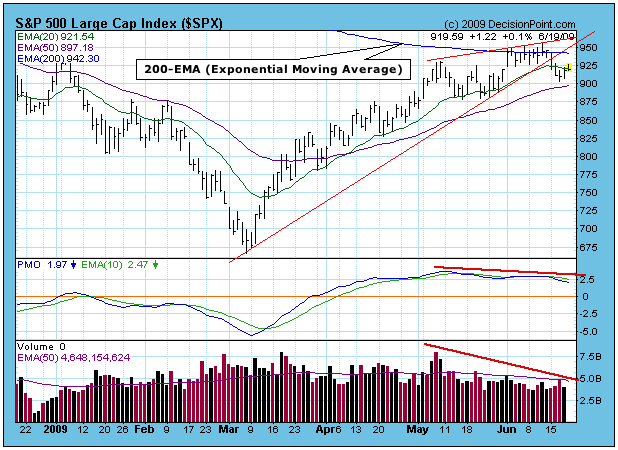
On Tuesday of this week our long-term model for the S&P 500 switched from a sell to a buy signal. While it is a simple model -- the signals are generated by the 50-EMA crossing over the 200-EMA -- it can also be very effective, capturing a gain...
READ MORE
MEMBERS ONLY
HOPING FOR A PULLBACK
by Carl Swenlin,
President and Founder, DecisionPoint.com
Since the price lows of early-July, the market has moved relentlessly higher, penetrating the important resistance posed by the 200-EMA. When this rally began, a narrow window of fairly low-risk opportunity was presented. Those who missed it are now hoping that prices will pull back far enough to provide another...
READ MORE
MEMBERS ONLY
BREAKDOWN BECOMES BEAR TRAP
by Carl Swenlin,
President and Founder, DecisionPoint.com
Last week I presented an alternate scenario to the head and shoulders breakdown and projected decline:
"While the bearish case seems strongest at this point, a bullish outcome is not impossible. Bullish forces have weakened, but it is not at all clear that the bear market has resumed. A...
READ MORE
MEMBERS ONLY
GOLDEN CROSS
by Carl Swenlin,
President and Founder, DecisionPoint.com
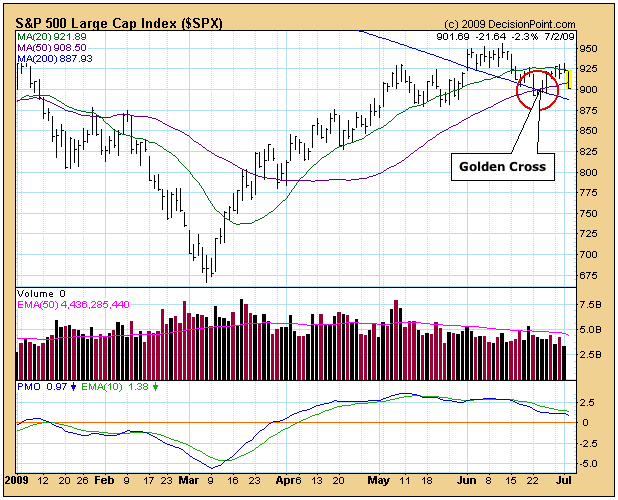
About a week ago the S&P 500 50-SMA (simple moving average) crossed up through the 200-SMA. (See chart below.) This is known as a "Golden Cross" because it is interpreted by many as a sign that the market is turning long-term bullish. Of course, this generated...
READ MORE
MEMBERS ONLY
BREAKDOWN AND SNAPBACK
by Carl Swenlin,
President and Founder, DecisionPoint.com
On Monday, in predictable fashion, prices broke down from the ascending wedge pattern we've been watching. Then, after a correction of 5%, prices began a snapback move up toward the recently violated support line (now overhead resistance). Prior to the breakdown, you will notice that overhead resistance was...
READ MORE
MEMBERS ONLY
IMPORTANT RESISTANCE ENCOUNTERED
by Carl Swenlin,
President and Founder, DecisionPoint.com
On the chart below we could attach a callout window to the rally that began in March and entitle it "Bull Market Rules Apply". Bull market rules generally mean that bullish setups will almost always resolve positively, and that bearish setups will usually fail to execute, because the...
READ MORE
MEMBERS ONLY
REVERSE HEAD AND SHOULDERS FORMING?
by Carl Swenlin,
President and Founder, DecisionPoint.com
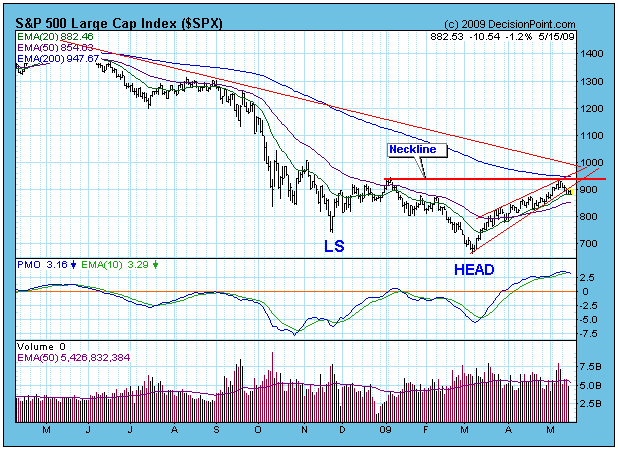
The ascending wedge pattern we discussed last week has broken down as we expected. Considering that the market has rallied nearly 40%, I think it is reasonable to expect more corrective action.
The next development to watch is the possible formation of a reverse head and shoulders. We currently have...
READ MORE
MEMBERS ONLY
STEADY ADVANCE PERSISTS
by Carl Swenlin,
President and Founder, DecisionPoint.com
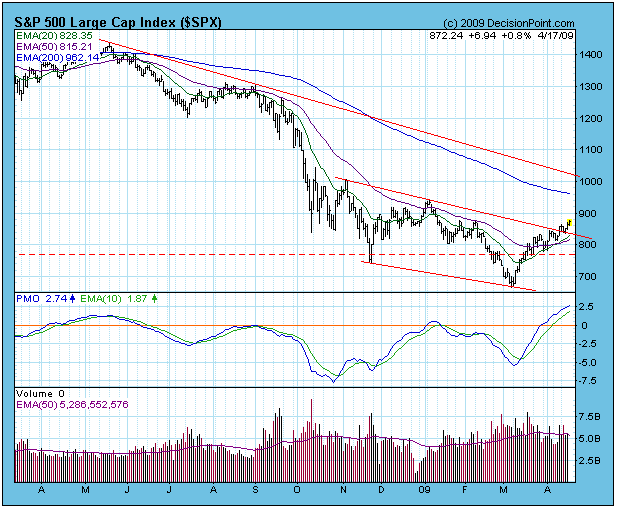
I have been referring to the slow, steady advance of the last few weeks as a "correction". To be more specific, it is a "running correction", which means that prices have moved higher as indicators have chopped sideways and lower. This is evident on the chart...
READ MORE
MEMBERS ONLY
PULLBACK IS LIKELY, BUT NOT GUARANTEED
by Carl Swenlin,
President and Founder, DecisionPoint.com
The bear market rally has continued to move prices higher, and the strength is greatest in the smaller-cap stocks. For example, the S&P 500 has rallied 30% from the March lows, but the Rydex S&P Equal Weight ETF (RSP) has advanced 45%. Looking through the list...
READ MORE
MEMBERS ONLY
RALLY CONTINUES
by Carl Swenlin,
President and Founder, DecisionPoint.com
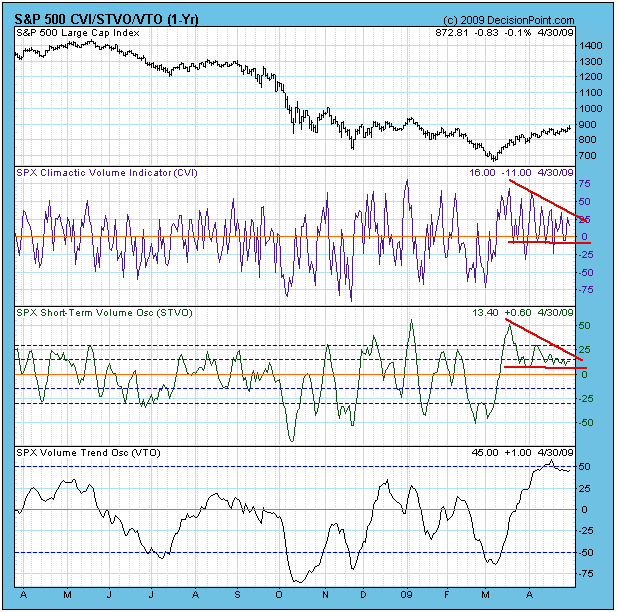
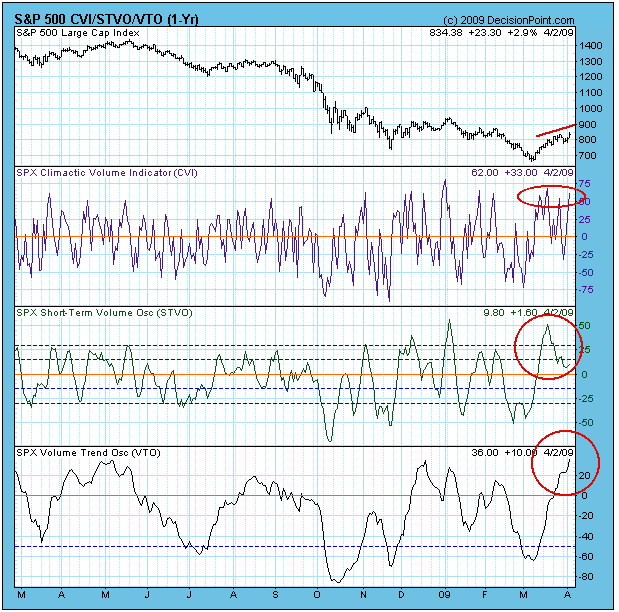
Last Friday I said we should be looking for a short-correction because the CVI (Climactic Volume Oscillator) was very overbought, and prices were approaching overhead resistance. There was a very small correction, but prices kept moving higher, while the CVI zigzagged at overbought levels. We also observed the STVO (Short-Term...
READ MORE
MEMBERS ONLY
SHORT-TERM TOP
by Carl Swenlin,
President and Founder, DecisionPoint.com
Quite a few years ago I used to write a daily newsletter, but I decided to give it up because it got tiresome trying to invent new ways to say the same thing over and over. More important, having to form an opinion on the market every single day, especially...
READ MORE
MEMBERS ONLY
BREAKDOWN!
by Carl Swenlin,
President and Founder, DecisionPoint.com
At the end of last week the S&P 500 had declined to and had settled on the support created by the November lows. It was poised to either rally and lock in a double bottom, or break down. On Monday prices broke down through support, and by Thursday&...
READ MORE
MEMBERS ONLY
RETEST
by Carl Swenlin,
President and Founder, DecisionPoint.com
The long-awaited retest of the November lows has finally arrived. The S&P 500 is still slightly above that support, but the Dow has penetrated it. Even though every rally since November has been greeted with intense hope of a new advance that would end the bear market, the...
READ MORE
MEMBERS ONLY
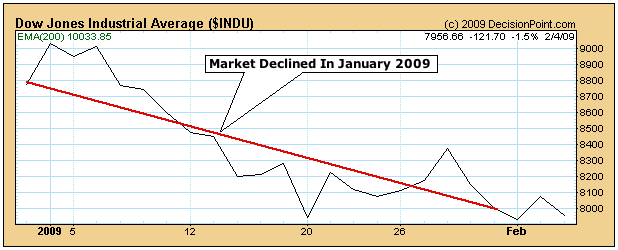
JANUARY FORECASTS A DOWN YEAR
by Carl Swenlin,
President and Founder, DecisionPoint.com
Research published by Yale Hirsch in the "Trader's Almanac" shows that market performance during the month of January often predicts market performance for the entire year. The January "barometer" has been particularly prescient in odd years (the first year of a new Congress), with...
READ MORE