MEMBERS ONLY
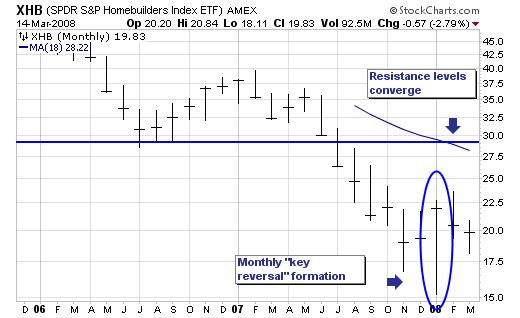
CHECKING OUT THE HOMEBUILDERS
From a broader market perspective, the S&P 500 continues to weaken after having violated the 1982-2000 bull market was violated two weeks ago at near 1310. This would suggest that further weakness is forthcoming and quite sharp weakness at that. But in any bear market - the rallies...
READ MORE
MEMBERS ONLY
ONE STEP FORWARD, TWO BACK
As we continue to evaluate alternative data feeds, we continue to be surprised by the results we are getting especially when it comes to data accuracy. Last week, we finally started charting intraday data from several different providers in our test lab. That allowed us to visible compare the results...
READ MORE
MEMBERS ONLY
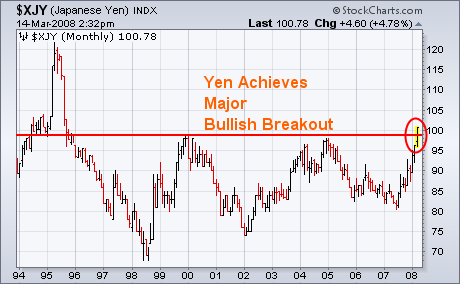
YEN HITS THIRTEEN YEAR HIGH
Last week I showed the Japanese Yen testing major chart resistance its 2000/2004 peaks. Today's 2% gain against the dollar put the yen over 100 for the first time in thirteen years (1995). While that's good for the yen, it's not necessarily good...
READ MORE
MEMBERS ONLY
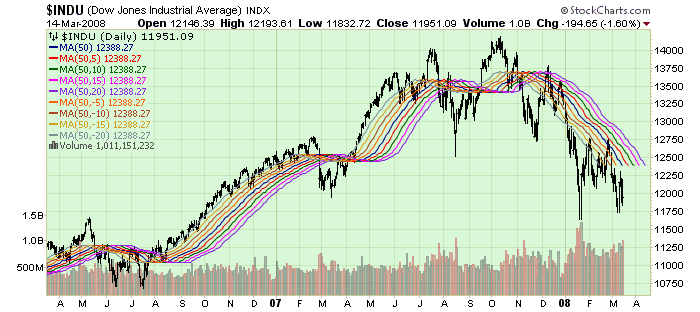
THE DISPLACED MOVING AVERAGE RIBBON
Hello Fellow ChartWatchers!
A while back, demonstrated the concept of the Moving Average Ribbon here as a way for seeing the "waves and ripples" for any stock. The concept is simple - just plot lots of Moving Average overlays on the same chart but change the period for...
READ MORE
MEMBERS ONLY
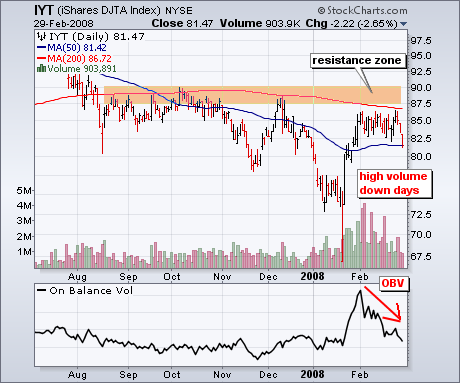
TRANSPORTS FALL FROM RESISTANCE
The Transport iShares (IYT) is an ETF designed to match the performance of the Dow Jones Transportation Average. The key industry groups include airlines, railroads, truckers and air freight, all of which are quite sensitive to the overall economy.
After surging in January, the ETF met stiff resistance in February...
READ MORE
MEMBERS ONLY
WHIPSAW!
All mechanical models have weaknesses, and our Thrust/Trend Model is no exception - it is vulnerable to whipsaw. Whipsaw occurs when the market moves just enough in one direction to trip the signal triggers in the model, then it reverses direction and moves just far enough to trigger a...
READ MORE
MEMBERS ONLY

US CLEARLY IN BEAR MARKET
As the credit crisis continues to unfold in rather negative fashion; many believe that the US economy will not enter into a recession, and many believe that if we do enter into a recession - that it is likely to be short-lived and shallow. We'd beg to differ...
READ MORE
MEMBERS ONLY
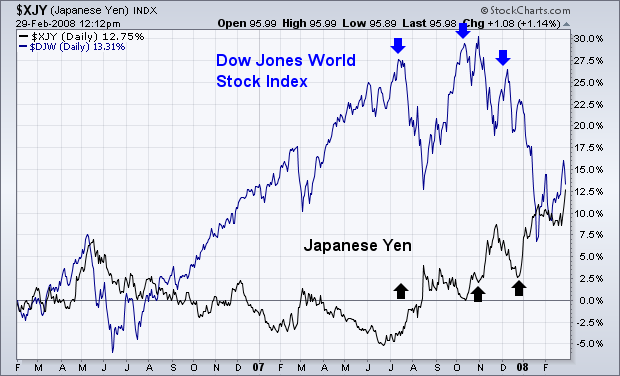
WHY A RISING YEN ISN'T GOOD FOR STOCKS
I first started writing about the danger posed to global stocks last summer when the yen first started rising. I also wrote that was because a rising yen was part of the unwinding of the so-called "yen carry trade". Over the last few years, global traders had been...
READ MORE
MEMBERS ONLY
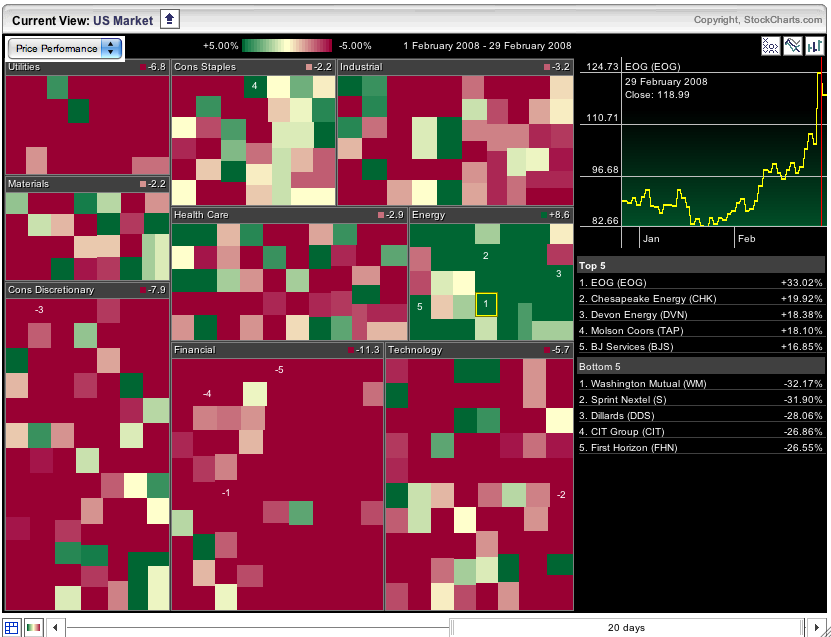
BLOOD ON THE CARPETS
Hello Fellow ChartWatchers!
Sorry for the ghastly title to this article, but the charts are rather ghastly as the moment and - as the image below shows - the damage is widespread:
That is a snapshot of our S&P Sector Market Carpet right now. Each stock in the...
READ MORE
MEMBERS ONLY
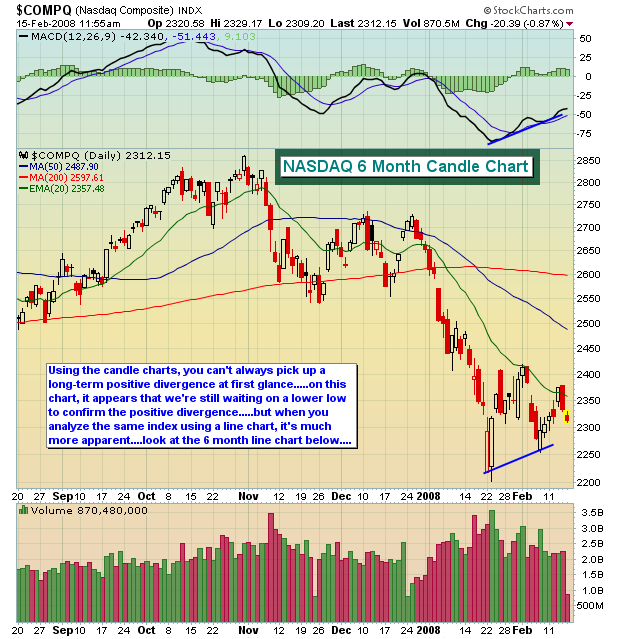
THE LINE CHART ADVANTAGE
This is a rarity. I am proposing that you use line charts - in one instance. A line chart simply connects one closing price to the next closing price. Intraday activity does not appear and is ignored. How in the world can line charts have an advantage over bar charts...
READ MORE
MEMBERS ONLY

DIA FAILS AT BROKEN SUPPORT
In the 15-December issue of ChartWatchers, I pointed out the possibility of a head-and-shoulders top in the Dow Industrials ETF (DIA). The ETF formed a weekly bearish engulfing pattern that week and this marked the mid December high. Subsequently, DIA moved lower over the next several weeks to confirm this...
READ MORE
MEMBERS ONLY
BOTTOM STILL NOT RESOLVED
When the market began to rally this week, it looked as if a successful retest of last month's lows had occurred and that another up leg had begun; however, what looked like the start of a new rising trend, has now morphed into a triangle formation with the...
READ MORE
MEMBERS ONLY
DOW JONES INDUSTRIALS CHANGING
Dow Jones announced last week that they are removing Altria and Honeywell from the index and adding Citibank and Chevron. The change takes effect at the start of trading on Tuesday.
MARKET HOLIDAY ON MONDAY - Don't forget that both the US and Canadian markets are closed on...
READ MORE
MEMBERS ONLY
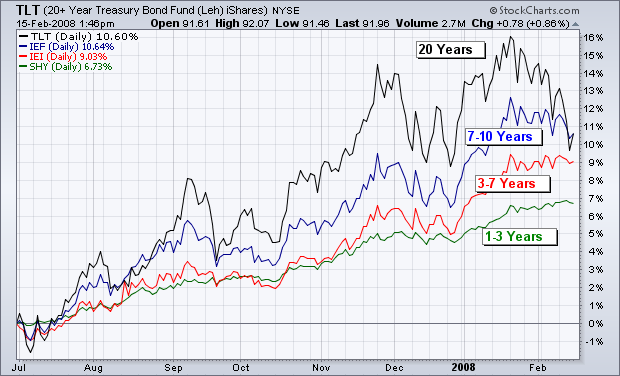
COMPARING BOND ETFs
The below chart compares the performance of four T-bond ETFs since last July, when money started to flow out of stocks and into bonds. The four ETFs represent different durations in the yield curve. Through the middle of January, the top performer was the 20 + Year Bond Fund (TLT). Next...
READ MORE
MEMBERS ONLY
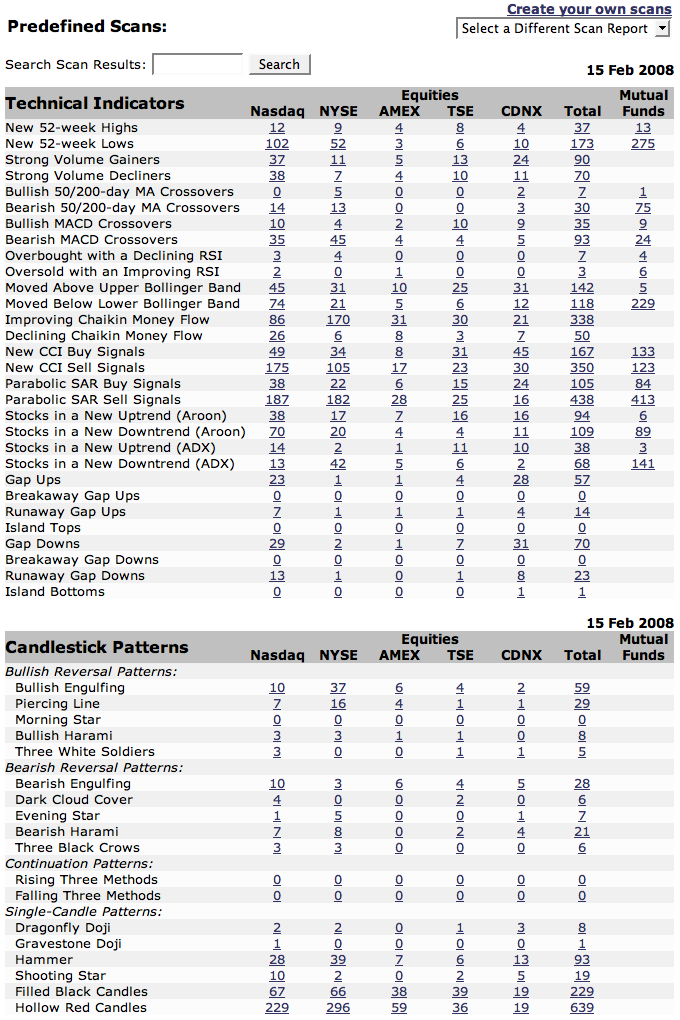
DIGGING INTO MARKET BREADTH
StockCharts.com has an extensive collection of Market Breadth indicators. Many of them can be found under the "Breadth Charts" link on the left side of our homepage. However, one of the best places for studying market breadth on our site is - surprisingly - our Predefined Scan...
READ MORE
MEMBERS ONLY
THE MARKET HAS BOTTOMED
want to recap what was discussed in the last ChartWatchers newsletter. We were approaching significant long-term price support on the Dow and the lower trendline on the NASDAQ while pessimism was starting to ramp up. I discussed the possibility of a significant bottom approaching and to watch for the put...
READ MORE
MEMBERS ONLY
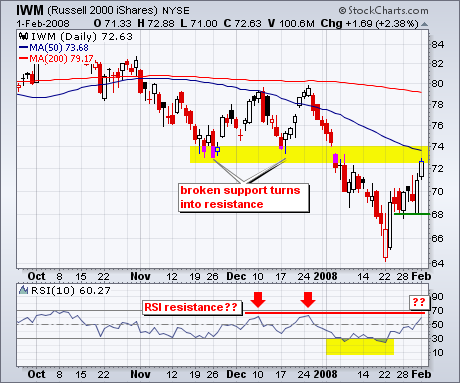
IWM NEARS RESISTANCE ZONE
With an oversold bounce over the last two weeks, the Russell 2000 ETF (IWM) is nearing a resistance zone from broken support and the 50-day moving average. Before going further, I should emphasize that the overall trend remains down for two reasons. First, the ETF broke down in January with...
READ MORE
MEMBERS ONLY
RESISTANCE THREATENS RALLY
In my January 18 article I asserted that we had entered a bear market based upon long-term sell signals generated by downside moving average crossovers on the daily and weekly charts of the S&P 500. My bottom line summary was as follows: "Probability is very high that...
READ MORE
MEMBERS ONLY
NO ONE IS IMMUNE
We recently noted the US had in our opinion entered into a bear market; hence we believe rallies are to be sold in the coming weeks/months as prices enter into resistance. However, we continue to hear how other world markets such as the European, Asian and Emerging markets will...
READ MORE
MEMBERS ONLY
DATAFEED MILESTONES
We hit two milestones with our Datafeed Upgrade project during the past week. First, the upgraded data connections for our older Thomson feed were installed on Friday. The problems we had last summer were because there was too much data to fit through our 3 megabit data connections. We now...
READ MORE
MEMBERS ONLY
JANUARY BAROMETER PREDICTS BAD YEAR
I haven't heard anyone in the media talking about the January Barometer, which is based on the view that "as January goes, so goes the year". That's probably because they only talk about it when the market has a strong January, which predicts a...
READ MORE
MEMBERS ONLY
GETTING STARTED ALL OVER AGAIN
Hello Fellow ChartWatchers!
First off I just want to take a second and say "Welcome" to all of our new members. Since January 1st, almost 1,000 new members have joined StockCharts.com(!). That's almost triple the rate at which we normally get new members and...
READ MORE
MEMBERS ONLY
IS IT BEAR SEASON?
The two most frequently asked questions these days are as follows: (1) Are we in a bear market? (2) Where's the bottom?
Let's take them one at a time. A bear market is generally defined as a decline of 20% or more. At the close on...
READ MORE
MEMBERS ONLY
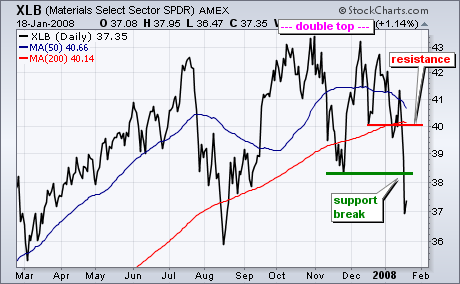
DOUBLE TOP PARADE CONTINUES
The Materials SPDR (XLB) joined the double top club with a sharp decline this past week. The Finance SPDR (XLF) and Consumer Discretionary SPDR (XLY) started the club with double top support breaks in August. The Russell 2000 ETF (IWM) broke double top support in November. And finally, the S&...
READ MORE
MEMBERS ONLY
BEAR MARKET RULES APPLY
On January 8 the 50-EMA crossed down through the 200-EMA on the S&P 500 daily chart, generating a long-term sell signal and declaring that we are now in a bear market. This was confirmed this week when the weekly 17-EMA crossed down through the 43-EMA. Let me say...
READ MORE
MEMBERS ONLY
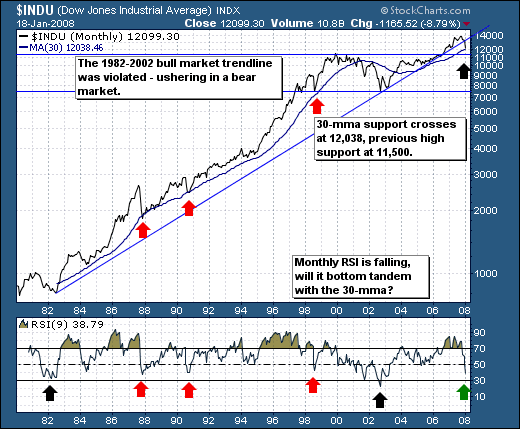
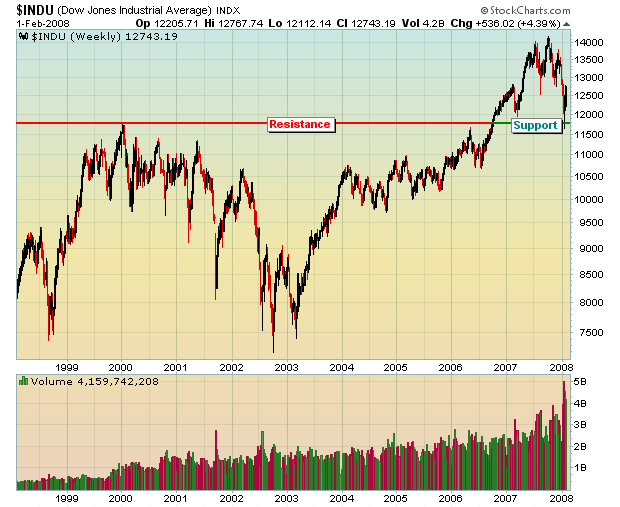
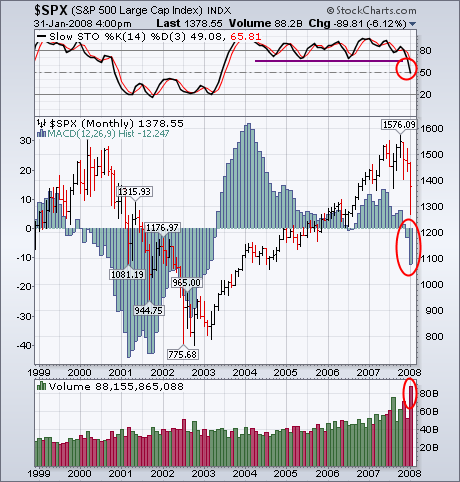
BULL MARKET IS OVER
The bull market is over; the Dow Industrials broke below its major bull market trendline extending from the 1982 bear market lows through the 2002 bear market lows. Obviously, one cannot take this lightly, as last week's negative price action was more of a bear market "exclamation...
READ MORE
MEMBERS ONLY
AVOIDING PROBLEMS BEFORE THEY START
Here are three things that everyone should do periodically to ensure that your computer works well when using StockCharts.com. Every day we get messages from lots of people that are having problems with their web browser and usually one of these steps will fix the problem. If you follow...
READ MORE
MEMBERS ONLY
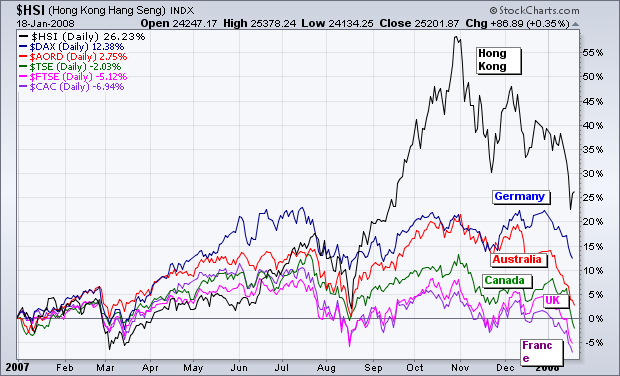
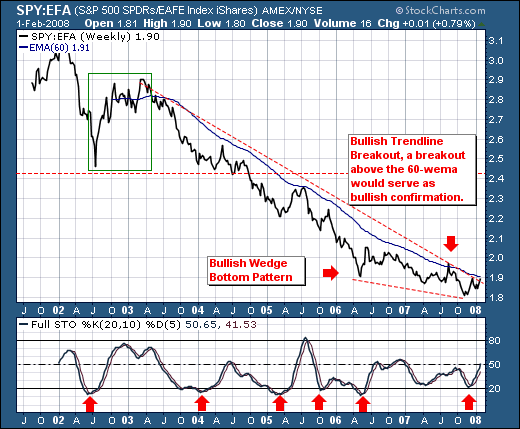
SO MUCH FOR GLOBAL DECOUPLING
I've expressed reservations before about the recent theory of global decoupling. The reasoning was that foreign markets would remain relatively immune to a major selloff (and possible recession) in the U.S. That view struck me as strange, especially with the close correlation that's existed between...
READ MORE
MEMBERS ONLY
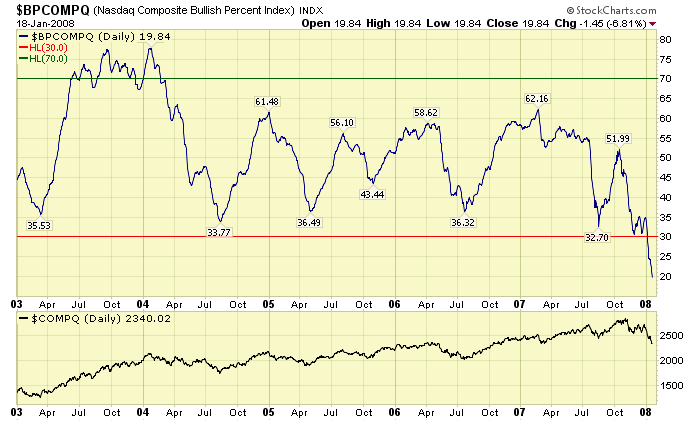
"BEARISH" PERCENT INDEXES
Lots of people are doing the Chicken Little thing these days. Is the concern/panic justified? Are we really entering a new Bear market? Which charts are going to calmly and objectively tell us what is really going on?
Whenever I want to study "the big picture" and...
READ MORE
MEMBERS ONLY
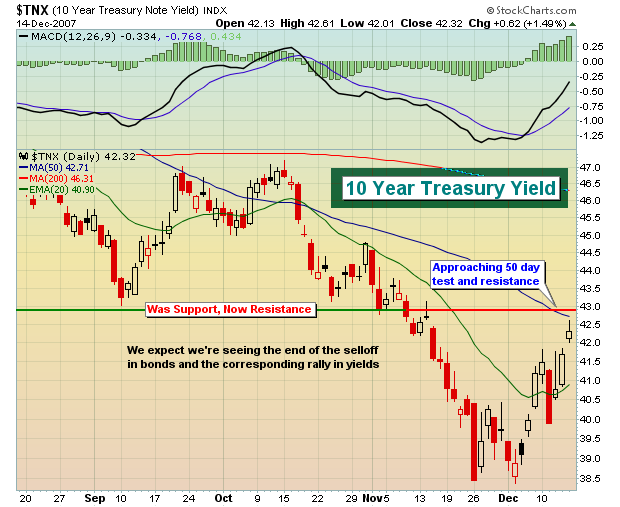
KEEP AN EYE ON BONDS
We've been following the bond market closely and for good reason. Earnings and interest rates drive the stock market. We are seeing a lot of signs of an economic slowdown, perhaps even a mild recession. As a result, earnings will not be spectacular and we'll likely...
READ MORE
MEMBERS ONLY
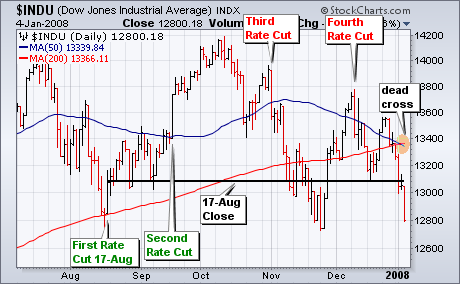
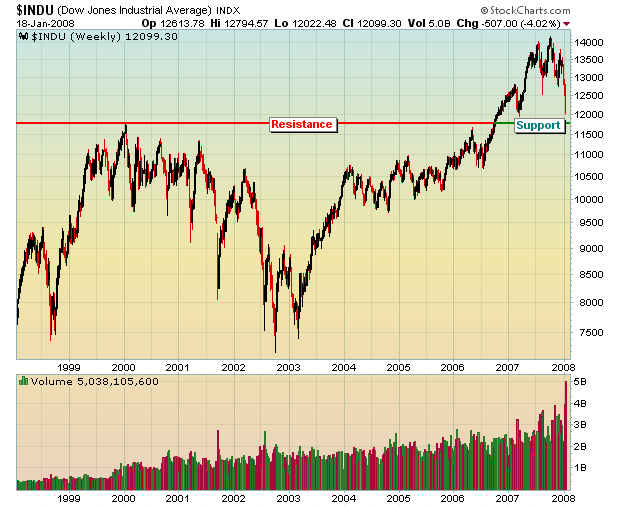
RATE CUTS NOT HELPING
The Fed started cutting interest rates on August 17th with a surprise 50 basis points cut in the Discount Rate. There have been three more rate cuts since 17-Aug, but the Dow Jones Industrial Average has nothing to show for these cuts. The first two rate cuts fueled the rally...
READ MORE
MEMBERS ONLY
RETEST STILL IN PROGRESS
Currently, the stock market is still in the process of retesting the November lows. This process needs to end now or some serious technical damage will be done, specifically the long-term rising trend line is in danger of being decisively violated. On the chart below you can see the long-term...
READ MORE
MEMBERS ONLY
HISTORY REPEATING?
The S&P 500 is off to its worst start to begin a new year since 2000; however, this isn't the larger headline to us. If were writing the story, the headline would indicate the probability of a bear market having begun rose significantly last week; but...
READ MORE
MEMBERS ONLY
SINGING IN THE (TICKER) RAIN
Just what you wanted right? Actually, this is the "Ticker Rain" that we talked about in the last newsletter. It is finally up on our website at https://stockcharts.com/charts/tickerrain.html. What is "Ticker Rain" you ask? It's a Java program that...
READ MORE
MEMBERS ONLY
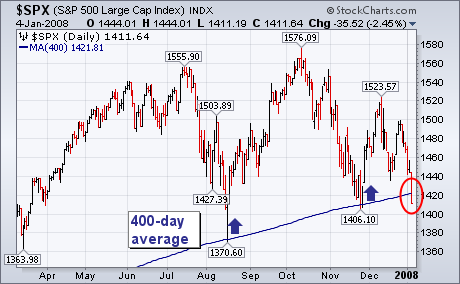
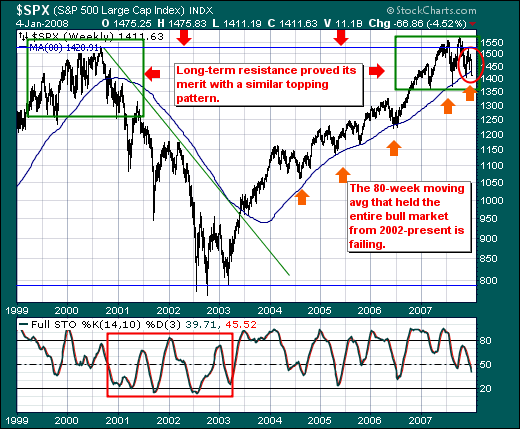
S&P 500 THREATENS 400-DAY MOVING AVERAGE
During the August market drop, I wrote about the importance of the 400-day moving average as a major support line. [That line is gotten by converting the 20-month moving average to a daily line. I'll show why we use that line shortly]. The daily bars in Chart 1...
READ MORE
MEMBERS ONLY
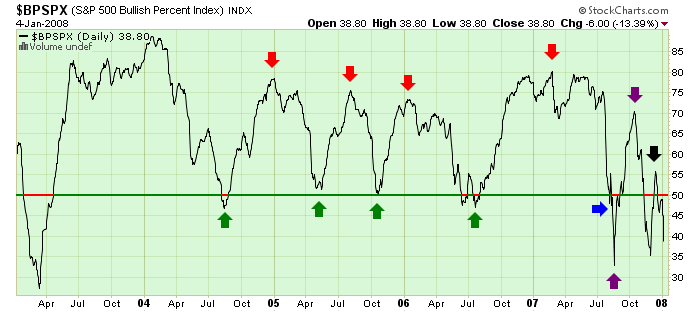
S&P BULLISH PERCENT GIVES THE BIG PICTURE
Hello Fellow ChartWatchers!
Welcome to 2008! The start of a new year is always a good time to look for the big-picture perspective on things and few things say "Big Picture" better than the Bullish Percent Indices. By condensing the technical picture for 500 important stocks down into...
READ MORE
MEMBERS ONLY
INFLATION'S BACK!
Three consecutive economic reports have shown that inflation, after lying dormant for several years, has been rekindled. The Fed, surely armed with the economic data we've seen, decided to lower the fed funds and discount rates by another quarter point each. Slowing growth and a pick up in...
READ MORE
MEMBERS ONLY
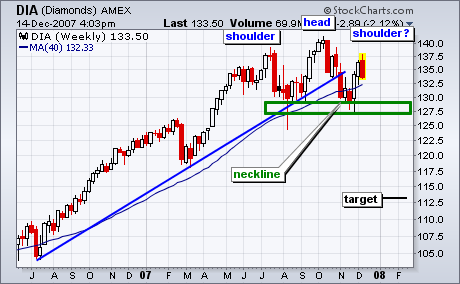
A HEAD-AND-SHOULDERS FOR DIA
Is that a head-and-shoulders pattern taking shape in the Dow Industrials ETF (DIA)? While it has yet to be confirmed, traders and investors should keep a close eye on this chart in the coming weeks.
The potential head-and-shoulders pattern extends from June to December. The left shoulder formed in July,...
READ MORE
MEMBERS ONLY
RETEST IN PROGRESS
Two weeks ago I stated that the rally off the November lows signaled that a bottoming process had begun, and that, after the short-term rally topped, we should expect a retest of the November lows. Last week the rally was still in progress, and I told Ike Iossif during our...
READ MORE
MEMBERS ONLY
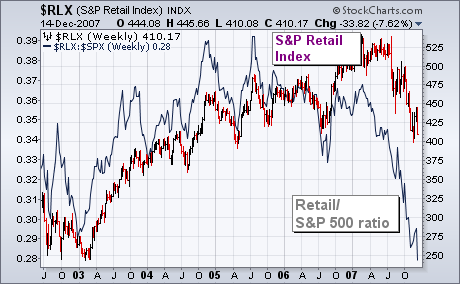
RETAIL WEAKNESS IS A BIG PROBLEM
The two charts below demonstrate part of the reason why recent Fed moves haven't had much of a positive impact on the stock market. It has to do with negative fallout on retail spending resulting from the housing meltdown. The bars in Chart 1 plot the S&...
READ MORE
