MEMBERS ONLY
Hello Fellow ChartWatchers!
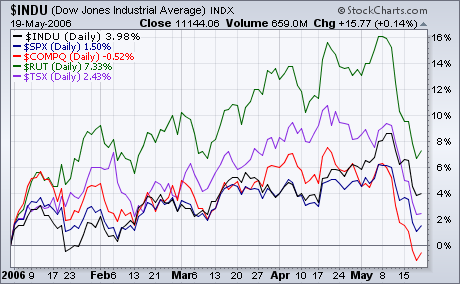
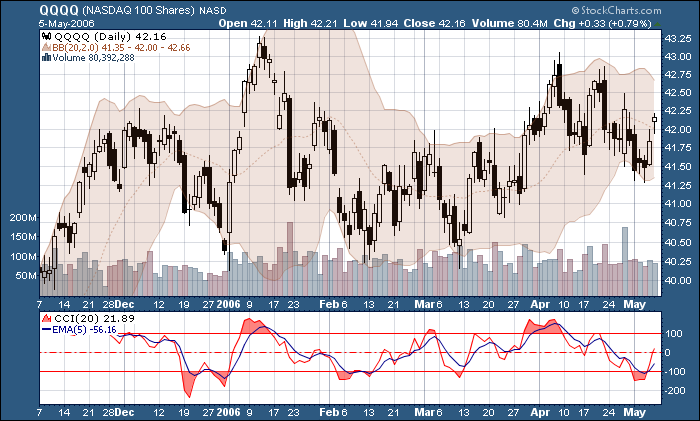
The markets moved lower last week with some disturbingly large downward movements. As you can see in the chart below, last week's losses put the Nasdaq Composite into negative territory for the year - the first of the major averages to get there.
(Did you notice the cool...
READ MORE
MEMBERS ONLY
ANOTHER BREAKOUT FOR THE RUSSELL 2000
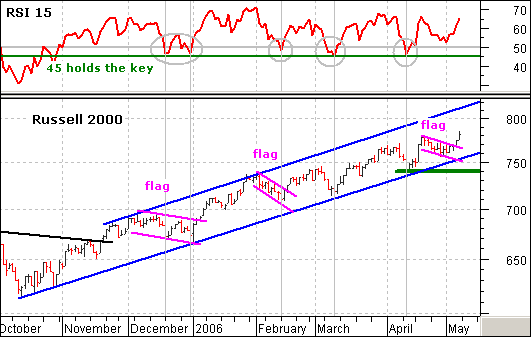
The Russell 2000 has not been the strongest broad index over the last few weeks, but it is still by far the strongest index in 2006 and shows no signs of stopping after another falling flag breakout on Thursday. This is the third such breakout since December and the death...
READ MORE
MEMBERS ONLY
GOOD AND BAD NEWS ABOUT THE DOLLAR
On March 17 our trend model turned from bullish to neutral on the US dollar, and since then the technical picture has continued to deteriorate. Prices have dropped precipitously from near 90 to near 85, and the weekly 17-EMA has crossed down through the 43-EMA, a long-term sell signal. (The...
READ MORE
MEMBERS ONLY
SC2 OFFICIALLY RELEASED
SHARPCHARTS2 OFFICIALLY RELEASED - Late last week we officially released SharpCharts2. This is a huge step forward for StockCharts.com and we couldn't have done it without the help and support of our users. Thanks again to everyone that provided feedback to us during the Beta process. We...
READ MORE
MEMBERS ONLY
WHY JAPAN IS STILL A GLOBAL VALUE
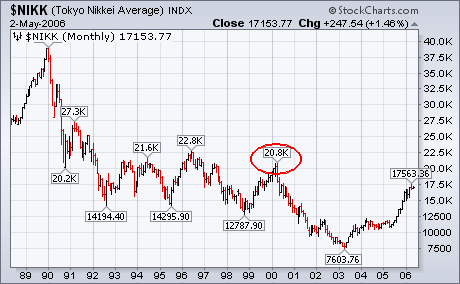
The first chart below shows why I believe Japan to be one of the best global values. While most other global markets are at or near record highs, the Nikkei 225 has recovered barely a third of its losses from 1990 to 2003. The Nikkei is still down 55% from...
READ MORE
MEMBERS ONLY
Hello Fellow ChartWatchers!
SIGNAL LINES GALORE
One of the huge new features of SharpCharts2 is its ability to plot "indicators of indicators." In other words, SharpCharts2 can chart indicators based on the value of another indicator which, in turn, is based on the value of the chart's main stock,...
READ MORE
MEMBERS ONLY
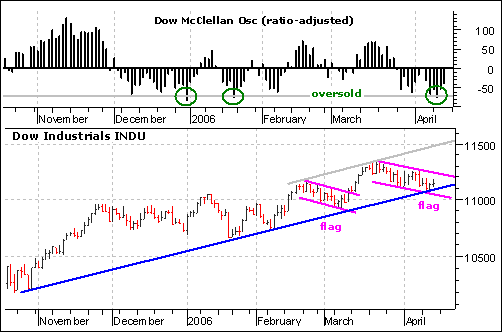
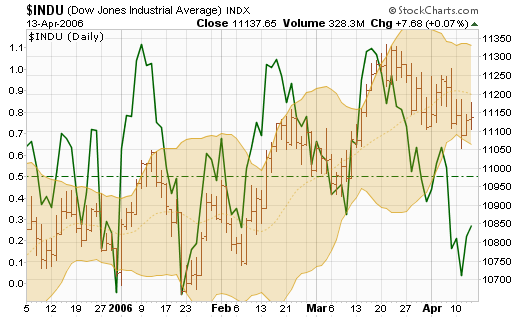
DOW OVERSOLD AND AT SUPPORT
The decline in the Dow Industrials over the last few weeks looks like a bull flag. This downward sloping flag is a potentially bullish pattern that requires confirmation with an upside breakout. Notice that the Dow formed a similar falling flag in late February and early March. The breakout at...
READ MORE
MEMBERS ONLY
ENERGY ADVANCE NOT SUPPORTED BY CASH FLOW
One way we can gauge sentiment regarding a particular market or sector index is by watching asset levels and/or cumulative net cash flow in and out of the related Rydex mutual fund. In general, cash flows should rise and fall along with prices. When divergences occur, price movement should...
READ MORE
MEMBERS ONLY
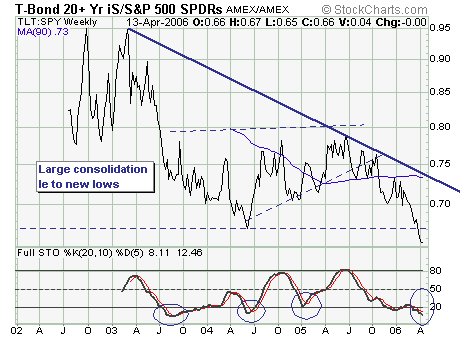
INTEREST RATES MATTER AT THE MARGIN
Last week the 10-year note and 30-year bond rose decidedly above the psychologically important 5.0% level. This is first time since June-2002 that the 10-year has traded above this level. If we have learned anything in our 24 years of trading - it is that interest rates matter at...
READ MORE
MEMBERS ONLY
SHARPCHARTS2 ALMOST COMPLETED
SHARPCHARTS2 PROGRESS REPORT -SharpCharts2 took another huge step forward last week when all of our "Basic" subscribers were automatically converted to the new system. At this point, the only group left to be fully converted to the new charts is our Extra (and "ExtraRT") members. We...
READ MORE
MEMBERS ONLY
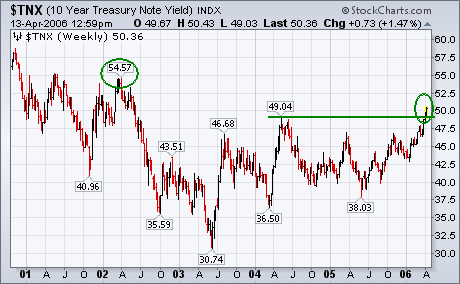
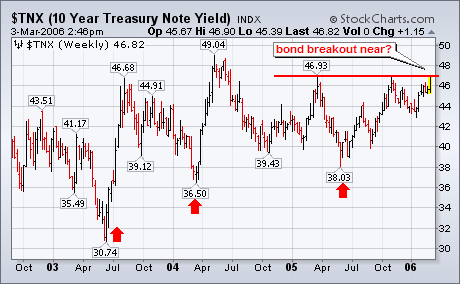
TEN-YEAR YIELDS EXCEEDS 5%
Last week the yield on the 10-Year T-note broke through its 2004 peak at 4.90% to reach the highest level in four years. Today the TNX has moved through the psychological level of 5%. That doesn't come as much of a surprise considering that the trend for...
READ MORE
MEMBERS ONLY
Hello Fellow ChartWatchers!
MAKING MONEY WITH SHARPCHARTS2
This week - tax week (ugh!) - I wanted to show you three examples of the kind of analysis that you can only do with SharpCharts2. These examples illustrate important technical analysis techniques that just weren't possible with our older charts. Hopefully, these examples...
READ MORE
MEMBERS ONLY
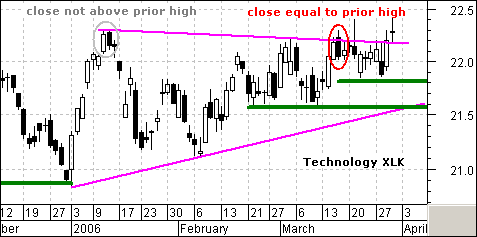
DARK CLOUDS REVISITED
In my previous column, I featured the Information Technology SPDR (XLK) with a pair of Dark Cloud Cover reversal patterns. Greg Morris, who wrote Candlestick Charting Explained, informed me that the Dark Cloud Cover pattern is one of the few that uses the previous days high as part of its...
READ MORE
MEMBERS ONLY
MARKET TREND IS STILL UP, BUT...
The overall trend of the market is still up, but there are very few new opportunities surfacing. Taking a look at our primary mechanical timing models below, we can see that nearly all of the broad market and sector indexes are on profitable buy signals, but most of the signals...
READ MORE
MEMBERS ONLY
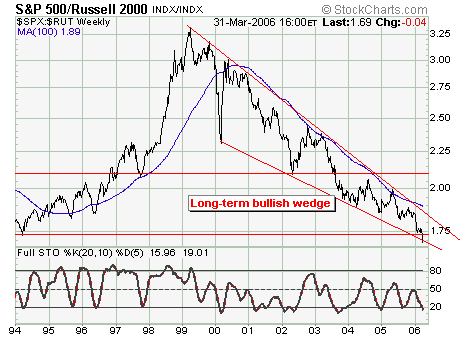
LARGE CAPS VS. SMALL CAPS
Today we look at large cap vs. small cap stock via the S&P 500/Russell 2000 Ratio. Since 1999, the ratio has gone nowhere other than down; which means this is the 8th year of decline. More generally, the ratio runs in 7 year cycles, so given we...
READ MORE
MEMBERS ONLY
SHARPCHARTS2 FOR BASIC MEMBERS STARTS THIS WEEK!
BASIC MEMBERS, SHARPCHARTS2 CONVERSION LATER THIS WEEK! - If you are a member of our "Basic" charting service, get ready. We plan on converting our Basic members to our SharpCharts2 charts during the coming week. ALL OF YOUR SAVED CHARTS WILL BE AUTOMATICALLY CONVERTED FOR YOU. You don&...
READ MORE
MEMBERS ONLY

SMALL CAPS AND AD LINE ARE STILL RISING
Rising interest rates can help the stock market over the short- to intermediate-term because it implies economic strength. It also causes some money to rotate out of falling bond prices and into stocks. Although rising bond yields usually cause problems for the market eventually, we have to watch the market...
READ MORE
MEMBERS ONLY

Hello Fellow ChartWatchers!
NADAQ BREAKSOUT - P&F CHART SHOWS IT BEST
Last week the Nasdaq composite broke through the 2340 resistance level and has moved into territory not seen since the "bubble popped" back in early 2001. The mid-term significance of this development can best be seen on the...
READ MORE
MEMBERS ONLY
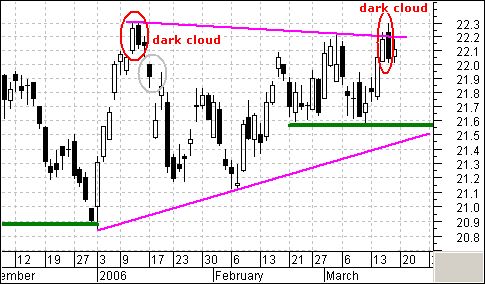
DARK CLOUDS FOR XLK
The dark cloud is a bearish candlestick reversal pattern made up of two candlesticks. The first is white and the second black. The open of the second is above the close of the first and the close of the second is below the mid point of the body of the...
READ MORE
MEMBERS ONLY
MARKET IS ST OVERBOUGHT AND AT RESISTANCE
Last week I wrote an article entitled Investors Intelligence Sentiment Helps Bulls in which I pointed out that sentiment had become very bearish, and that the market was more likely to rally than decline. Since then the market has enjoyed a short rally, but sentiment continues to be steadfastly bearish,...
READ MORE
MEMBERS ONLY
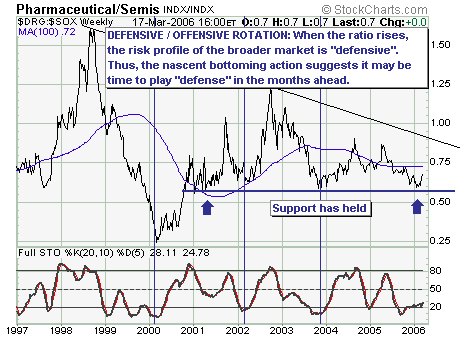
BROAD MARKETS TAKING "DEFENSE POSITIONS"
With the broad market indices such as the Dow Industrials and S&P 500 hitting new multi-year highs, one would reasonably believe that the advance has further to travel and riskier and riskier positions taken. However, when we look underneath the hood, we find rotation taking place towards more...
READ MORE
MEMBERS ONLY
BOOKSTORE BEST SELLERS
TOP TEN BEST SELLERS- We maintain a list of the top ten best-selling products in our online store. Hint: they are best-sellers for a reason. Take a look....
READ MORE
MEMBERS ONLY
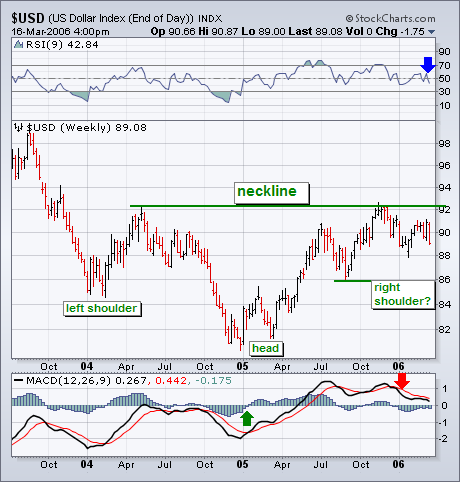
HEAD AND SHOULDERS DOLLAR BOTTOM?
It's possible that the current dollar pullback is part of a large basing pattern of the head and shoulders variety. A case can be made that the Dollar Index formed a left shoulder at the start of 2004 and a head at the start of 2005. The fourth...
READ MORE
MEMBERS ONLY
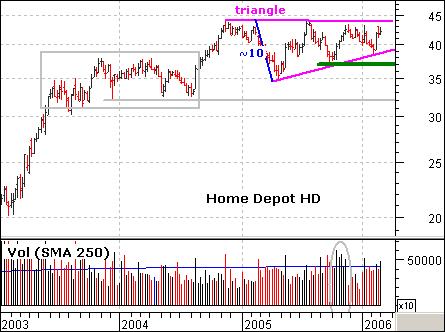
HOME DEPOT CONSOLIDATES WITH A MASSIVE TRIANGLE
HD is no stranger to long consolidations. The stock surged in 2003 and then consolidated for a year (gray box). The advance continued with a surge in 2004 and the stock consolidated over the last 12 months with a large triangle. The gains from 2003 and 2004 are largely holding...
READ MORE
MEMBERS ONLY

RYDEX CASH FLOW IS BEARISH
The Rydex Cash Flow Ratio*, which is shown on the first chart below, reflected a fair amount of bullish sentiment and peaked around the end of November. Since then it has been sliding down toward the bearish side of the range in spite of the fact that prices have been...
READ MORE
MEMBERS ONLY
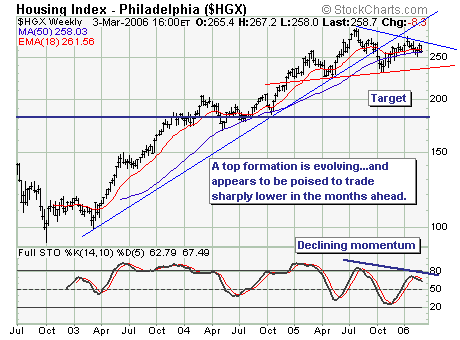
A LOOK AT THE HOUSING INDEX ($HGX)
Sometimes the best trade is the most obvious trade; and for us that is the "short housing" trade, or more succinctly...short the homebuilders. Interest rates moved sharply higher this week on the short-end as well as the long-end of the curve, and ht prospects are good for...
READ MORE
MEMBERS ONLY
SHARPCHARTS2 FOR FREE USERS
FREE USERS CONVERTED TO SHARPCHARTS2 - As mentioned above, we retired SharpCharts1 for Free Users last week. Be sure to click on the "Instructions" link for help with common pitfalls that ex-SharpCharts1 users are hitting when first starting to use SharpCharts2.
MORE SHARPCHARTS2 CONVERSIONS COMING SOON - Watch...
READ MORE
MEMBERS ONLY
GLOBAL RATES ARE HEADING HIGHER
Yesterday's decision by the ECB to raise rates was pretty much expected. What wasn't expected was the hawkish comments that accompanied that rate increase with hints of more to come. The Japanese have been talking about doing the same and may do so before the month...
READ MORE
MEMBERS ONLY
Hello Fellow ChartWatchers!
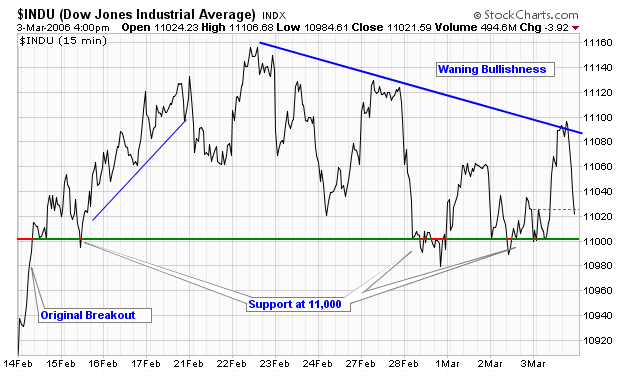
STRUGGLING WITH 11,000
The Dow continues to test the big breakout about 11,000 it had last month. Here's a chart of the recent action on a 15-minute scale which shows how the initial push has waned and how 11,000 is providing major support for the...
READ MORE
MEMBERS ONLY
DOW THEORY UPDATE
Two weeks ago, I reported waning upside momentum for the Dow Industrials and Dow Transports. In addition, I noted that a Dow Theory non-confirmation was brewing, but a Dow Theory sell signal had yet to register. The Dow Industrials and Dow Transports would both have to move below their January...
READ MORE
MEMBERS ONLY
SHORT-TERM OVERBOUGHT
In my February 2 article I stated my belief that a medium-term correction is in progress because the PMM Percent Buy Index (PBI) has turned down and crossed down through its 32-EMA. The chart below shows this condition still exists, and I have not changed my mind at this point....
READ MORE
MEMBERS ONLY
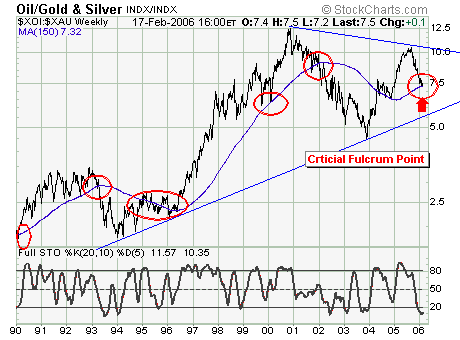
LOOKING AT OIL AND GOLD/SILVER INDEXES
For the longest time, crude oil and gold prices have dominated the news in terms of bullish commodities. We like to look at the ratio between the Integrated Oil and Gold/Silver Indexes ($XOI:$XAU) for a possible "pairs trade", and every few years we are accorded any...
READ MORE
MEMBERS ONLY
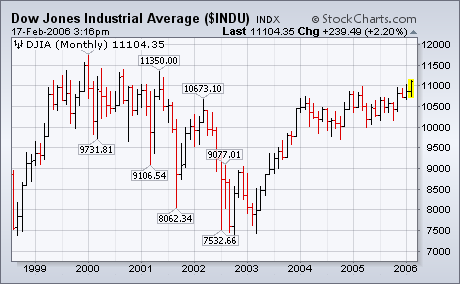
DOW HITS MULTI-YEAR HIGH
The Dow was the only one of the major averages to reach a new high this week. That continues its new upside leadership that I wrote about last week. With the Dow now above the 11K level, the next potential upside target is its 2001 high at 11350. One of...
READ MORE
MEMBERS ONLY
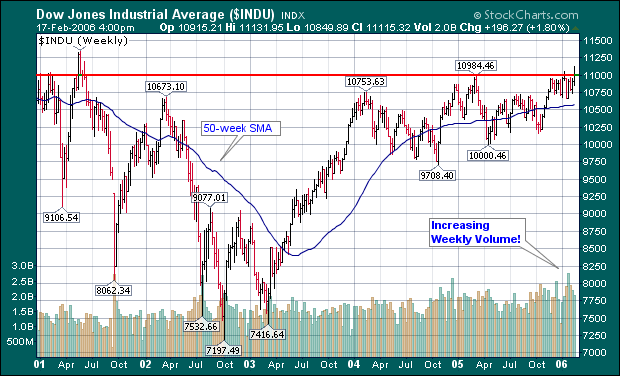
Hello Fellow ChartWatchers!
Stocks made a strong statement last week with the Dow Jones Industrials moving above the 11,000 mark decisively for the first time since June of 2001(!). The Dow flirted with 11,000 in March of last year and briefly broke thru 11,000 at the start of this year,...
READ MORE
MEMBERS ONLY
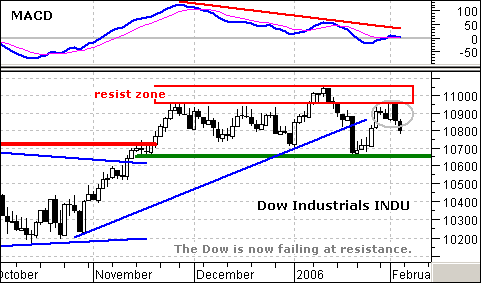
DOW THEORY NON-CONFIRMATION
The Dow is meeting staunch resistance around 11000, a level that turned the Average back in December and January. February is getting off to the same start with a big black candlestick on Thursday and 11500 remains the level to beat. In addition to a failure at resistance, MACD has...
READ MORE
MEMBERS ONLY
CORRECTION PHASE BEGINNING
With the market having formed numerous tantalizing tops since the end of November, perhaps the title of this article should say that a correction phase is finally beginning. And, considering all those previous false starts, why am I so sure that this time is the real thing? Well, I'...
READ MORE
MEMBERS ONLY
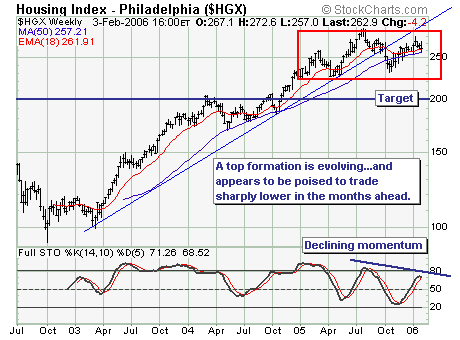
DECLINE IN HOUSING MARKET CONTINUES
The decline in the housing market is becoming more and more real; however, the housing index has yet to fully reflect the risk of the potential for still slower housing growth numbers. In some cases such as Ryland's (RYL), new home sales were recently below 2004 levels. Thus,...
READ MORE
MEMBERS ONLY
SHARPCHARTS2 BETA 7 "SHIPS"
NOTHING MUCH GOING ON - Yep, StockCharts.com is pretty quiet this week... Just Kidding! SharpCharts2 Beta 7 is out. Check out the article at the top of this newsletter for more details....
READ MORE
MEMBERS ONLY
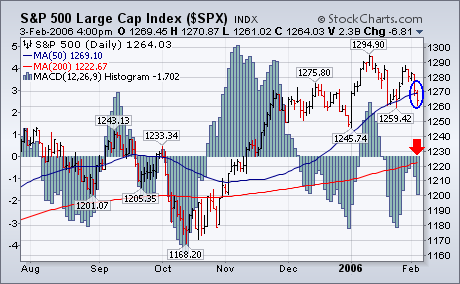
S&P 500 BREAKS ITS 50-DAY LINE
The chart below shows the S&P 500 closing the week below its 50-day moving average. That suggests a further drop toward 1245. The daily MACD histogram bars also paint a short-term negative picture. They stayed below the zero line and failed to confirm the previous week's...
READ MORE
MEMBERS ONLY
Hello Fellow ChartWatchers!
Have you tried SharpCharts2 yet? The reception for our new "Beta 7" version of SharpCharts2 has been incredible! More people have created more great looking SharpCharts2 charts in the past 3 days than ever before. And many of you have sent us lots of wonderful feedback about what...
READ MORE
