MEMBERS ONLY
DOW LEADS THE WAY LOWER
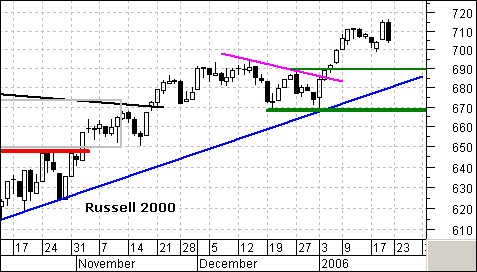
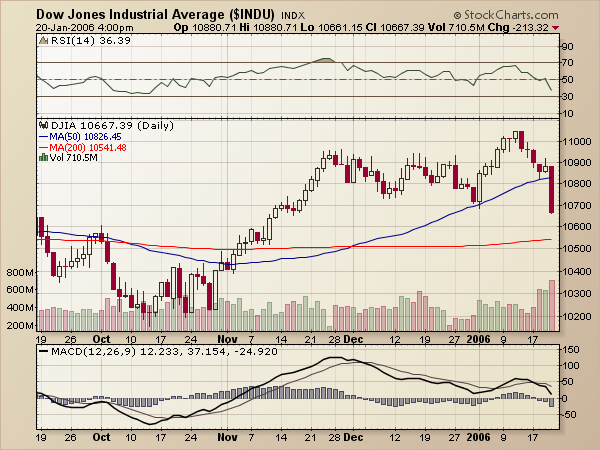
Wall Street took a pounding on Friday and the Dow took the biggest technical beating of all the major indices. The Nasdaq, S&P 500 and Russell 2000 all remain above their 3-Jan lows, but the Dow broke below its 3-Jan low. This shows relative weakness and bodes ill...
READ MORE
MEMBERS ONLY
UNDERMINING GOLD
While mining gold has become very profitable, there are many signs that future prices are being undermined. For example, our first chart shows total assets and cash flow for Rydex Precious Metals Fund. While assets have risen along with price, cash flow (the bottom panel on the chart) reflects that...
READ MORE
MEMBERS ONLY
SHARPCHARTS2 BETA 7 ARRIVES FEB. 1st!
SHARPCHARTS2 BETA 7 DUE OUT ON FEBRUARY 1st! We continue to work feverishly here at StockCharts getting the final "Beta" version of our new SharpCharts2 charting tool ready for its February 1st debut. Here are just some of the changes that we think will dazzle you:
* No more...
READ MORE
MEMBERS ONLY
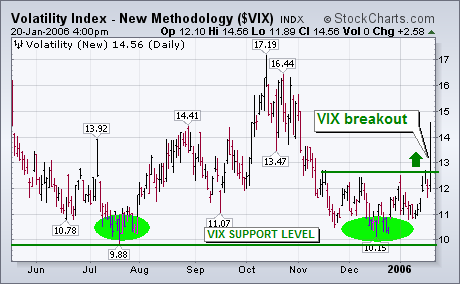
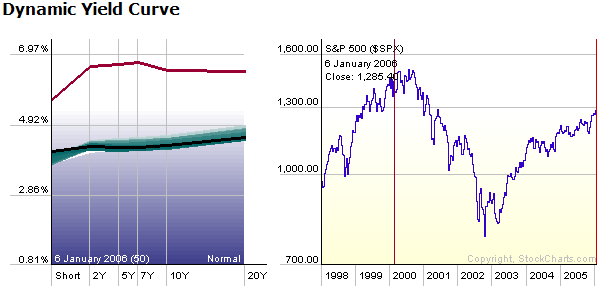
VIX TURNS UP -- S&P TURNS DOWN
A week ago Thursday I wrote a message entitled: "Low Volatility (VIX) Index May Increase Market Risk in 2006 -- S&P 500 Pulls Back From Overbought Condition" (January 12, 2006). The next two charts are updates of the ones shown at that time. I was concerned...
READ MORE
MEMBERS ONLY
Hello Fellow ChartWatchers!
Jitters have crept back into the stock market with last Friday's big drop in the major averages. In addition to breaking the Dow's low from the start of the year, Friday's selloff ended with the first close below the 50-day moving average since the...
READ MORE
MEMBERS ONLY
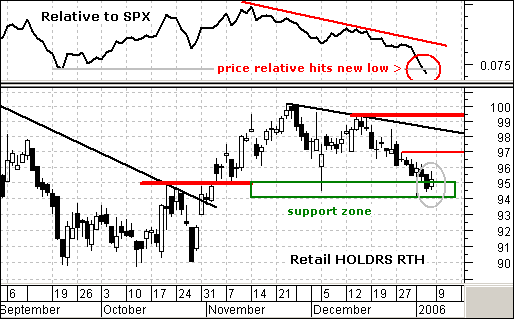
RETAIL HOLDRS HAVE YET TO RECOVER
Despite a strong start in the S&P 500 this year, the Retail HOLDRS (RTH) remains under pressure and is lagging the overall market. This is not a good sign for the industry group or the Consumer Discretionary sector, which is heavily weighted towards retail stocks. In addition, retail...
READ MORE
MEMBERS ONLY
2006 ASSESSMENT
I am often asked to make an annual forecast, and I frequently oblige, but this year I'd like to take a different approach. Rather than making a "forecast," let's make an assessment of some significant factors that will be affecting market progress in 2006....
READ MORE
MEMBERS ONLY
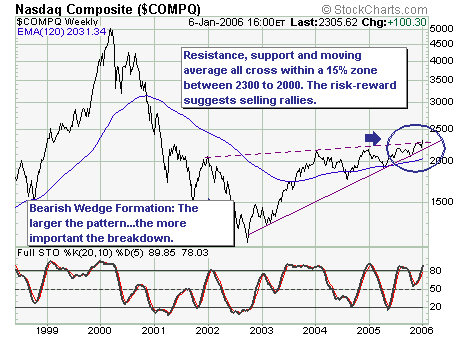
FALSE BREAKOUTS AHEAD?
The first 4-days of US trading has shown nothing but gains; and we believe that this "euphoria" is providing an upcoming opportunity to be come short the technology sector as a whole. Allow us to explain:
Using the weekly NASDAQ Composite chart, the rally off the low has...
READ MORE
MEMBERS ONLY
BETA 7, FUND DISTRIBUTIONS, YIELD DATA
SHARPCHARTS 2 BETA 7 TO LAUNCH ON FEBRUARY 1ST - As we mentioned above, the next version of our SharpCharts2 charting tool will appear on February 1st. This version of SharpCharts will give you greater control over your charts and overlays and will allow members to save charts into their...
READ MORE
MEMBERS ONLY
CONCENTRATING ON STRENGTH
The market is starting the new year with a bang. Virtually all of the major market averages have risen to new 52-week highs. Some of that new optimism is the result of the Fed minutes released earlier in the week hinting that it might be close to ending its rate-hiking....
READ MORE
MEMBERS ONLY
Hello Fellow ChartWatchers!
Wow! Six years into the new millennium already - and into StockCharts.com's seventh year of existence! Last year was our strongest year ever as we continued to expand our site and our subscribership. This year looks even brighter with the upcoming release of SharpCharts2 and our long-awaited...
READ MORE
MEMBERS ONLY
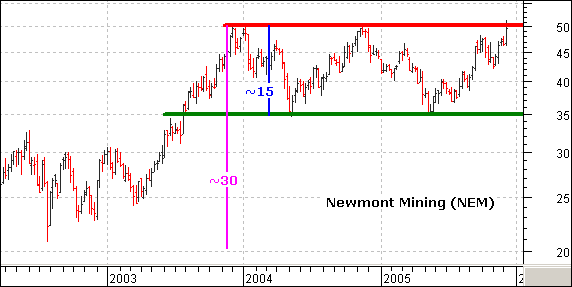
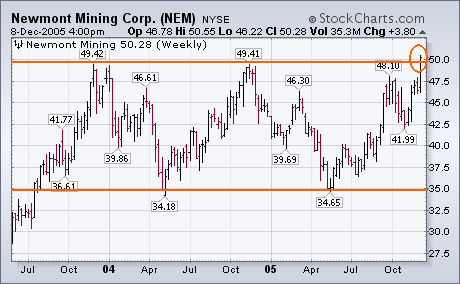
NEWMONT (NEM) FORMS THE MOTHER OF ALL CONSOLIDATIONS
Since NEM first broke above 35, gold has advanced from below 400 to above 500. However, NEM remains stuck in a long-term trading range. Did NEM secretly hedge production? Probably not, but the stock is not keeping up with gold, which broke above its 2003 and 2004 highs.
NEM is...
READ MORE
MEMBERS ONLY
GOLD HITS $500 AND RESISTANCE
On December 1 New York spot gold closed at $502.30, slightly exceeding a target long awaited by gold bugs, but $500 is also a level we technicians have for a long time identified as a long-term resistance level. Could it be that the cyclical bull market in gold has...
READ MORE
MEMBERS ONLY
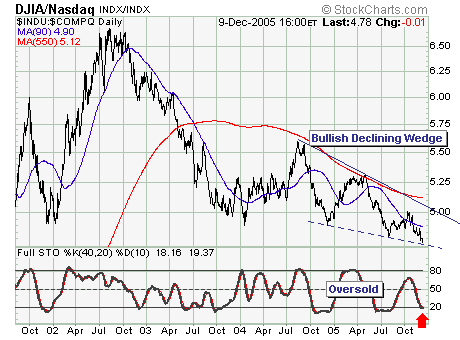
TOPS AHEAD FOR DEC/JAN?
The December to mid-January time frame has produced a number of rather large and tradable tops throughout history; and it is our belief the probability favors just such a top developing given the current overbought momentum readings. That said, we also note that the declining Dow Industrials-Nasdaq Composite Ratio is...
READ MORE
MEMBERS ONLY
GOLD STOCKS BREAK OUT
Gold bullion climbed over $5.00 today to end at $519 which is the highest level in twenty-four years. Gold has now exceeded its 1983 peak at $514. Despite my concerns about a possible pullback around the $500 area, bullion shows no signs of slowing down. That may be partially...
READ MORE
MEMBERS ONLY
Hello Fellow ChartWatchers!
Happy Holidays everyone! And welcome to the holiday edition of ChartWatchers. This special edition replaces our normal December issues and it contains several exciting announcements about the markets and StockCharts.com. Be sure to check out the Site News section for more on StockCharts including news about our holiday subscription...
READ MORE
MEMBERS ONLY
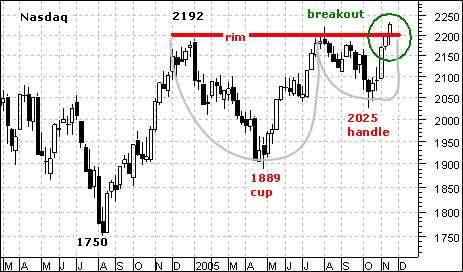
NASDAQ CUP-WITH-HANDLE BREAKOUT
The Nasdaq's breakout at 2200 confirms a bullish cup-with-handle pattern and targets a move to around 2500. Until there is evidence to the contrary, this is the dominant chart pattern and further gains should be expected.
William O'Neil of Investor's Business Daily (IBD) developed...
READ MORE
MEMBERS ONLY
MARKET BECOMING OVERBOUGHT IN ALL TIME FRAMES
When a stock is above a moving average it is considered bullish, and the stock can be considered to be in a rising trend for that time frame. A good way to determine the market's overall condition (overbought/oversold) across a range of time frames is to analyze...
READ MORE
MEMBERS ONLY
NASDAQ HITS FOUR-YEAR HIGH
The chart below shows the Nasdaq Composite having hit a new four-year high this week. It's now trading at the highest level since the spring of 2001. There's another shelf of potential resistance to watch at 2328 (see circle), but the action has been impressive. That...
READ MORE
MEMBERS ONLY
Hello Fellow ChartWatchers!
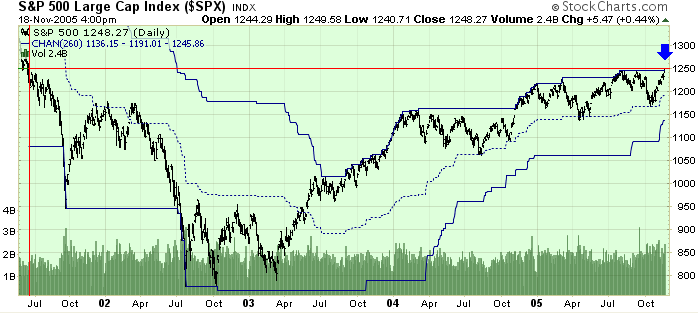
This week the markets have started pushing into bullish territory. John, Carl and Arthur all dig into these new events in more detail, but first let's have a look at the S&P 500 Index:
The blue arrow shows where the latest close, just below 1250, has...
READ MORE
MEMBERS ONLY
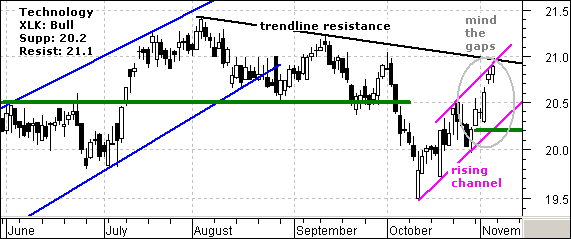
MIND THE GAPS
The Information Technology SPDR (XLK) broke support in early October, bottomed in mid October and surged over the last few weeks. This surge featured two gaps last week and these hold the key to recent strength. The stock gapped up on Monday and again on Thursday (gray oval). Gaps show...
READ MORE
MEMBERS ONLY
LOWER PRICES AHEAD FOR NASDAQ?
On a longer-term monthly basis, the Nasdaq Composite is very clearly forming a rather bearish "wedge" pattern. Resistance between 2080 and 2220 is quite strong, and rallies back into this zone are becoming weaker and weaker. Ultimately - and we think rather soon, this pattern will lead to...
READ MORE
MEMBERS ONLY
HURRICANE DONATIONS, CHARTSCHOOL UPDATE
OUR PROBLEMS ARE PUNY IN COMPARISON - While our weekend power problems were unusual, we realize that they were nothing compared to the problems faced by residents of the gulf coast in the aftermath of Hurricanes Katrina and Rita. For the past two months, StockCharts.com has pledged $5 of...
READ MORE
MEMBERS ONLY
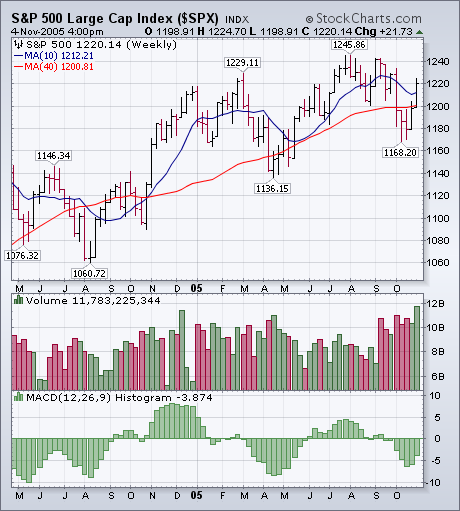
S&P TREND IMPROVES -- SOX REGAINS 200-DAY LINE
The weekly bars in Chart 1 show the improvement in the S&P 500 this past week. Not only did it close back over its (red) 40-week average, but it closed above its (blue) 10-week average as well. Even more impressive was the heavy upside volume. That strong action...
READ MORE
MEMBERS ONLY
Hello Fellow ChartWatchers!
While last week was a really good week for the markets - Dow up 3%, Nasdaq up over 5% - it was a really lousy week for StockCharts.com. As most of you know, the site had problems creating charts on Thursday and again on Friday and then we were...
READ MORE
MEMBERS ONLY
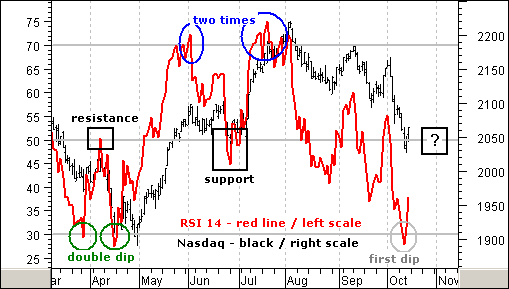
RSI AND THE NASDAQ
This week 14-day RSI for the Nasdaq became oversold (below 30) for the first time since April (gray oval). Even though securities can become oversold and remain oversold, the odds of a bounce increase with oversold conditions. The question is not whether there will be a bounce or not, but...
READ MORE
MEMBERS ONLY
MARKET IS OVERSOLD AND DANGEROUS
The Price Momentum Oscillator (PMO) is an expression of internal strength for a given price index. In the chart above we summarize three important PMO characteristics for the individual stocks in the S&P 500 -- the percentage of PMOs rising (very short-term), the percentage of PMOs on crossover...
READ MORE
MEMBERS ONLY
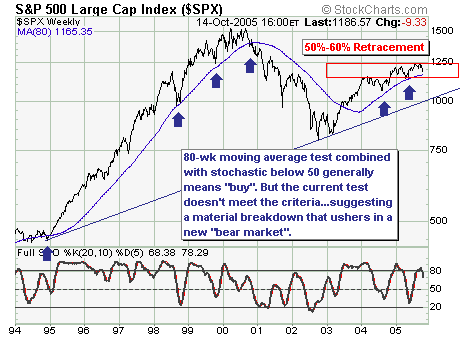
WEAKNESS AHEAD FOR THE S&P500?
Today, the simple technical picture is breaking down in our opinion. If we look back to 1994, we find the 80-week moving average has been an excellent swing trading tool as it holds the data as near perfect as can be expected. Our concern focuses upon the current decline from...
READ MORE
MEMBERS ONLY
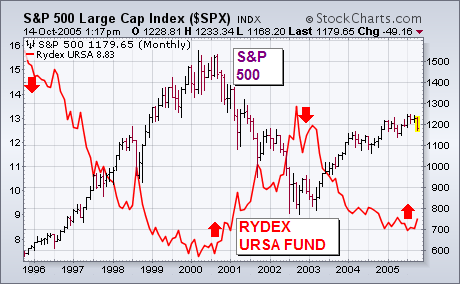
WHY BEAR FUNDS ARE TRADING VEHICLES
My Wednesday message on bear funds wrote that they should be used as trading vehicles and not as a long-term investment. One of our readers asked why. That's because the market has a history of rising more often that it falls. To hold a bear fund in a...
READ MORE
MEMBERS ONLY
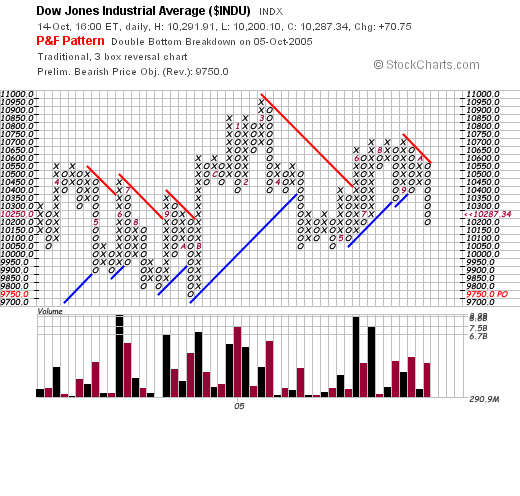
Hello Fellow ChartWatchers!
The markets are getting very interesting these days! Last week saw some big declines that were mostly erased by Friday's rally.
If you're looking for bearish signals, look no further than our Dow Jones Industrials Index P&F chart:
I draw your attention to the...
READ MORE
MEMBERS ONLY

BEARISH PATTERNS FOR THE RUSSELL 2000 ETF
The Russell 2000 ETF (IWM) has two potentially bearish patterns working that would be confirmed with a support break at 64 (645 for the Russell 2000). Confirmation is the key with both patterns. In fact, confirmation is the key to most patterns. Until confirmation, these are only potentially bearish patterns...
READ MORE
MEMBERS ONLY
GOLD APPROACHING RESISTANCE
This chart of gold has some interesting technical features. First, there is the parabolic rise to $850 in 1980, which culminated in the inevitable blowoff and collapse.
After a parabolic collapse, prices most often return to the original base, which in the case of gold is somewhere below $100 and...
READ MORE
MEMBERS ONLY
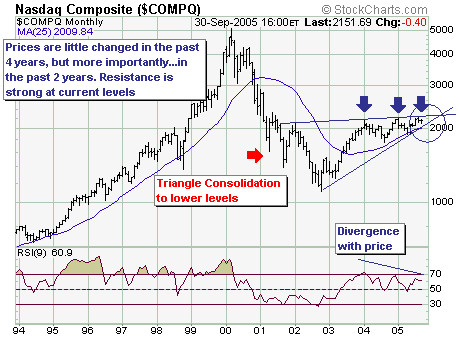
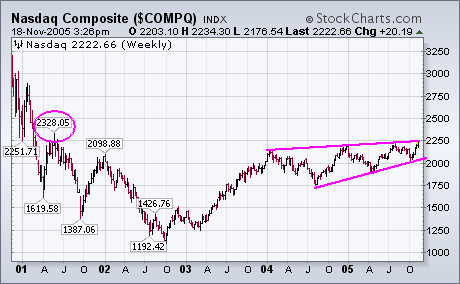
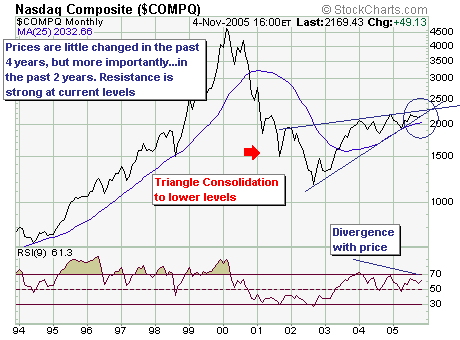
"TRIANGLE CONSOLIDATION" FOR THE NASDAQ
Taking a long-term gander at the Nasdaq Composite, I think is very clear that the time is running out for prices to rise much further than they have at present. The reason is that prices are winding their way through the "triangle consolidation"; which means two scenarios exist...
READ MORE
MEMBERS ONLY
HURRICANE RELIEF
HURRICANE RELIEF FROM STOCKCHARTS - Thanks to the support of our subscribers, StockCharts.com is donating over $20,000.00 to the Red Cross for its hurricane relief efforts for the month of September. We have also pledged a similar amount for the month of October - $5.00 for...
READ MORE
MEMBERS ONLY
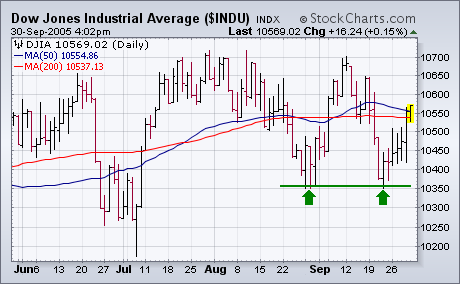
MARKET ENDS SEPTEMBER ON A STRONG NOTE
MARKET AVERAGES CLOSE BACK OVER 50-DAY LINES... The market had a lot thrown at it this month. A spike in energy prices, plunging consumer confidence, and rising long-term interest rates. It also had the month of September to deal with which has traditionally been the worst month of the year....
READ MORE
MEMBERS ONLY
Hello Fellow ChartWatchers!
This week, John reviews the market's recent performance in light of all the economic changes we've been seeing, Richard breaks out a new triangle pattern, Carl takes an in-depth look at gold, and Arthur Hill looks at the Russell 2000. Here we go......
READ MORE
MEMBERS ONLY
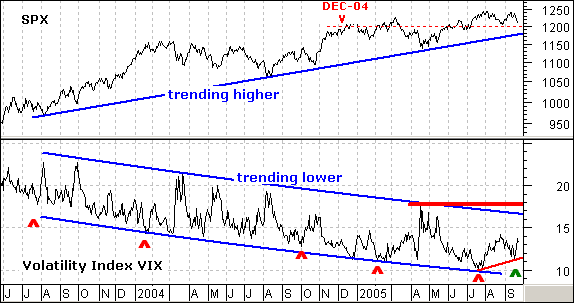
FEAR CREEPS IN
Fear is creeping into the market as the S&P 500 Volatility Index ($VIX) forms a higher low. And you thought the VIX was dead! Well, actually, it is pretty dead as volatility slows to a crawl. The VIX has been spot-on when it comes to calling market risk...
READ MORE
MEMBERS ONLY
NEW HIGHS AND NEW LOWS SIGNAL CAUTION
Since the beginning of July, 52-week new highs have been contracting with each new NYSE Composite price high, demonstrating that fewer and fewer stocks are participating in the rally. Contracting new highs by themselves are not always problematic, and can merely be a sign of an approaching correction in an...
READ MORE
MEMBERS ONLY
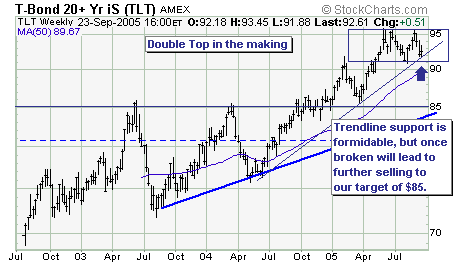
SHORT POSITIONS IN LONG-END BOND
With both Hurricane Katrina and Rita now in the history books, local, state and federal government to issue more debt will need to issue debt for reconstruction efforts and so forth. This bearish fundamental coupled with the yield curve not inverting any longer suggest the risk-reward of short positions in...
READ MORE
MEMBERS ONLY
HELP FOR HURRICANE VICTIMS
- If you are a victim of either of the gulf coast hurricanes and have been unable to access your StockCharts.com account since the storms hit, please let us know and we will credit your account for the time you have been away from the Internet. In addition, for...
READ MORE
