MEMBERS ONLY
Hello Fellow ChartWatchers!
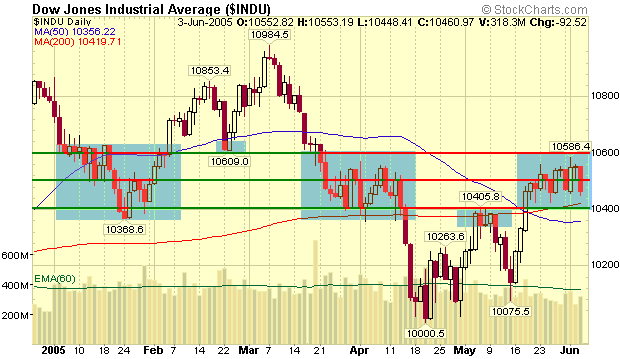
This week saw the markets move "violently sideways" as large up-days were immediately followed by similarly large down-days. Essentially, the Dow is continuing to lurch around inside of its 10,400 to 10,600 trading range. Check out how much time the Dow has spent in or around...
READ MORE
MEMBERS ONLY
NASDAQ OVERBOUGHT, BUT NOT BEARISH
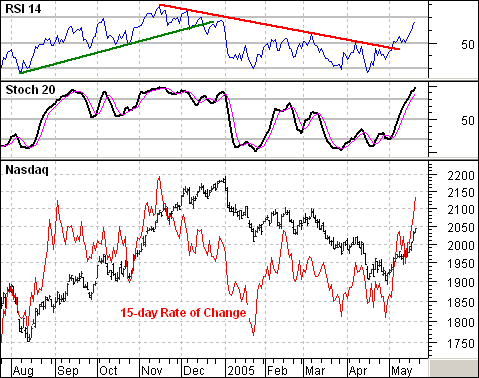
The current rally is the strongest of the year and is unlikely to disappear over night. This strength is confirmed by price movement as well as two momentum indicators. First, the 15-day Rate-of-Change surged to levels not seen since early September and mid November. Second, 15-day RSI moved to its...
READ MORE
MEMBERS ONLY
INITIATION CLIMAX?
One of Decision Point's proprietary indicators is the Participation Index (PI). It measures extreme (climactic) activity within a short-term price envelope. When a large number of stocks are participating in a particular price move (up or down), we recognize that such high levels of participation are unsustainable and...
READ MORE
MEMBERS ONLY
RECENT DECLINE IN XOI CORRECTIVE
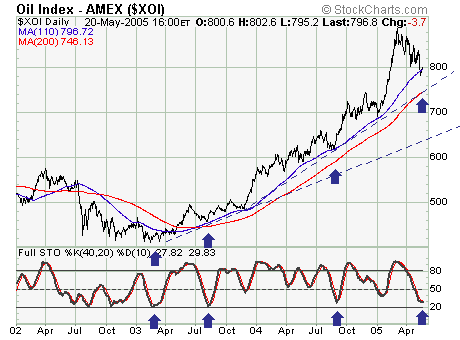
Quite simply, the recent decline in the AMEX Oil Index (XOI) appears corrective in nature; and thus one would want to be long these shares at this time as the risk-reward parameters are now favorable.
If past is prelude, and although it is not perfecta simple rhyme will do; the...
READ MORE
MEMBERS ONLY
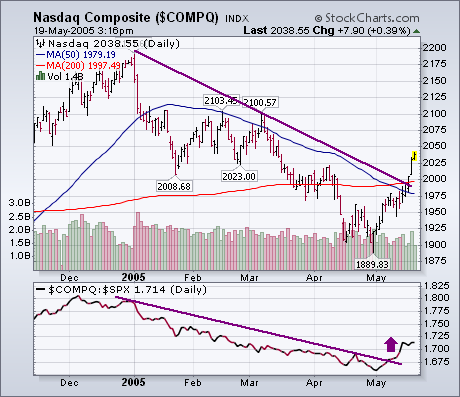
NASDAQ LEADS MARKET HIGHER...
In my view, the most significant improvement has taken place in the technology-dominated Nasdaq market. The Nasdaq Composite Index broke through its 200-day average on Tuesday and has broken its 2005 down trendline. Its relative strength line has turned up relative to the S&P 500 . That's...
READ MORE
MEMBERS ONLY
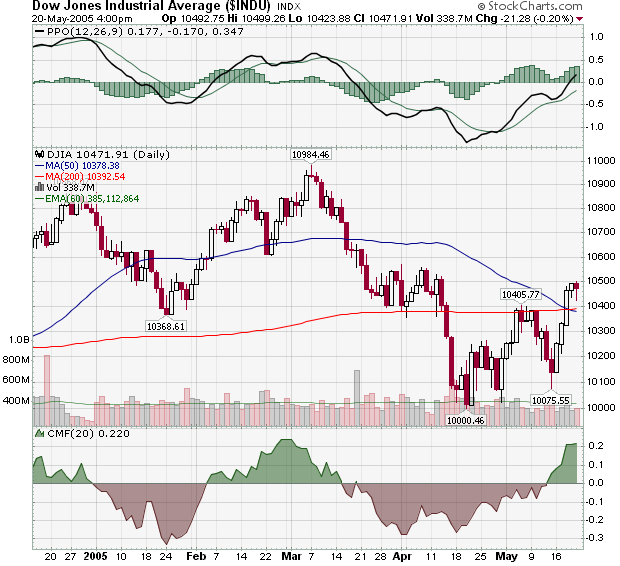
Hello Fellow ChartWatchers!
It took a couple of big days to get the Dow back above the 10,400 level but last week's reaction rally has managed to do the trick and allowed the Dow to finish at 10,471. But will it last? The technical signs aren't convincing:...
READ MORE
MEMBERS ONLY
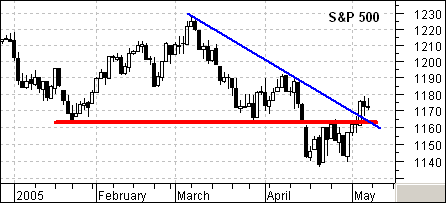
THE LEADERS AND THE LAGGARDS
The S&P 500 can do it, but the Nasdaq and the Small-caps can't do it. Or at least not just yet. Led by Finance, the S&P 500 broke above its late April high and resistance at 1165. However, the Nasdaq and S&P...
READ MORE
MEMBERS ONLY
VOLATILITY STILL HISTORICALLY LOW
The CBOE Volatility Index (VIX) is a measure of the implied volatility of SPX index options. (According to the CBOE web site, "volatility is a measure of the fluctuation in the market price of the underlying security.") As a practical matter, the VIX measures the amount of fear...
READ MORE
MEMBERS ONLY
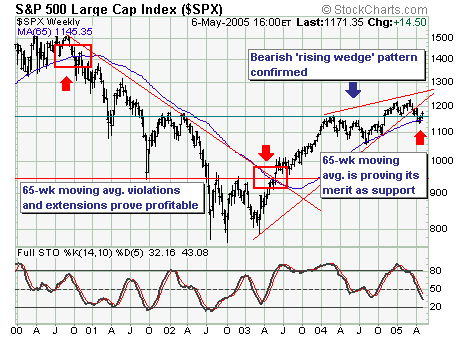
A SIMPLE ROADMAP
From a structural and fundamental point-of-view, things are bearish right now; however, the technical and sentiment action surrounding recent price gains is quite constructive; thus a larger rally appears underway. We are bullish but only insofar as the 65-week moving average of the S&P 500 holds at the...
READ MORE
MEMBERS ONLY
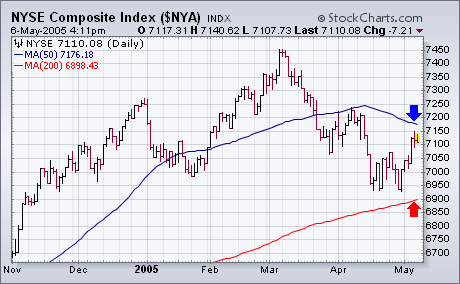
A LOOK AT THE NYSE COMPOSITE INDEX ...
Every time I write about a certain stock market index, I'm asked why I don't write about some of the others. I generally try to spread my coverage around to all the major stock indexes, but can't cover them all at once. I also...
READ MORE
MEMBERS ONLY
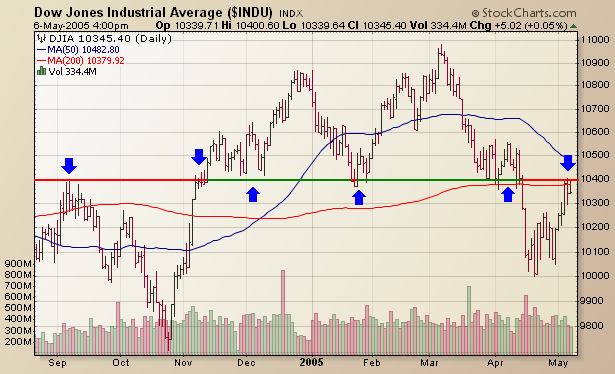
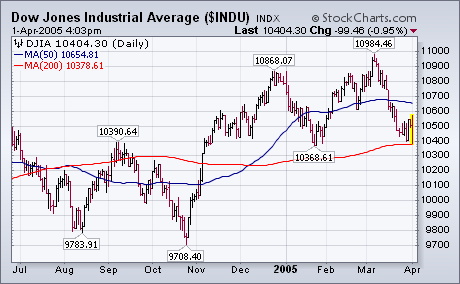
Hello Fellow ChartWatchers!
After its big drop in mid-April, the Dow has rallied back to a classic resistance level now: 10400. Just look at the chart:
This is one of those "support-becomes-resistance" levels that has had a big impact on the market in the past (blue arrows) and will probably continue...
READ MORE
MEMBERS ONLY
DOWNSIDE TARGET FOR THE NASDAQ
The current pattern at work in the Nasdaq looks quite similar to prior patterns for the S&P 500 and Dow Transports. Both of these indices had extended advances, failed to hold a breakout to new highs, broke trendline support and then continued to support from the prior low...
READ MORE
MEMBERS ONLY
S&P 600 SMALL-CAP NEW HIGHS and NEW LOWS
At DecisionPoint.com we have recently added a chart of S&P 600 Small-Cap 52-week new highs and new lows (NHNL). (We also have NHNL charts of the S&P 500, S&P 400 Mid-Cap, NYSE, and Nasdaq). This allows us to examine and determine the condition...
READ MORE
MEMBERS ONLY
"MINI-CRASH" FOR THE NASDAQ
From Tuesday's close last week; the Nasdaq Composite ($COMPQ) has declined in mini-crash' fashion: down -4.8%. The question is whether there are further declines ahead or whether a sustainable rally will develop back towards the highs or even new highs. An instructive chart to this end...
READ MORE
MEMBERS ONLY
HOW FAR DOWN?
After this week's breakdown, there can be little doubt that the cyclical bull market that started in October 2002 has ended. The question now is how far down can the market drop. The daily bars in the chart below show the S&P 500 SPDR breaking its...
READ MORE
MEMBERS ONLY
Hello Fellow ChartWatchers!
With the markets down for the past three days, the Internet is all abuzz with predictions and prognostications about what's going to happen next. As you try to sort it all out, remember that charts don't lie. Charts don't have an agenda. And charts...
READ MORE
MEMBERS ONLY
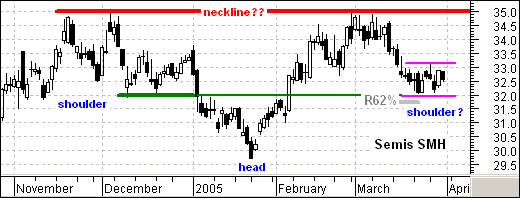
SEMIS NEED HELP
It remains a one horse race among the key Nasdaq industry groups. The Networking iShares (IGN), Software HOLDRS (SWH) and Internet HOLDRS (HHH) are weak and trading near their lows for the year (gray oval). However, the Semiconductor HOLDRS (SMH) are holding up the best and still well above their...
READ MORE
MEMBERS ONLY
CASH FLOW SENTIMENT GAGE
The Rydex Asset Ratio measures the amount of bullish and bearish sentiment by tracking and comparing the total assets in Rydex bull and bear funds. Decision Point also calculates the Rydex Cash Flow Ratio, an indicator we developed that accounts for the actual cash flowing into and out of the...
READ MORE
MEMBERS ONLY
WHAT YOU DIDN'T NOTICE LAST WEEK -
Did you know that our primary datafeed circuit went out last week? Betcha' didn't even notice. The reason is that our secondary circuit immediately kicked in and kept everything running smoothly. Prior to last fall's datafeed upgrade, that would not have happened and the site...
READ MORE
MEMBERS ONLY
BAD NEWS FOR ECONOMICS, DOW THREATENING LOW
THE ECONOMIC NEWS ISN'T GOOD ... It's interesting to see the media put a positive spin on recent economic reports. It was reported this week that fourth GDP growth was lower than expected while prices were higher than expected. That was described as good for the economy....
READ MORE
MEMBERS ONLY
Hello Fellow ChartWatchers!
With the Dow getting ready to test its January lows, things are really getting busy here at StockCharts. Our market commentators have all the market angles covered below, so I wanted to take a couple of minutes and update you on our progress with SharpCharts2 - our soon-to-be-released replacement for...
READ MORE
MEMBERS ONLY
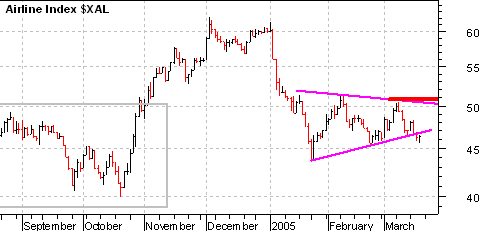
AIRLINES UNDER PRESSURE
With the surge in oil prices over the last three months, the Amex Airline Index (XAL) remains under pressure. After a sharp decline in January, the index consolidated with a symmetrical triangle. The recent break below the lower trendline is certainly negative and further weakness below the February low (45)...
READ MORE
MEMBERS ONLY
LOOKING FOR A CRB TOP
The title of this article, Looking for a CRB Top , has been my broken record for the last year or so, but it just hasn't happened so far.
I use the monthly price chart and PMO ( Price Momentum Oscillator ) to determine when long-term price reversals may be approaching....
READ MORE
MEMBERS ONLY
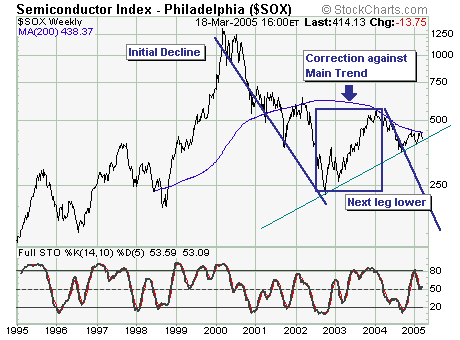
SHORTING THE SOX
Today we expand a bit with 2 charts; with our contention that selling short the Semiconductor Index ($SOX) and several individual names has a high probability of success in the months ahead.
Looking at the $SOX, it is trading within a not yet complete' decline that began in 2000,...
READ MORE
MEMBERS ONLY
SITE NEWS:
SHARPCHARTS2 BETA 6 - As Chip said above, we are focused on finishing up the work on SharpCharts2 as soon as possible. Check out his comments above for more details.
DECISIONPOINT.COM'S NEW LOOK - OK, OK, so it's not news about StockCharts.com. Still, it...
READ MORE
MEMBERS ONLY
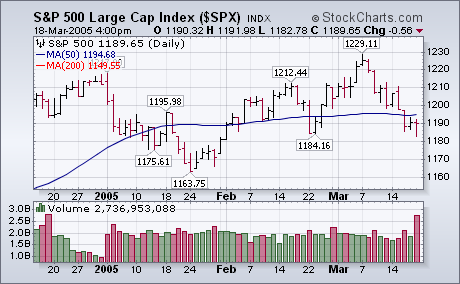
DON'T MIND THE BIG VOLUME
Most of the major market averages closed in the red today, but only marginally. After trading down most of the day, the S&P 500 closed with a loss of less than a point. The S&P also held at its late February low at 1184. While the...
READ MORE
MEMBERS ONLY
Hello Fellow ChartWatchers!
Things are jumping here at StockCharts. With the upcoming release of the next version of our main charting tool, I've been way too busy to watch the market closely. Fortunately, our crack team of market commentators has been on the case and you can find their bi-weekly dispatches...
READ MORE
MEMBERS ONLY
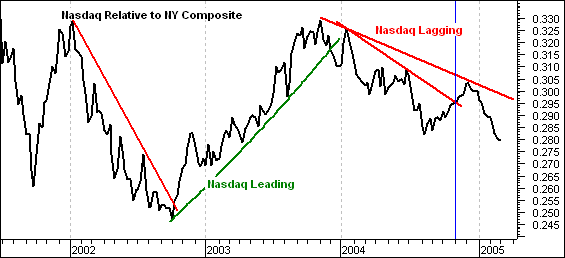
NASDAQ VERSUS NEW YORK
This chart shows the performance of the Nasdaq relative to the NYSE Composite. The market as a whole usually does better when the Nasdaq leads (green trendlines) and worse when the Nasdaq lags (red trendlines). Even though the NYSE Composite is performing well in the face of Nasdaq weakness, it...
READ MORE
MEMBERS ONLY
DVY: DIVIDEND-PAYING ETF
Many ETFs (Exchange Traded Funds) pay dividends, but only one is devoted to dividend-paying stocks -- the Dow Jones Select Dividend Index Fund (DVY). As the name implies, this ETF is derived from the Dow Jones Select Dividend Index ($DJDVY), an index constructed and maintained by Dow Jones.
The Index...
READ MORE
MEMBERS ONLY

LONG TERM WEDGE PATTERN LOOMING
The recent rally to new yearly highs hasn't materialized in all the major indices. In fact, the Nasdaq Composite has lagged rather badly; thus it is either 'poised to catch up' or it will become the leaders once the cyclical bull market ends. We dont know...
READ MORE
MEMBERS ONLY
SHARPCHARTS 2 ROAD MAP
- We are getting close to the final release of our new charting engine called SharpCharts2. But before we make SharpCharts2 the "official" charting engine on our website, we have to make sure that it is rock solid. To do that, we've been releasing better and...
READ MORE
MEMBERS ONLY

ELLIOTT WAVE UPDATE
LOOKING FOR 62% RETRACEMENT AT 1250 ... With the S&P 500 having broken out of its recent trading range, and trading at the highest level in more than three years, it's time to revisit my earlier Elliott wave interpretation and came up with some possible upside price...
READ MORE
MEMBERS ONLY
Hello Fellow ChartWatchers!
We are super busy preparing the new release of our SharpCharts2 charting engine (see the "Site News" section below for more details). That means I haven't been paying much attention to the market recently. Fortunately, John, Carl, Richard, and Arthur have been, so let's...
READ MORE
MEMBERS ONLY
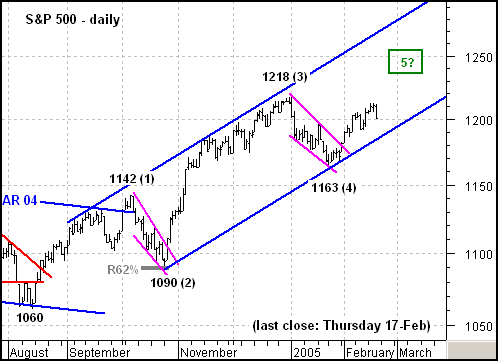
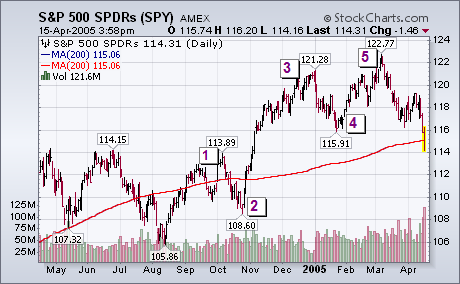
S&P 500 AND ELLIOTT WAVE
The S&P 500 remains in bull mode and continues to outperform the Nasdaq 100. In Elliott terms, the index has taken on a 5-Wave structure since mid August. Wave 1 extends up to 1142, Wave 2 declined to 1090, Wave 3 advanced to 1218 and Wave 4 fell...
READ MORE
MEMBERS ONLY
APPLE: CAN YOU SAY "PARABOLIC?" TWICE?
Investors love the Apple (AAPL) "story" and they are driving he stock's price into a vertical ascent. When a stock arcs into an ever-increasing angle of ascent it is called a parabolic rise. "Investors" get into a feeding frenzy, causing the price rise to...
READ MORE
MEMBERS ONLY
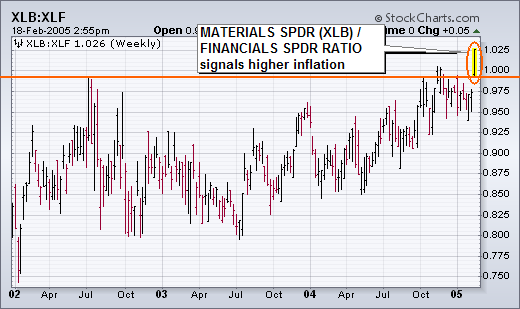
THE SCALE HAS TIPPED TOWARDS INFLATION
At the New York Expo last weekend, Martin Pring made the case that the battle between the forces of deflation and inflation had reached a critical inflection point. In other words, his charts showed that the deflation/inflation scale was about ready to tip in one direction. He arrived at...
READ MORE
MEMBERS ONLY
Hello Fellow ChartWatchers!
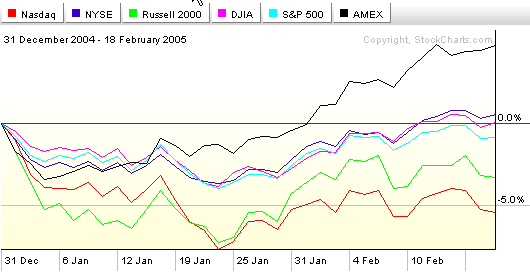
2005 is well underway now and some important technical trends are developing on the year-to-date charts.
As you can see on this PerfChart, since the start of the year, the energy-heavy AMEX index has outperformed the other benchmarks significantly. The Dow, the NYSE, and the Large-Caps are clustered around the...
READ MORE
MEMBERS ONLY
DIVIDE AND CONQUER
To understand the Nasdaq and Nasdaq 100, it is important to look at the individual parts. These two indices can be broken down into four key industry groups: semiconductors (SMH), networking (IGN), software (SWH) and internet (HHH). While retail, telecom, hardware, biotech and other industry groups certainly play a part,...
READ MORE
MEMBERS ONLY
THE DECENNIAL PATTERN (YEARS ENDING IN 5)
The Decennial Pattern refers to the fact that years ending in the number five (5) are up years for the stock market. This is not just a statistical tendency. In fact, this has been the case for every year ending in 5 since 1885. Furthermore, the price low for these...
READ MORE
MEMBERS ONLY
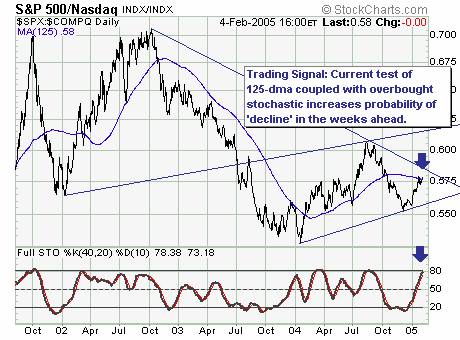
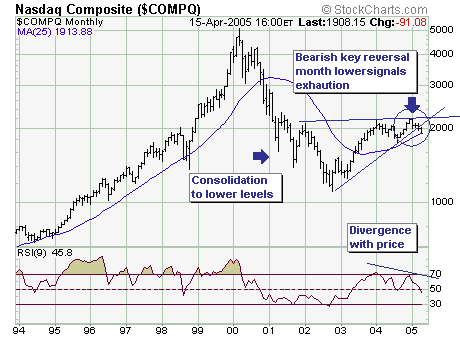
MARKET RALLY IMPRESSIVE, POSES NEW QUESTIONS
Last week's market rally was impressive to be sure. Now, the question whether the decline off the early January highs are in fact intermediate-higher or more short-term in nature. Previously, we postulated the monthly key reversals' in the major indices put them in a position to decline...
READ MORE
