MEMBERS ONLY
SHARPCHARTS 2 "BETA 5" NOW AVAILABLE!
A "Beta" release is a preview / testing version of a new piece of software. We've received great feedback from our users about our previous four Beta versions of our new SharpCharts 2 charts. Now it's your turn. Check out the latest Beta version and...
READ MORE
MEMBERS ONLY
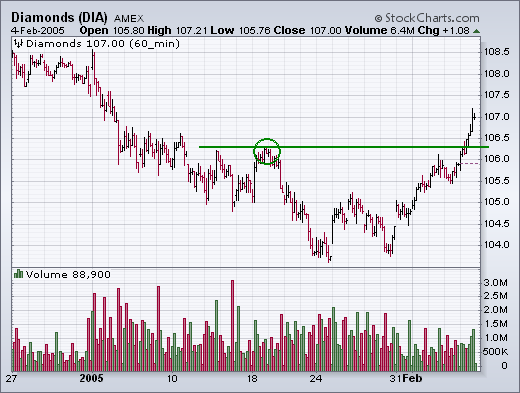
DOW AND S&P BREAK BARRIERS, MARKET IN FIFTH WAVE
DOW AND S&P 500 CLEAR RESISTANCE BARRIER... The hourly bars for the Dow Diamonds and the S&P 500 SPDR show both having cleared initial resistance at their mid-January highs. [Both also closed back over their 50-day moving averages]. Small cap indexes accomplished that earlier in the...
READ MORE
MEMBERS ONLY
Hello Fellow ChartWatchers!
As you may have noticed, once again we are able to send out the newsletter in HTML format thanks to the good people at ConstantContact.com. We hope you enjoy the convenience of having the entire newsletter in your inbox rather than having to click a link to see it....
READ MORE
MEMBERS ONLY
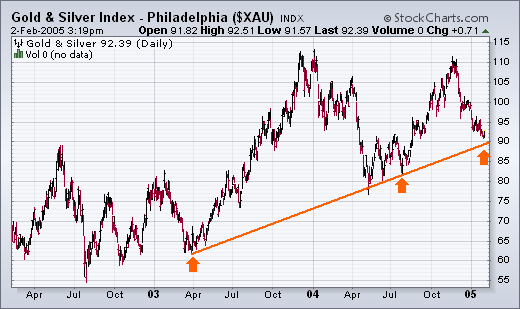
GOLD STOCKS STILL TESTING LONG-TERM SUPPORT - TAKING WHAT THE MARKET GIVES US
GOLD INDEX STILL TESTING TRENDLINE SUPPORT... Back on January 10, I wrote about the Gold & Silver Index (XAU) being in a support zone defined by the rising trendline shown in Chart 1. The trendline starts in April 2003 and is drawn under the April/July 2004 lows (see arrows)...
READ MORE
MEMBERS ONLY
Hello Fellow ChartWatchers!
Today we have a special mid-week edition of ChartWatchers for you. Yesterday, John Murphy published a column and the long term outlook for Gold and the Market as a whole. The column received a very large number of positive comments from his subscribers and we thought we'd share...
READ MORE
MEMBERS ONLY
WHO STARTED THIS MESS ANYWAY?
January and 2005 have not been good for the bulls. After a strong finish in 2004, stocks were hit with strong selling pressure to begin the year and have yet to recover. A look into November and December reveals early weakness in two key groups. More importantly, traders can turn...
READ MORE
MEMBERS ONLY
OEX PUT/CALL RATIO SAYS BOTTOM NEAR
The Equity and OEX Put/Call Ratios generally signal overbought and oversold conditions that help identify price tops and bottoms; however, sometimes the OEX Put/Call Ratio will invert relative to the Equity Put/Call Ratio. At these times the inversion signals the opposite of what we would normally expect....
READ MORE
MEMBERS ONLY
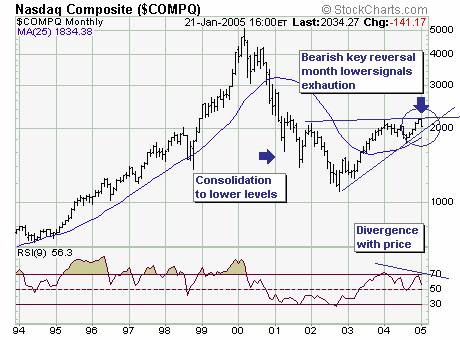
JANUARY DECLINE GAINING IMPORTANCE
The January decline to date is gaining in importance; if prices remain at current to lower levels through the next six trading sessions then a bearish key reversal month' will form. This would signal exhaustion' of the uptrend, with any and all rallies considered selling opportunities. The last...
READ MORE
MEMBERS ONLY
THE BUILD OUT CONTINUES
THE BUILD OUT CONTINUES - In 2004, StockCharts.com spent over $750,000 on improving our technology infrastructure - things like servers, routers, switches, data, and all the things it takes to get you the best charts on the web as quickly as possible. We're not done yet...
READ MORE
MEMBERS ONLY
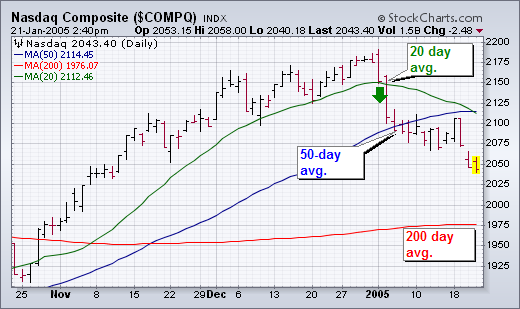
WHY I PREFER THE 50-DAY AVERAGE ...
The 20-day average is usually too short for my purposes which is to spot bigger trend changes (although it is the period used in Bollinger Bands). At the same time, the 200-day average is too long. Imagine holding a long position in the market waiting to see if it breaks...
READ MORE
MEMBERS ONLY
Hello Fellow ChartWatchers!
The market finished last week with three big down days. So far this year, the Nasdaq is down 6.5%. Much of the fall has been driven by Small Cap stocks as the S&P 500 Large Caps is only down 3.6% during the same period. As John...
READ MORE
MEMBERS ONLY
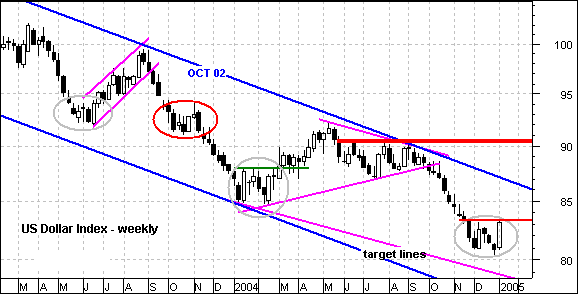
US DOLLAR
The Dollar may be giving us something to talk about.... and possibly even worthy of a short-term play. The US Dollar Index has consolidated for 4-5 weeks and formed long white candlesticks twice. These show strong buying pressure and, at the very least, reinforce support just above 80.
Notice that...
READ MORE
MEMBERS ONLY
SENTIMENT: A SUDDEN ATTITUDE ADJUSTMENT
There has been a lot of concern among analysts that sentiment has been too bullish; however, the recent correction has done a lot to alleviate that condition.
The American Association of Individual Investors (AAII) performs an electronic sentiment poll every week. The cutoff is Wednesday and the results are published...
READ MORE
MEMBERS ONLY
OUTPERFORMING THE INDICES IN 2005
Last week's stock market correction was significant in our opinion; for the technical patterns suggest the correction will continue in the weeks ahead. But more significant in the fact that if the correction extends sufficiently below certain levelsthen the entire rally cycle off the October-2002 is complete.
First...
READ MORE
MEMBERS ONLY
S&P GIVES FIRST WEEK WARNING
The S&P 500 ended the week with a loss of nearly 30 points (-2.4%). According to the historical record since 1950, a down close during the first week of January by the S&P 500 has resulted in a down year 45% of the time. A...
READ MORE
MEMBERS ONLY
Hello Fellow ChartWatchers!
Our first issue of 2005 kicks off with a great summary of the recent S&P action by John Murphy. Richard Rhodes then looks at last week's correction. Carl Swenlin examines the recent change in investor sentiment and Arthur Hill wraps things up with a look at...
READ MORE
MEMBERS ONLY

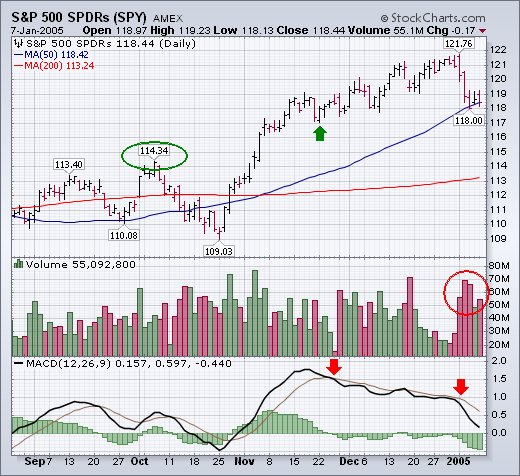
EARLY VOLUME SURGE
It is shaping up to be a banner month for December volume. On this chart, the vertical black line shows the beginning of December, the red line the end of December (D) and the green line the end of January (J). Over the last three years, there was strong volume...
READ MORE
MEMBERS ONLY

DOLLAR TRYING TO BOTTOM
The daily chart of the US Dollar Index shows that the dollar is trying to put in a bottom. The encouraging signs are that the 9-year low earlier this month survived a sharp retest this week, the index has broken above the short-term declining tops line, and there is a...
READ MORE
MEMBERS ONLY

Long-term Oil vs. Gold
Today we take a very long-term look at the relative valuation of integrated oil-related shares in comparison to gold shares ($XOI/$HUI). After the very long rise in gold shares in both absolute and relative terms; we find the present time is opportune to prune back long gold holdings and...
READ MORE
MEMBERS ONLY

RATES SHOULD BE MOVING HIGHER
This time last year I wrote about my expectation for long-term interest rates to start moving higher during 2004. I got it only half right. They moved higher during the first half, but then fell back during the second half. It looks like bond yields will end the year pretty...
READ MORE
MEMBERS ONLY
Hello Fellow ChartWatchers!
Chip's personal message goes here, talking about what John Murphy, Richard Rhodes, Carl Swenlin and the rest of the gang have to say in this issue. This segment should be limited to a couple sentences... we want to keep people engaged with concise text that is valuable and...
READ MORE
MEMBERS ONLY
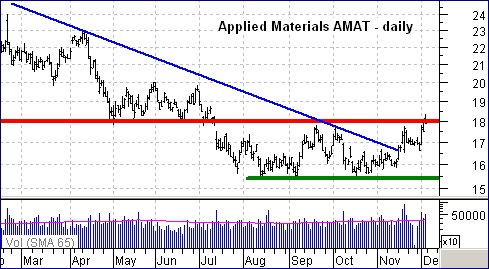
DIVERGENCES WITHIN THE SEMICONDUCTOR GROUP
While the Nasdaq trades near a 52-week high, the Semiconductor HOLDRS (SMH) remains well below its Jan-04 high and has shown relative weakness over the last few months. There is also a split within the group as Applied Materials challenges resistance and Micron Technology (MU) tests support. Until both get...
READ MORE
MEMBERS ONLY
WEAK CASH FLOW PRECEEDS PRICE DECLINES IN PRECIOUS METALS STOCKS
When there is weak cash flow into Rydex Precious Metals Fund it is a fairly reliable warning to expect price weakness in the short-term, and sometimes the corrections can be quite severe.
As a general rule we expect cash flow to more or less follow prices -- when prices are...
READ MORE
MEMBERS ONLY
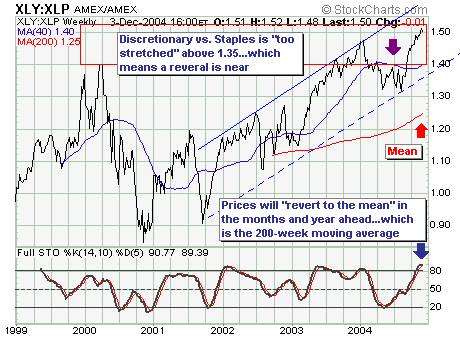
CONSUMER DISCRETIONARY VS. STAPLES
Today we look at the high relative valuation of Consumer Discretionary vs. Staples stocks. Current levels have not been seen; at the 2000 high in which the bubble burst', the ratio stood near 1.40. We believe that this stretched valuation' argues for one to reassess their portfolios...
READ MORE
MEMBERS ONLY
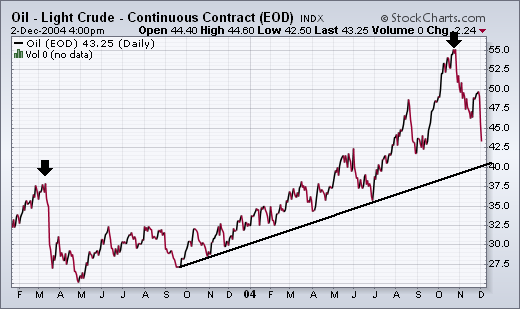
LONGER-TERM IMPLICATIONS FOR STOCKS
The last paragraph in the September 23 report carried the headline: LONG TERM IMPLICATIONS FOR STOCKS AREN'T GOOD. To repeat what I wrote then, "An October pullback in oil would probably be helpful to the stock market during the fourth quarter. The ability of oil to stay...
READ MORE
MEMBERS ONLY
Hello Fellow ChartWatchers!
Happy Holidays! Welcome to this special holiday edition of ChartWatchers! This time around John explains why $40 is such an important number of Oil prices, Richard explains why he'd buy Coke but sell McDonalds, Carl has a chart that explains while Precious Metal prices are headed lower, and...
READ MORE
MEMBERS ONLY
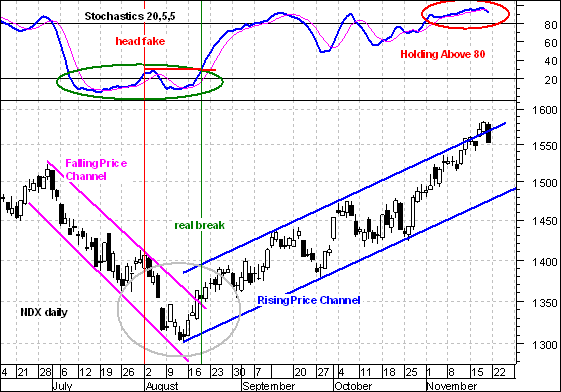
CATCHING A TURN WITH STOCHASTICS
For an idea of how a FUTURE trend reversal might look, traders may wish to focus on the August low and think inverted.
The July-August downtrend was defined by a falling price channel and a Stochastic Oscillator below 20. Notice that the Stochastic Oscillator moved above 20 for a few...
READ MORE
MEMBERS ONLY
MEASURING PARTICIPATION
The market has finally broken out of the 2004 trading range, but many people are worried that the move could be a bull trap. One way to judge the authenticity of a move is to see how many stocks and/or sectors are participating in it. To do this we...
READ MORE
MEMBERS ONLY
RECENT RALLY IS SUSPECT
The recent rally to new highs in the S&P 500 large cap, S&P 400 mid-cap and S&P 600 small -cap is suspect. While higher prices may be offing in the near-term, we believe this rally could be terminal in nature given several divergences are...
READ MORE
MEMBERS ONLY
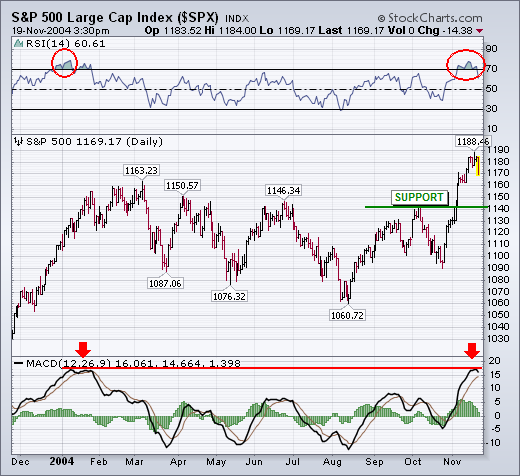
LOOKING FOR S&P 500 SUPPORT LEVELS
The daily chart for the S&P 500 for the last year pretty much tells the tale. The trend is still up. But its 14-day RSI line is in overbought territory for the first time since last January. Its daily MACD lines are also up against their early 2004...
READ MORE
MEMBERS ONLY
Hello Fellow ChartWatchers!
Law #11: KEEP LEARNING
Law #11: Technical analysis is a skill that improves with experience and study. Always be a student and keep learning. - John Murphy
This may be THE most important law of all. The instant you think you've learned everything there is to know about...
READ MORE
MEMBERS ONLY
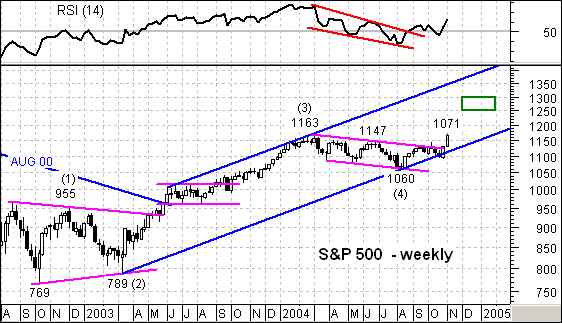
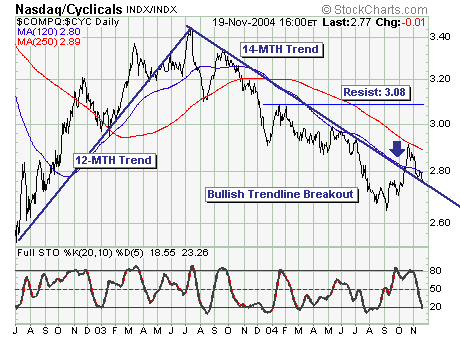
S&P 500 TAKES THE LEAD
For once, the S&P 500 is stronger than the Nasdaq 100 as the index has already broken above its 2004 high (1163). The overall pattern looks like an Elliott 5-Wave advance and the 2004 decline formed Wave 4. In addition, this decline looks like a falling flag that...
READ MORE
MEMBERS ONLY
RELATIVE TO 52-WEEK HIGH/LOW (Rel to 52)
While it is widely reported when a stock is hitting a new 52-week high or low, I've always been curious as to where stocks are in relation to their 52-week range the rest of the time. To determine this I developed the "Rel to 52" scale....
READ MORE
MEMBERS ONLY
TOO EARLY FOR THE ALL CLEAR' BELL
Two weeks prior, a major bullish key reversal' higher developed in the S&P 500 Index; this led to Friday's new relative high. Given this, proper sector' positions are required to take full advantage of racing with the strongest'. In the past this meant...
READ MORE
MEMBERS ONLY
NEW ARTICLES IN CHARTSCHOOL, NEW BOOKS
IS THERE A GAP IN YOUR ANALYSIS? - A new article has been added to ChartSchool that covers the four main gaps and what they mean. Click Here to view the article. Give us feedback on what you think of this article about gaps. Other articles that have been added...
READ MORE
MEMBERS ONLY
Hello Fellow ChartWatchers!
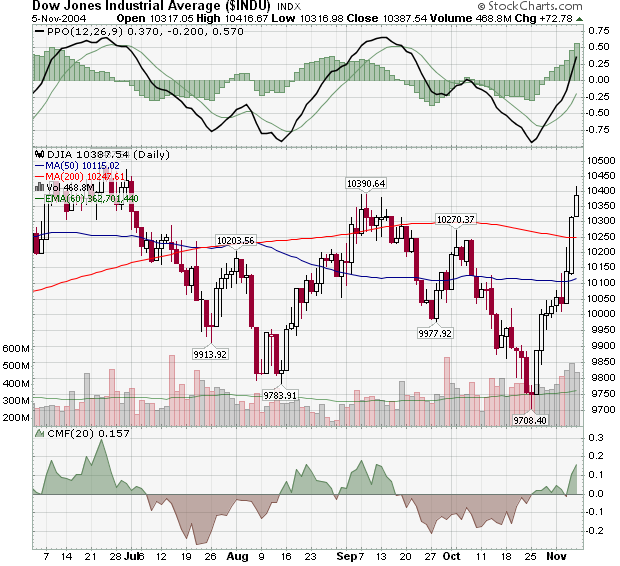
Nothing helps the markets like a lack of uncertainty. With the election resolved quickly, a big relief rally got underway on Wall Street with the Materials, Energy and Consumer Staples sectors posting the biggest gains. Let's go to the charts:
Notice on the daily Dow chart above that...
READ MORE
MEMBERS ONLY
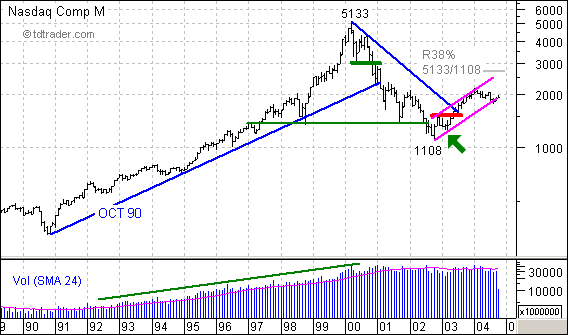
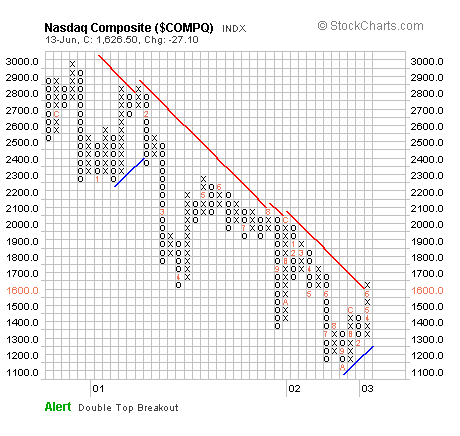
NASDAQ MONTHLY
Monthly charts are good for perspective and some projections. First, you can see that both volume and the index steadily advanced from 1991 to 2000. Volume has leveled out over the last 4-5 years, while the index suffered a sharp decline to 1108. The recovery over the last two years...
READ MORE
MEMBERS ONLY
THE SPX/VIX RATIO
An indicator that has recently become quite popular is the SPX/VIX Ratio. I have tried to convince two of its proponents that it is a calculation that makes no sense, but to no avail. Nevertheless, I will present my argument here for your assessment.
Ratio calculations are most commonly...
READ MORE
MEMBERS ONLY
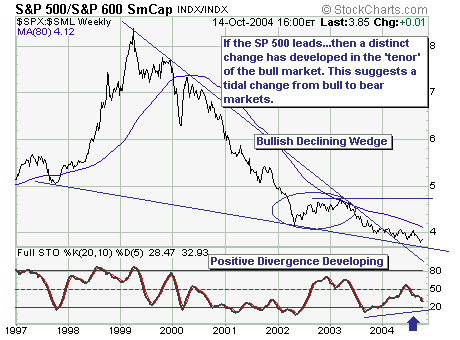
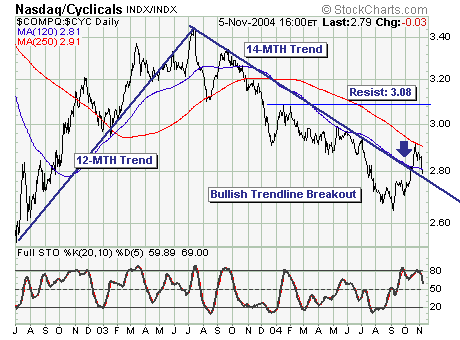
THE 'WINDS ARE A CHANGIN'
For all intents and purposes, the cyclical bull market that began in March-2003; and during the entire move to higher prices - S&P 500 Large Cap index performance 'lagged' that of the S&P 600 Small Cap index. However, the 'winds are a changin&...
READ MORE
MEMBERS ONLY
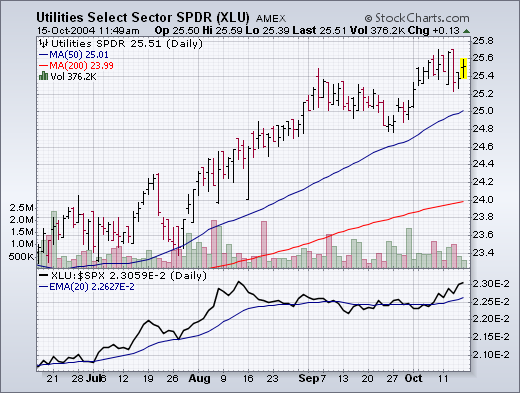
ROTATION OUT OF ENERGY AND MATERIALS
The biggest market feature of the week was the fact that Energy and Materials were the two weakest sectors. This is a reversal of recent trends. The loss of leadership by those two former leaders contributed to this week's market selling. At such times, money moving out of...
READ MORE
