MEMBERS ONLY
Hello Fellow ChartWatchers!
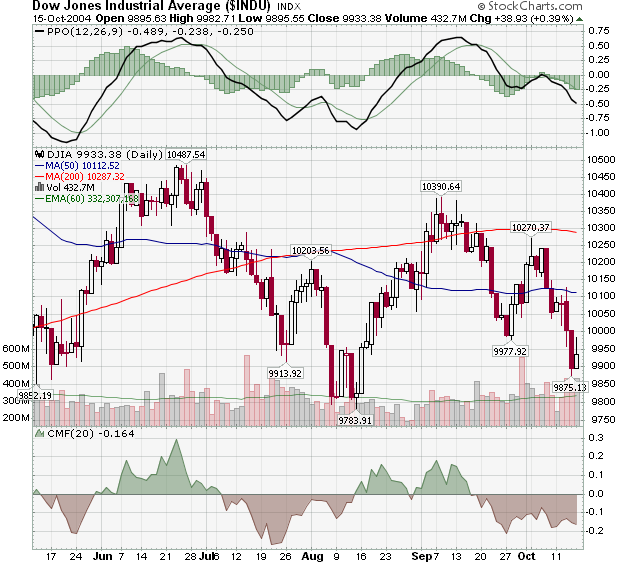
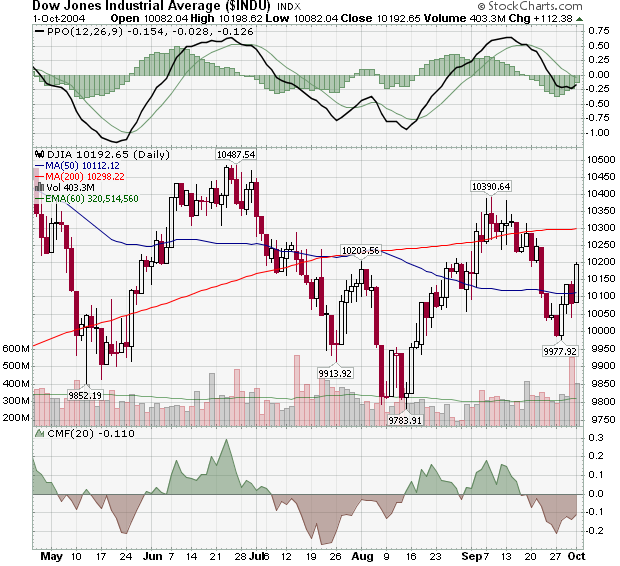
Last time we talked (on October 2nd) there was reason for optimism with the Dow. Oh, how times have changed...
Unfortunately for the bulls, the promising uptrend that was created by the trough at 9,977 didn't fully materialize. After flirting with the red 200-day MA line around...
READ MORE
MEMBERS ONLY
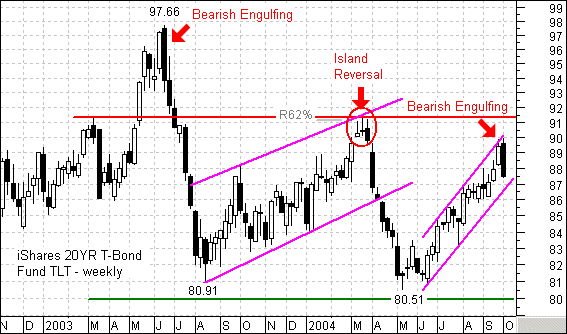
TLT IS LOOKING OVER THE CLIFF AGAIN
It's beginning to look like déjà vu all over again for the iShares Lehman 20+ Year T-Bond Fund (TLT). This bond ETF has been in a steady uptrend 20+ since May as rates have fallen. May just happens to coincide with the Fed's first interest rate...
READ MORE
MEMBERS ONLY

THE 9-MONTH CYCLE
We are currently expecting a price low associated with the 9-Month (40-Week) Cycle, but let's first review some cycle basics.
The vertical lines show the location of all Nominal 9-Month Cycle troughs since 1996. The normal expectation is that the price index will arc from trough to trough,...
READ MORE
MEMBERS ONLY
RELUCTANTLY BULLISH
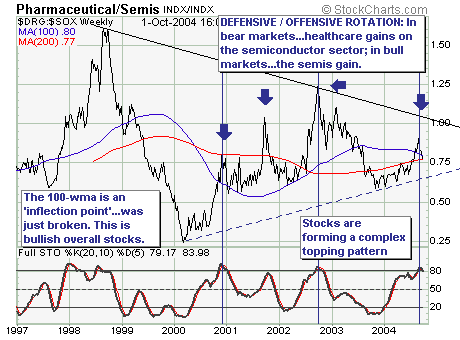
Our comments will be quite short and to the point: In bull markets the more aggressive' semiconductor sector leads the more defensive' healthcare sector as market participants favor stocks with higher betas' in order to increase performance. Over the past several weeks, that is exactly what has...
READ MORE
MEMBERS ONLY
NEW BOOKSTORE SECTION, SURVEYS, AND NEWSWEEK!
NEW BOOKSTORE SECTION - We just started a BARGAIN BOOKS section in our bookstore. You will find a number of good books on charting and analysis at great discounts. You will always find books that are discounted at least 45% from their retail price. Take a look, there is a...
READ MORE
MEMBERS ONLY
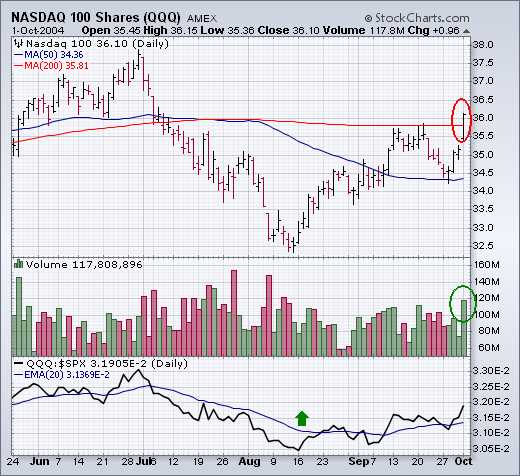
4TH QUARTER RALLY, AND WHY NASDAQ LEADERSHIP IS IMPORTANT
NASDAQ 100 TOPS 200-DAY LINE... One theme I keep repeating is the need for Nasdaq leadership during any fourth quarter rally. I'm happy to report that on the first day of the fourth quarter the Nasdaq 100 led a very impressive market rally that could carry through the...
READ MORE
MEMBERS ONLY
Hello Fellow ChartWatchers!
There's some good news on the Dow chart this week. Despite Thursday's Merck-induced dip, the index moved higher on Friday and solidified last Tuesday's reversal at the 9977 level. That reversal was very significant as it was the first step in establishing a new...
READ MORE
MEMBERS ONLY
CYCLICALS OUTPERFOMING STAPLES
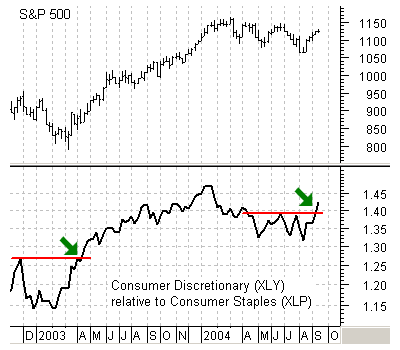
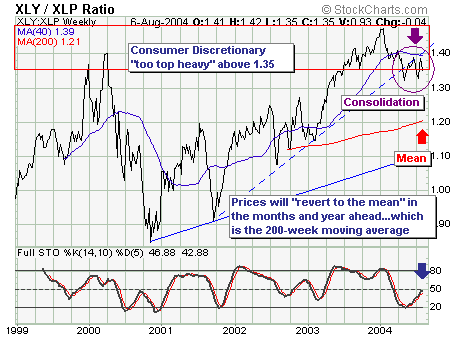
There is a most interesting development between the Consumer Discretionary SPDR (XLY) and the Consumer Staple SPDR (XLP). Relative to the S&P 500, Consumer Discretionary stocks (cyclicals) surged (green arrow) over the last few weeks while Consumer Staple stocks declined (red arrow). Weakness in staples and strength in...
READ MORE
MEMBERS ONLY
A LONGER-TERM MARKET VIEW
Daily charts can be used to fine tune entry and exit points, but they should be interpreted within the context of what weekly charts and indicators tell us. For example, some shorter-term indicators show the market to be overbought, but the weekly chart implies that another leg of the bull...
READ MORE
MEMBERS ONLY
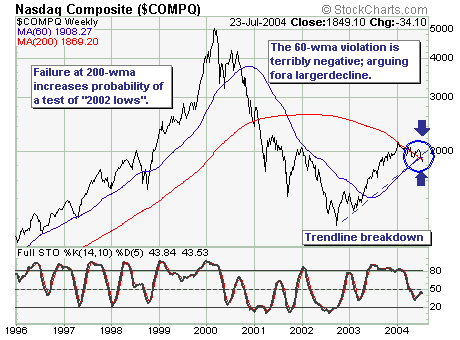
TIME TO SHORT TECH SHARES?
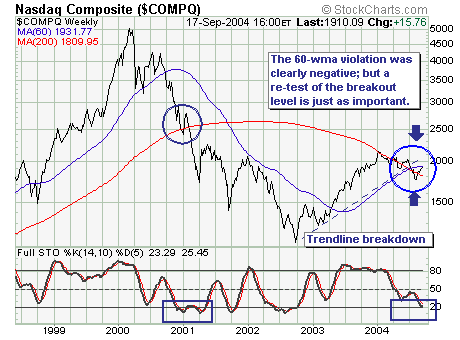
The current Nasdaq Composite rally is at an inflection point much in the same manner it was during the week of July 14th as prices slid to new yearly lows. The simple indicator we are looking at is the 60-week moving average, which in the past has an enviable record...
READ MORE
MEMBERS ONLY
BUZZING ABOUT MURPHY
MURPHY SURVEY RESULTS - Last week we conducted a customer satisfaction survey for the Murphy Market Message. As a direct result of that survey, we've added a couple of new features to the "John Murphy" section of our site including a "Comments" box that...
READ MORE
MEMBERS ONLY
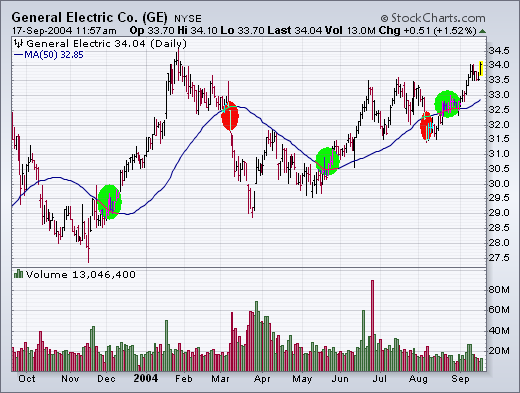
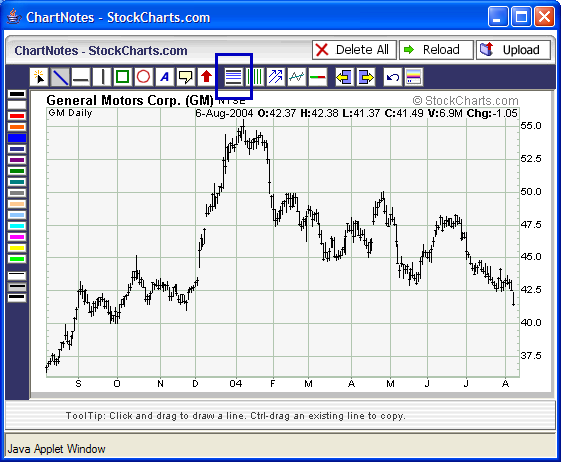
ON USING MOVING AVERAGES
WHY WE USE MOVING AVERAGES ... You've probably noticed that I rely very heavily on moving average lines. There are some good reasons for that. The main one is that they are one of the simplest ways to spot trend changes. But not all moving averages are equal. The...
READ MORE
MEMBERS ONLY

Hello Fellow ChartWatchers!
We had some good response to last issues do-it-yourself approach to analyzing the Dow chart so let's try it again. Ready? Study the chart below and decided for yourself if it is bullish or bearish and why:
My take is that this chart looks pretty bearish right now....
READ MORE
MEMBERS ONLY
A "NEW AND IMPROVED" RYDEX RATIO
The Rydex Asset Ratio has been around for eight or ten years, and it is a favorite among sentiment indicators because it is based, not upon opinion polls, but upon where people are actually putting their money. It is calculated by dividing total assets in bear index and money market...
READ MORE
MEMBERS ONLY
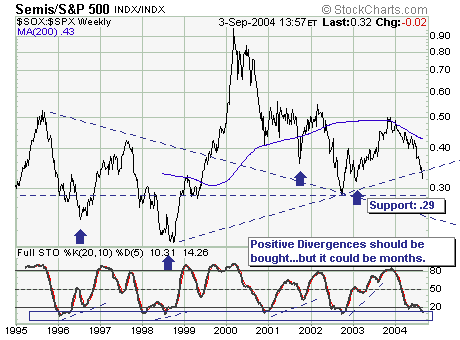
SEMIS NOT THE LEADERS THEY ONCE WERE
The recent carnage in the Semiconductor Index (SOX) moved to the forefront on Friday with INTC's poor guidance moving forward. Thus, we must look at the SOX within the context of its relationship with the S&P 500 (SPX), and for this we use the ratio of...
READ MORE
MEMBERS ONLY
NEW DATA FEED IS IN!
OUR NEW DATA FEED IS IN! - Well, there were some bumps in the road, but we've managed to get our new ThomsonONE data feed installed and working last week. To those of you that were patient with us while we fixed the problems, we say "Thanks!...
READ MORE
MEMBERS ONLY
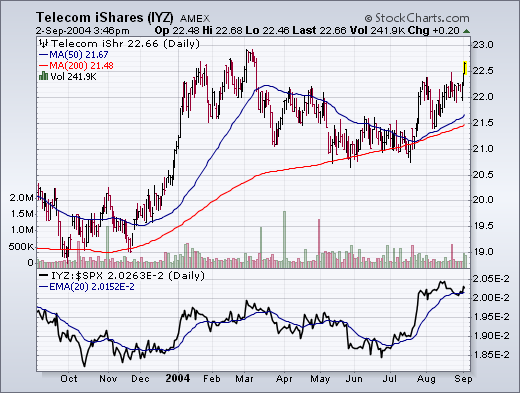
TELECOMM HAVE STRONG DAYS
Telecom stocks had a good chart day. The AMEX Telecom iShares (IYZ) broke out to a new six-month high today. Its relative strength line has been rising since late June. Two of the biggest reasons for today's strength were SBC and Verizon Communications which are two of the...
READ MORE
MEMBERS ONLY
Hello Fellow ChartWatchers!
Thursday's big rally for the Dow Industrials was unexpected and significant. Check out the chart below and see if you can spot the reasons why:
As anticipated, the Dow faltered after hitting its 50-day moving average line. That line was also at the 10,200 resistance level marked...
READ MORE
MEMBERS ONLY
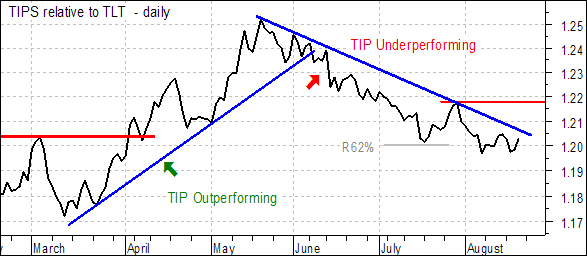
INFLATION EXPECTATIONS DOWN
The TIP/TLT price relative serves as a good proxy for inflationary fears or expectations. TIP is the iShares TIPS Bond (TIP), which is based on the US Treasury's inflation indexed bonds. TLT is the iShares 20+ Year Treasury Fund (TLT), which is not hedged against inflation.
Bonds...
READ MORE
MEMBERS ONLY
A MARKET BOTTOM FOR THE S&P?
We can't know the full potential of this rally, but there is abundant evidence that we have a solid bottom, and that we are seeing a rally that has at least the potential to move back to the top of the trading range.
First, there are positive divergences...
READ MORE
MEMBERS ONLY
ECONOMIC SLUMP FOR 2005?
This past week showed stocks higher; their largest weekly gain in nearly 10 months. And, it did so within the context of sharply higher oil prices. By and large, this has set the tone for stocks to potentially move to new highsor so we are to believe. In fact, there...
READ MORE
MEMBERS ONLY
DATA FEED MOVE THIS WEEK
STRAP ON YOUR HELMETS! - As we've been telling you, this coming week is our big change over to the ThomsonOne Data Feed. We've tested and simulated and fine-tuned things to death but starting on Monday we'll begin the changeover for real. Let us...
READ MORE
MEMBERS ONLY
DIVIDEND STOCKS LOOK PROMISING, S&P LONG-TERM OUTLOOK MIXED
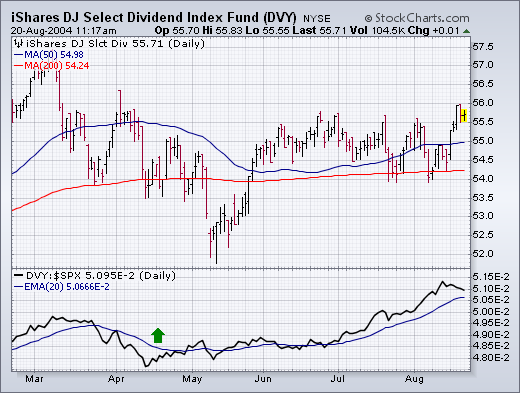
GOING FOR DIVIDENDS... A falling stock market -- along with falling bond yields -- should make dividend paying stocks more attractive. And that appears to be the case. Chart 1 plots the iShares Dow Jones Select Dividend Index Fund (DVY), which invests in large cap stocks that pay dividends. The...
READ MORE
MEMBERS ONLY
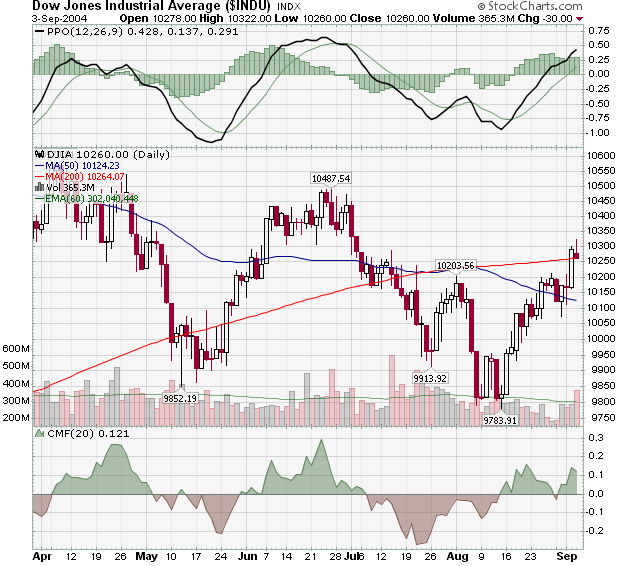
Hello Fellow ChartWatchers!
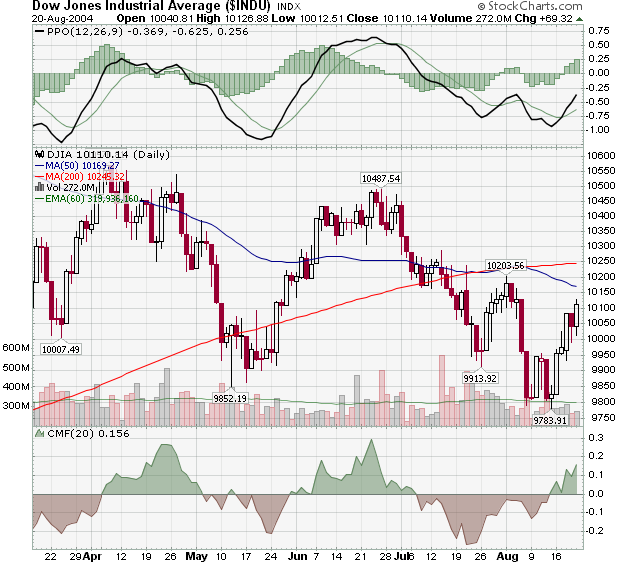
Since setting a new low of 9783 last Friday, the Dow moved higher during four of the last five days and is now approaching the 10203 peak that it set back at the start of August. This rally - and the successful IPO of Google - has greatly improved the...
READ MORE
MEMBERS ONLY
THE BIGGER THE VALUE, THE SOFTER THE FALL
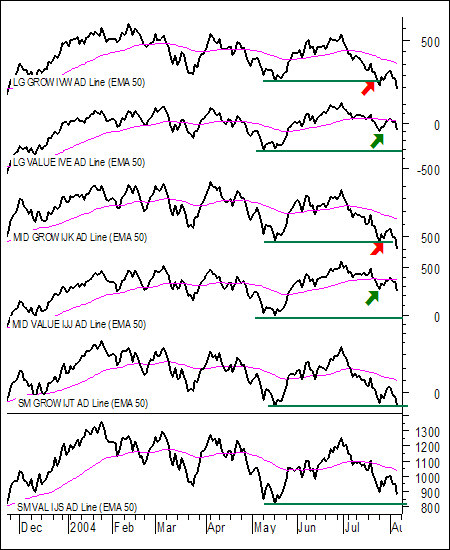
The AD Line is a cumulative measure of advances less declines within a given group of stocks. For example, the S&P Large-Growth ETF (IVW) has 335 stocks. If there were are 200 advances and 135 declines, then the difference would be +135 (335 - 200 = +135) and this...
READ MORE
MEMBERS ONLY

THE PRICE OF OIL VERSUS STOCKS
Recently, the price of crude oil has taken the spotlight as having a major influence on the price of stocks. On the one-year chart above we can see that there was no consistent relationship between oil and stocks as long as oil was priced below $35; however, when oil moved...
READ MORE
MEMBERS ONLY
DISCRETIONARY VS STAPLES RATIO BEARISH
The weakness over the past several months is stark, which was made "more so" over the past two-day decline in all the major indices due to rising energy prices as well as a "punk" employment report. As a consequence of each of reports (and others) -...
READ MORE
MEMBERS ONLY

DATA FEED PROGRESS REPORT
DATA FEED UPDATE - We're continuing to prepare for our upcoming data feed transition which we mentioned several editions ago. At this point, the new hardware is in place and working well and our testing is almost complete. We are working on getting the final paperwork in place...
READ MORE
MEMBERS ONLY
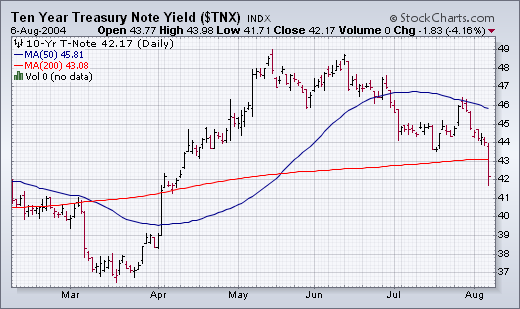
BOND DROP HELPS GOLD, SECTOR WARNING SIGNALS
DROP IN BOND YIELDS HURTS DOLLAR, HELPS GOLD... Bond prices surged on Friday's weak job report. As a result, the yield on the 10-Year Treasury note tumbled to a four-month low and ended below its 200-day moving average (Chart 1). The sharp drop in U.S. rates pushed...
READ MORE
MEMBERS ONLY
Hello Fellow ChartWatchers!
The major markets sold off dramatically at the end of the week due, so we are told, to wild speculation in the oil market. The Dow closed at 9815 which is significant because it is less that the 9852 low that it set back in May. This is the "...
READ MORE
MEMBERS ONLY
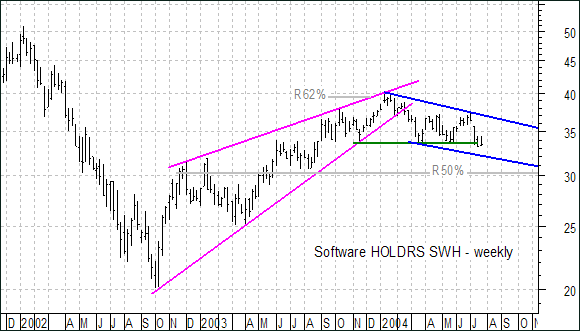
SOFTWARE HOLDRS HEADED LOWER
With the peak at 45.78 in January 2004, the Semiconductor HOLDRS (SMH) came relatively close to its high at 50.19. However, the Software HOLDRS (SWH) peaked at 40.20 and fell well short of its 2002 high at 50.91. SWH only retraced 62% of its prior decline...
READ MORE
MEMBERS ONLY

ADVANCE-DECLINE LINE FOLLIES
I have written on this subject before, but I was inspired by a recent article by Larry McMillan (optionstrategist.com) to visit if again.
Recently the NYSE A-D Line hit new all-time highs, and this is being cited as strong evidence that the market is headed higher. Unfortunately, this is...
READ MORE
MEMBERS ONLY
TECHNOLOGY MALAISE WARRENTED
The current technology "malaise" has run for all intents and purposes for the past six months; however, the recent earnings and guidance "misses" have put it on the front burner as expectations for difficult 2H 2004 comparisons have come one quarter early. The question is whether...
READ MORE
MEMBERS ONLY
GET INVOLVED!
GET INVOLVED! - Did you know there was a great place on the Internet to meet other StockCharts.com users and share your knowledge? Join InvestorsHub.com (it's free) and visit to StockCharts.com forum there. Post your questions, share your insights, and read how other members have...
READ MORE
MEMBERS ONLY

LONGER-TERM VIEW OF THE S&P 500
The monthly S&P 500 bars show why it's important to keep an eye on percentage retracement levels -- as well as chart levels. I've shown this chart before, but it's worth showing again. The 2003 S&P rally not only stalled...
READ MORE
MEMBERS ONLY
Hello Fellow ChartWatchers!
I'm always amazed when the "respectable" financial press gets themselves into a lather about the Dow crossing 10,000. From some of the headlines, you'd think that Friday's close at 9962 was completely unexpected and very significant. "Dow tumbles to below...
READ MORE
MEMBERS ONLY

THE SEMICONDUCTOR CATALYST
While if is often difficult, if not impossible, to predict the fundamental catalyst, the approaching technical catalyst is clear for the Semiconductor HOLDRS (SMH). Key support and resistance are readily identifiable as well as two important patterns. With the group holding great sway over the market, the impending breakout is...
READ MORE
MEMBERS ONLY

EQUAL-WEIGHTING CONTINUES TO BEAT CAP-WEIGHTING
The S&P Equal-Weight Index (SPEWI) was developed by Rydex Fund Group in collaboration with Standard & Poor's. It is composed of the 500 stocks in the S&P 500 Index (SPX), but each stock In the SPEWI carries an equal weighting (rebalanced quarterly) versus the...
READ MORE
MEMBERS ONLY
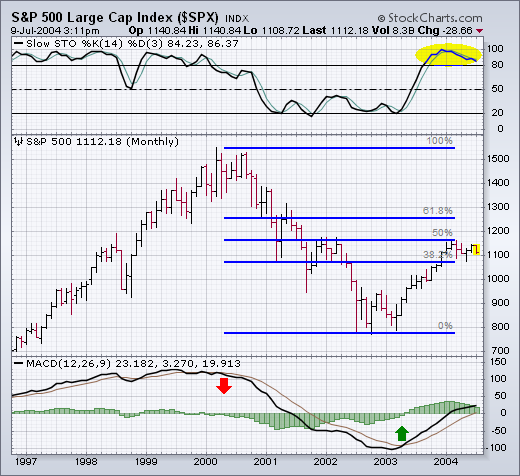
MONTHLY MACD POSITIVE BUT WEAKENING
This is a good time to stand back and try to put things into a longer-term perspective. First of all, let's see why the 2004 rally has been stalled. The monthly bars in Chart 1 show that the S&P 500 ran into major chart resistance at...
READ MORE
MEMBERS ONLY
Hello Fellow ChartWatchers!
We've passed the halfway mark for 2004 and the markets don't have much to show for it. As you can see in the PerfChart below, the market continues to move sideways in a broad range that's rarely over 5% above or below where it...
READ MORE
