MEMBERS ONLY
EVERYTHING IS RELATIVE
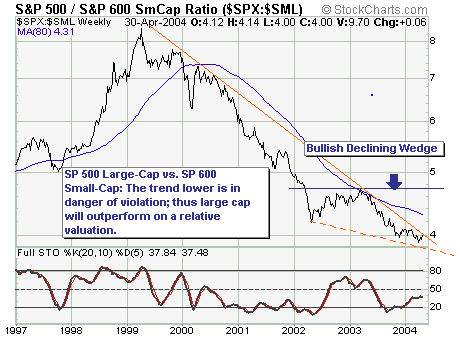
The advance since October 2002 is certainly impressive on its own merits, but pales when compared to the prior decline. The advance has not even retraced 38% of this decline and formed a rising price channel. As long as the lower trendline holds, the trend is firmly bullish and further...
READ MORE
MEMBERS ONLY

S&P 600 MID-CAP STOCKS ABOVE 200/50/20-EMA
I'm very pleased to announce that we now have a chart showing the S&P 600 Small-Cap stocks above their 200-EMA, 50-EMA, and 20-EMA. But wait! There's more! We also have this chart for the S&P 400 Mid-Cap, S&P 500, Nasdaq,...
READ MORE
MEMBERS ONLY
FUNDAMENTALLY INTERESTING
From a fundamental perspective...the past several months shows US interest rates to have risen very sharply as US economic data continues to show strength - from employment to manufacturing to retail sales et al. Moreover, higher energy prices led by gasoline and crude oil have further thrown a "...
READ MORE
MEMBERS ONLY

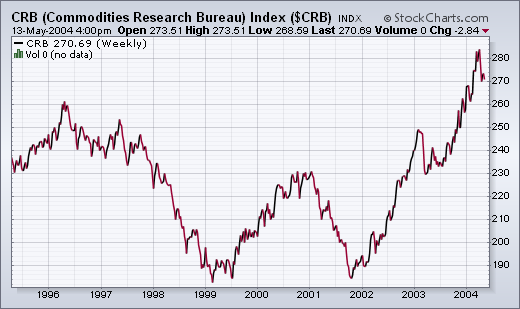
FALLING DOLLAR MAY BE HELPING COMMODITIES
During the two years prior to 2004, a falling U.S. dollar pushed commodity prices to the highest level in more than a decade. During the first half of this year, a rebound in the dollar has coincided with a downside correction in commodities. That may be changing. Chart 1...
READ MORE
MEMBERS ONLY
Hello Fellow ChartWatchers!
Stocks moved sideways last week with most of the major averages finishing within 1% of where they started. The Amex was the big "winner" - up 1.7% - while the Nasdaq lost 0.6% and everyone else finished up somewhere in between. In this week's...
READ MORE
MEMBERS ONLY

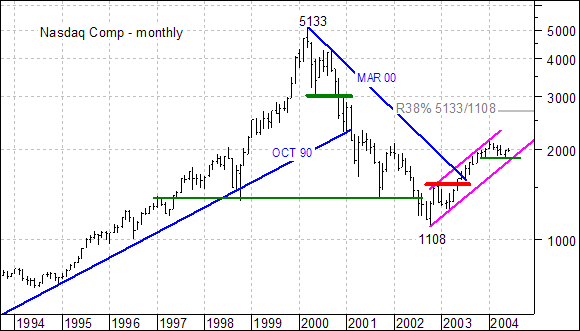
ELLIOT COUNT SUGGESTS A FIFTH WAVE HIGHER
There are two distinct advances and two declines on the weekly Nasdaq Composite chart with the fifth wave still to come.
The first advance started in October 2002 and ended in December 2002 to form Wave 1. The second advance from 1253 to 2154 is clearly the longest in both...
READ MORE
MEMBERS ONLY
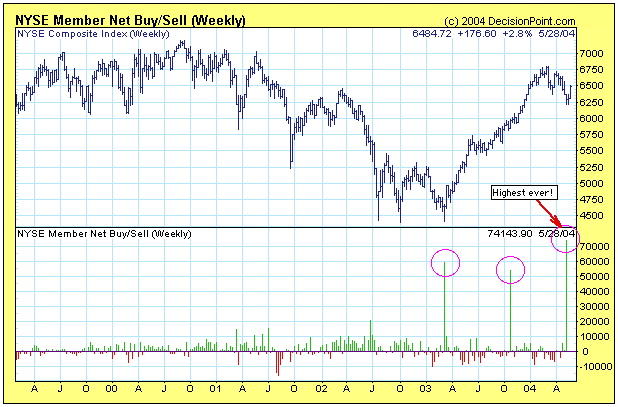
A NEW RECORD FOR NYSE MEMBER BUYING
In the week ended May 15, 2004 NYSE Member Net Buy/Sell numbers hit a new, all-time high of net buying of +741,439,000 shares. There are only two other occasions of net buying that even come close to this -- +540,105,000 shares in the week ended...
READ MORE
MEMBERS ONLY
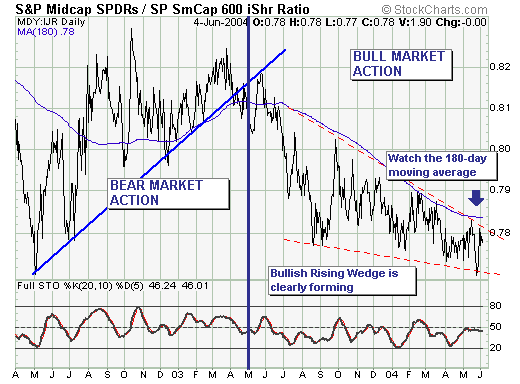
RISING WEDGE ON RATIO CHART BEARISH
Over the past two week's, sentiment has gone from "highly bearish" to "highly bullish" - a change in circumstances that shows confusion above all, but the fact remains the current rally in the major indices has reached the important 50%-60% retracement levels typical...
READ MORE
MEMBERS ONLY

BOOKSTORE CHANGES
NEW BOOKSTORE DESIGN - We're very pleased with how our bookstore redesign project turned out and we think you will be too. Check out the new look and features of StockChartsBookStore.com and let us know what you think! The best selection and prices for online T/A...
READ MORE
MEMBERS ONLY

ENERGY STOCKS MAY BE TOPPING
One of the principles of intermarket behavior is that commodity-related stocks usually peak before the commodity. That's why the next chart is so interesting. While energy prices hit a record high early this week, the Energy Select Sector SPDR peaked in late April. That created a negative divergence...
READ MORE
MEMBERS ONLY
Hello Fellow ChartWatchers!
Last week saw the major markets put in another "lower high" for the current downtrend - the third major one since things started moving lower back in March. This three-point downtrend is easiest to see on the Nasdaq's chart, but it appears on most of the...
READ MORE
MEMBERS ONLY

VOLATILITY INDICES BREAK 200-DAY SMA's
Although there is more than one way to interpret volatility, the simple fact is that the S&P 100 Volatility Index (VIX) and the Nasdaq 100 (VXN) trend lower when the market trends higher and trend higher when the market trends lower. In other words, these indicators actually trend...
READ MORE
MEMBERS ONLY
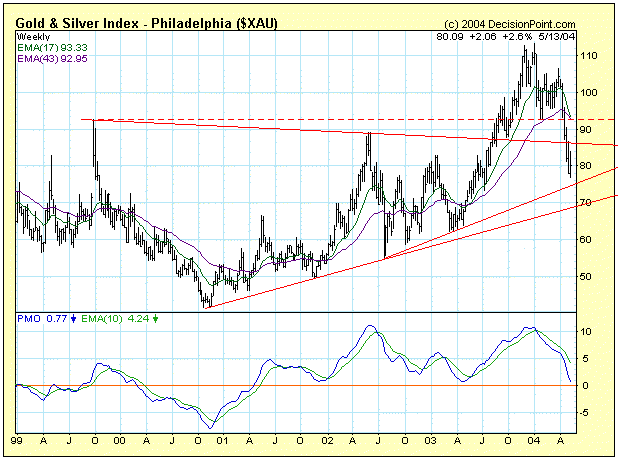
LOOKING FOR A BOTTOM IN GOLD STOCKS
At the end of April the XAU monthly Price Momentum Oscillator (PMO) -- not shown here -- topped at very overbought levels, rendering a long-term sell signal. This action confirmed the sell signal top on the weekly PMO a month earlier, shown on the chart above. Both the monthly and...
READ MORE
MEMBERS ONLY
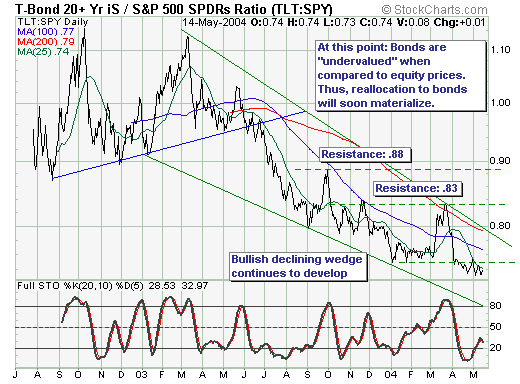
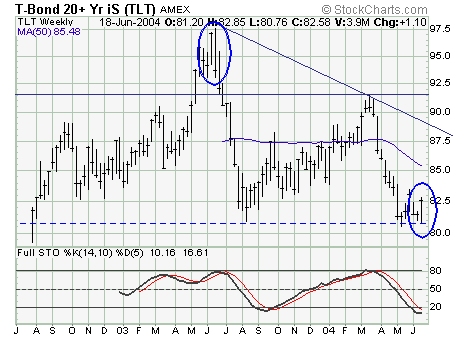
TAKING ADVANTAGE OF WEAKNESS IN BONDS
The recent capital market turmoil across the oceans and through all asset classes be it bonds or stocks or gold, has exacerbated certain risk-reward relationships between these asset classes as the "carry trade" is being unwound. And while these relationships may become even "more skewed" in...
READ MORE
MEMBERS ONLY
SURPRISED BY SURPRISED ECONOMISTS
CPI AND PPI NUMBERS SURPRISE ECONOMISTS... The most frequently seen words in the financial press are "economists were surprised". It seems they're always being surprised by something. This week it was the "surprising" jump in the CPI and PPI inflation numbers. The fact that...
READ MORE
MEMBERS ONLY
Hello Fellow ChartWatchers!
At the height of last Wednesday's big decline all of the major averages except one had moved below their 200-day (40-week) moving averages. This was the first time that had happened since the start of 2003 and it is another important technical milestone that occurs as a significant...
READ MORE
MEMBERS ONLY
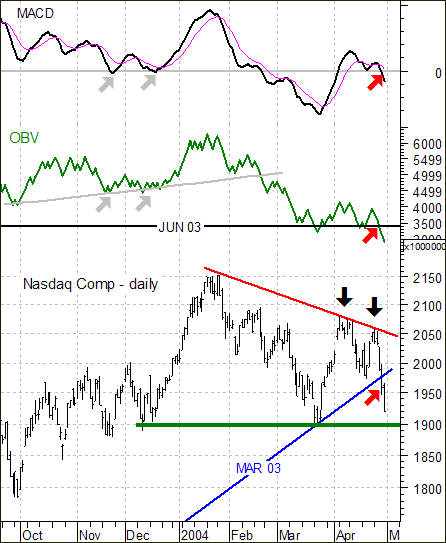
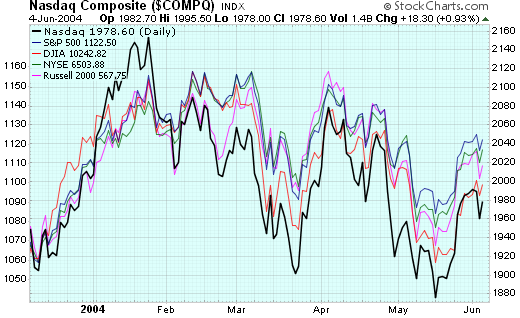
NASDAQ FAILING AND INDICATORS CONFIRMING
There are three ingredients to a downtrend: lower high, lower low and trendline break. The final ingredient (trendline break) is open for debate, but the lower low and lower high are not. With this week's failure to hold the big gains above 2030 (22-Apr) and break below the...
READ MORE
MEMBERS ONLY

S&P 500 NEW HIGHS AND NEW LOWS
Here's a new chart we've just deployed on DecisionPoint.com, showing the 52-week new highs and new lows for just the stocks in the S&P 500 Index. I think this is useful because it shows what is happening with the stocks in the world&...
READ MORE
MEMBERS ONLY
CONSOLIDATION OR DISTRIBUTION?
Over the course of the past 4-months, price action in all of the indices have been "locked" within wide trading ranges. One question to be be answered is whether this is a "consolidation" to new highs; or a "distribution" to lower lows. If we...
READ MORE
MEMBERS ONLY

CHART OVERLAYS COMING THIS WEEK
MURPHYMORRIS.COM TRANSITION COMPLETE - We have moved all of the MurphyMorris.com content from that website into the "John Murphy" section of StockCharts.com now. Subscribers to the Murphy Market Message should now click on the "John Murphy" tab at the top of our pages...
READ MORE
MEMBERS ONLY
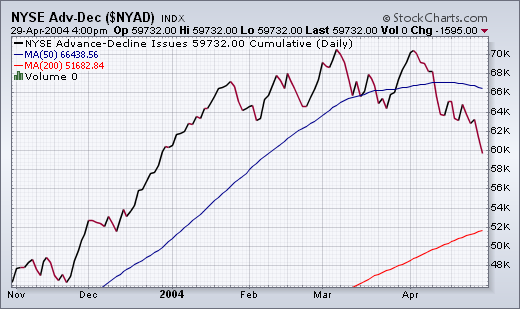
A-D LINE TURNS DOWN
LOWEST LEVEL IN MONTHS... It's been awhile since we've talked about the Advance-Decline lines in the various markets. The two charts below show why we're showing them now. The NYSE Advance-Decline line has fallen to the lowest level in four months. This is its...
READ MORE
MEMBERS ONLY
Hello Fellow ChartWatchers!
Rolling over. The short term technical picture shows the markets rolling over right now into a new down leg. The key test will be when the Nasdaq tries to move below 1900 this week. Right now, most technical signals point to much lower prices if that occurs. John Murphy and...
READ MORE
MEMBERS ONLY
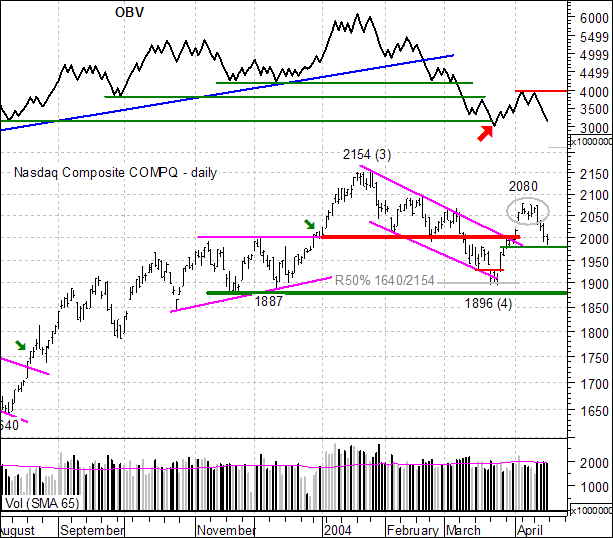
NASDAQ AND OBV
On Monday we were focused on the pennant consolidation with support at 2038 and resistance at 2080 (gray oval). While these are typically bullish continuation patterns and an upside breakout was expected, it was prudent to wait for confirmation. Instead of the expected, the break came to the downside and...
READ MORE
MEMBERS ONLY
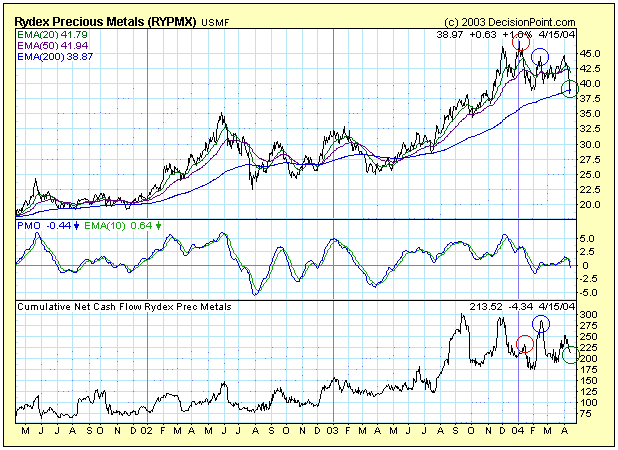
RYDEX PRECIOUS METALS FUND NET CASH FLOW SPELLS TROUBLE AGAIN
DecisionPoint.com tracks net cumulative cash flow of Rydex mutual funds as a way of estimating sentiment in various sectors. The theory is that money 'ought' to follow prices, more or less. In the last several months this indicator has been rather helpful in identifying problematic price moves...
READ MORE
MEMBERS ONLY
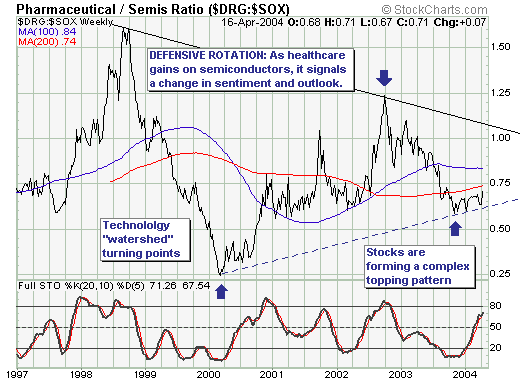
ROTATION FROM TECH TO HEALTHCARE SECTORS
This past week brought in "clear view" the under the surface rotation that has been occurring from the technology sector into the healthcare/pharmaceutical sector - and thus we think it important to look at the Pharmaceutical/Semiconductor RATIO. That said, this "repositioning" is extremely important...
READ MORE
MEMBERS ONLY
MURPHYMORRIS.COM CLOSING
MURPHYMORRIS.COM CLOSING SOON - Sometime in the next couple of days, we expect to complete the transition of John Murphy's tools and commentary from the "Members" tab on the MurphyMorris.com website to the "John Murphy" tab on the StockCharts.com website. For...
READ MORE
MEMBERS ONLY
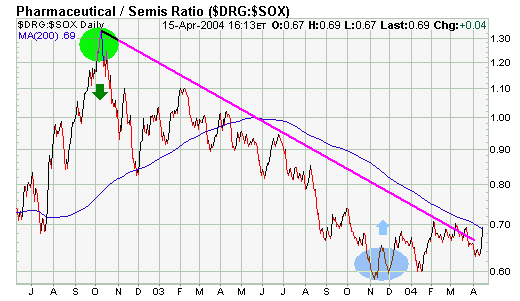
THE DRG/SOX RATIO
DRG/SOX RATIO IS RISING... Earlier in the year I did an analysis of the DRG/SOX ratio as a way to try to measure the mood of the market. The ratio divides the Drug Index (DRG) by the Semiconductor (SOX) Index. The idea is that when investors are confident...
READ MORE
MEMBERS ONLY
Hello Fellow ChartWatchers!
All-in-all, last week was a down week for the major market averages. While the Dow managed to eek out a tiny gain, the other indices fell with the Nasdaq (-2.79%) leading the way. So far this year, the energy-heavy Amex Composite (+5.64%) and the Russell 2000 (+4.75%...
READ MORE
MEMBERS ONLY

$XAU LAGGING GOLD BULLION
The Philadelphia Gold Index, $XAU, is usually a better predictor of gold than gold is of $XAU. The top chart shows $XAU relative to gold or the "price relative". Notice that XAU performs best when the price relative rises ($XAU outperforming gold) and the price relative can be...
READ MORE
MEMBERS ONLY
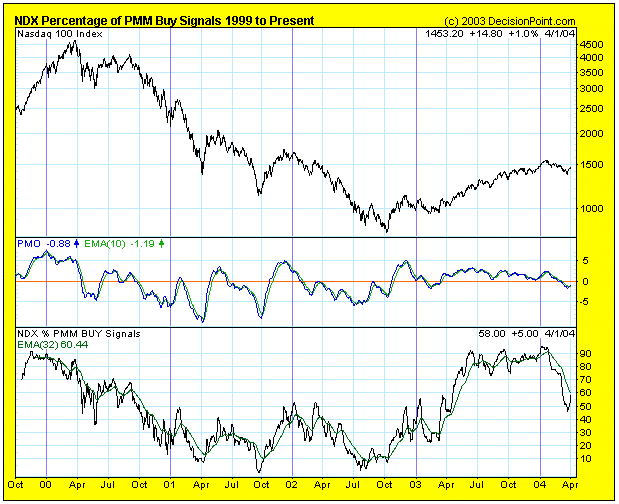
NEW DECISION POINT INDICATOR: PMM
Does the world really need another indicator? Well, this is one we have been collecting data on for years, but we just recently started charting it because we discovered it presents a good picture of internal market strength or weakness.
Our Price Momentum Model (PMM) is a simple but effective...
READ MORE
MEMBERS ONLY
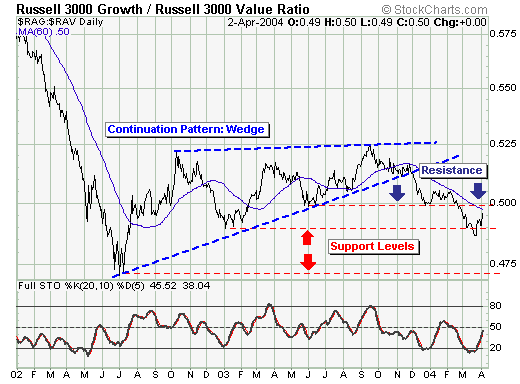
LOOKING AT THE RUSSELL 300 "GROWTH VS. VALUE" RATIO
In terms of gauging the current substantial rally, we should look at the relative performance of the "growth" and "value" components thereof. In effect, if we are bullish, then we want to be long that which is outperforming. This is fairly simple.
Thus, when we look...
READ MORE
MEMBERS ONLY
CALENDAR CONTROLLERS
CALENDAR CONTROLLERS ADDED TO SC3 BETA - We aren't rolling out lots of new features this week like we have in weeks past, however we did manage to add two very neat icons to the "User-Defined" Duration section of the SharpCharts2 Beta page. Clicking on either...
READ MORE
MEMBERS ONLY

RISING RATES HURTS BANKS AND HOMEBUILDERS
10-YEAR YIELDS SOAR OVER 4%... While today's surprisingly strong jobs report was good for stocks, it was very bad for bonds. Bond prices fell more than two full points. The 10-year T-note, which rises when prices fall, surged all the way to 4.14%. That certainly seems to...
READ MORE
MEMBERS ONLY
Hello Fellow ChartWatchers!
The markets are rebounding strongly right now and trying to put the declines from February and March behind them. Most of the major averages moved back above their 50-day Moving Average on Friday (not the Dow though...). Smart ChartWatchers will be watching closely this week to see if this rally...
READ MORE
MEMBERS ONLY

The AD Volume Lines
Breadth stats reflect continued preference to be overweight small and mid-caps, while underweight techs and large-caps. As the AD Volume Lines show, the S&P Midcap Index and S&P SmallCap Index remain the strongest. Both indicators for MID and SML remain above their 89-day EMAs, although the...
READ MORE
MEMBERS ONLY

DETERMINING THE TREND AND CONDITION OF THE MARKET
The trend and condition of the market should dictate the kind of actions we will take, so these are the first things we should evaluate during the process of making investment/trading decisions. This process is necessary for all time frames, but for this article I will focus on the...
READ MORE
MEMBERS ONLY
NOT YOUR "GARDEN VARIETY" CORRECTION
The past two-month trading period is one at the present time considered a "correction"; however, there are nascent signs it may be something quite a bit larger than just your "garden variety" correction. First, we note that trendline resistance is proving its merit by turning prices...
READ MORE
MEMBERS ONLY

WHAT'S NEW IN BETA 3
SHARPCHARTS2 BETA 3 - The improvements just keep coming! This week, we've added the Money Flow Index (see Chip's article above), Equivolume charting, support for annotations, the ability to email charts to others, the ability tostore charts in your browser's "bookmark" area,...
READ MORE
MEMBERS ONLY
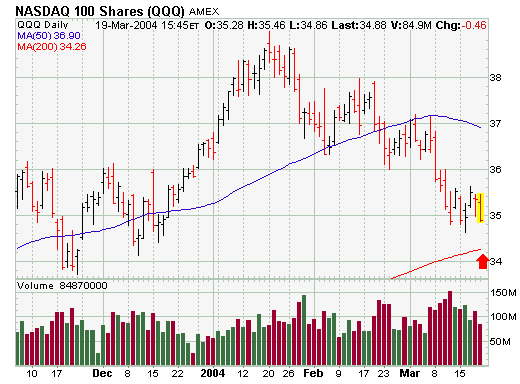
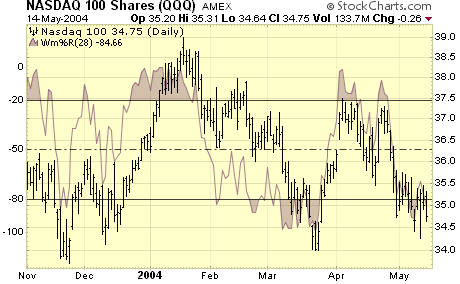
NASDAQ 100 LEADS MARKET LOWER.
NASDAQ 100 LEADS MARKET LOWER... The Nasdaq 100 QQQs were the worst percentage losers on Friday and reflected continuing weakness in the largest technology stocks. The daily chart shows the QQQ ending the week on a down note. The only saving grace was the relatively light volume. With the SOX...
READ MORE
MEMBERS ONLY
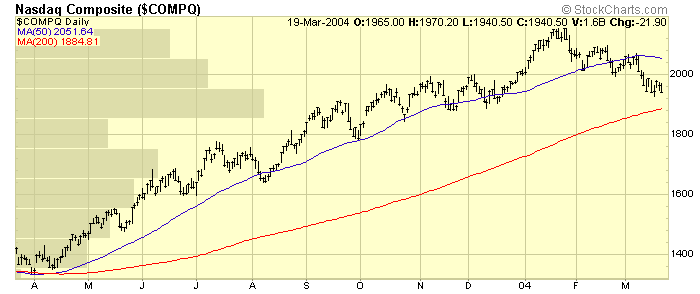
Hello Fellow ChartWatchers!
The current market pull-back is getting serious. Check out the current Nasdaq chart:
See the long "Price-by-Volume" bar sticking out from the left side of the chart around the 1900 level? That represents the largest support level for the Nasdaq during the course of the past 12 months....
READ MORE
