MEMBERS ONLY
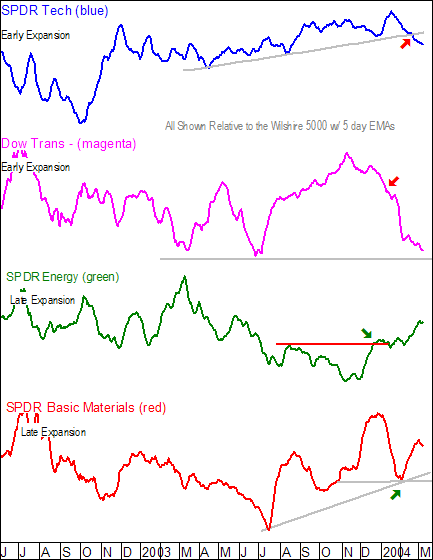
SECTORS AND EXPANSION
Relative strength or price relative charts provide an idea of which sectors will lead and lag over the next few weeks and months. These are formed by dividing the Sector Index by the Wilshire 5000 or another broad market index. These particular four sectors are positioned according to the place...
READ MORE
MEMBERS ONLY

LONG-TERM SELL SIGNAL FOR GOLD?
When the monthly PMO (Price Momentum Oscillator) reaches a range extreme and changes direction, it is a pretty good indication that the long-term trend is changing. PMO direction changes in the middle of the range can often just be "noise", but, when the PMO has a long, sustained...
READ MORE
MEMBERS ONLY
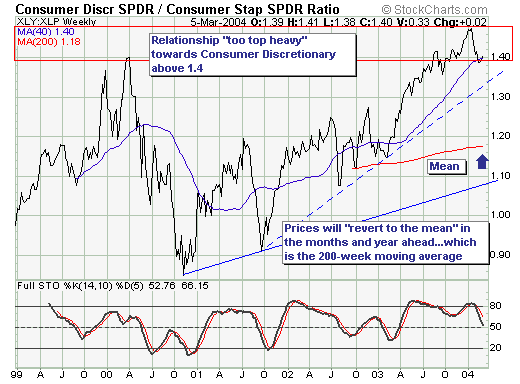
THE "CONSUMER" SECTOR RATIO
The stock market environment over the past six weeks has been fraught with a good deal of rotation out of specific indices such as the Dow and Nasdaq and into the S&P 400 midcaps and S&P 600 small caps. And it is precisely this rotation effect...
READ MORE
MEMBERS ONLY
SC2 BETA 2 NOW READY!
SHARPCHARTS BETA 2 NOW AVAILABLE! - We're continuing the roll-out of our new charting engine - SharpCharts 2 - with the release of the second "Beta" version this week. Here's the scoop on what's new in Beta 2:
* CandleVolume Charts - The...
READ MORE
MEMBERS ONLY

PLUNGING BOND YIELDS BOOST FINANCIAL SHARES
WEAK JOBS REPORT A MIXED BLESSING ... Today's weak job report was a shocker. It's weakness, however, is a mixed blessing. It's a potential negative for the economy since it erodes consumer confidence. At the same time, its negative economic message pushed bond yields sharply...
READ MORE
MEMBERS ONLY

Hello Fellow ChartWatchers!
Last week saw all of the major averages post modest gains with the Russell 2000 (+2.3%) leading the way. The Nasdaq fell on Friday while the other averages rose and that behavior is consistent with a big change that happened last week on the Nasdaq's chart:
Prior...
READ MORE
