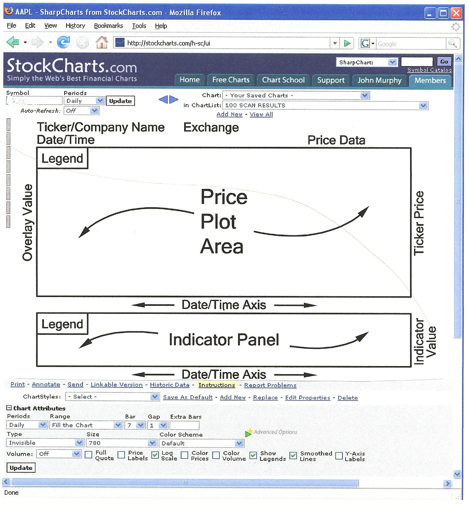
MEMBERS ONLY
AUTO-COMPLETE TICKER BOX
We've just added a new "auto-complete" dropdown box feature to our home page. As you enter a ticker symbol or company name into the "Symbol" box, we now display suggestions from our symbol database for what we think you are looking for. As you...
READ MORE
MEMBERS ONLY
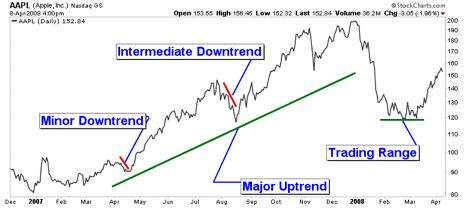
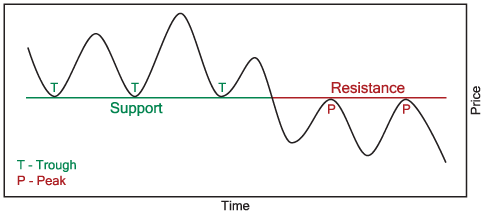
TECHNICAL ANALYSIS 101 - PART 8
This is the eighth part of a series of articles about Technical Analysis from a new course we're developing. If you are new to charting, these articles will give you the "big picture" behind the charts on our site. if you are an "old hand&...
READ MORE
MEMBERS ONLY
BIGGER PIPES, BETTER SERVICE
BIGGER PIPES, BETTER SERVICE - On Friday, we upgraded our Internet connection from a 180 Megabit connection to a 1 Gigabit Fiber connection (1 Gigabit is 1024 Megabits). That's over 5 times more bandwidth! If you have been experiencing slowness, especially during busy market times, you might see...
READ MORE
MEMBERS ONLY
TECHNICAL ANALYSIS 101 - PART 7
This is the seventh part of a series of articles about Technical Analysis from a new course we're developing. If you are new to charting, these articles will give you the "big picture" behind the charts on our site. if you are an "old hand&...
READ MORE
MEMBERS ONLY
IMPROVEMENTS GALORE!
NEW HOME PAGE DEBUTS - Our slick new home page provides you with a quick way to see all of the latest happenings at StockCharts. Which stocks are hot; which blogs have been updated recently; the latest improvements to the website; and much more are all right there on https:...
READ MORE
MEMBERS ONLY

TECHNICAL ANALYSIS 101 - PART 6
This is the sixth part of a series of articles about Technical Analysis from a new course we're developing. If you are new to charting, these articles will give you the "big picture" behind the charts on our site. if you are an "old hand&...
READ MORE
MEMBERS ONLY
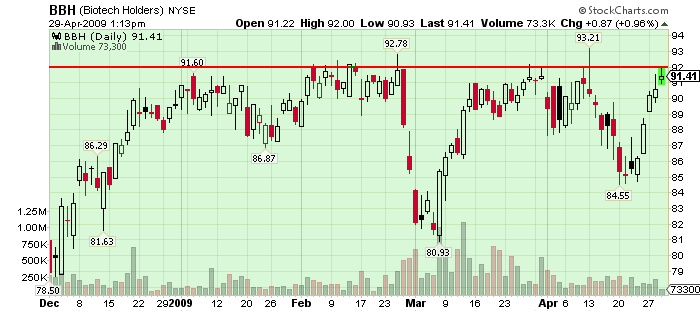
Biotech Holders (BBH) Trying to Breakout Again
Click here for a live version of this chart.
The Biotech ETF has had a devil of a time getting above 92 this year. Right now it is trying again. The low volume numbers don't bode well but remember that ETF volume data can be tricky to interpret....
READ MORE
MEMBERS ONLY
CHANGE IS IN THE AIR AT STOCKCHARTS
Wow. This past week has been a very hectic one here at StockCharts.com. Four - count 'em - four H-U-G-E changes have happened in addition to our 10-year Anniversary Sale is drawing to a close. I posted about most of this stuff in my blog, but I wanted...
READ MORE
MEMBERS ONLY
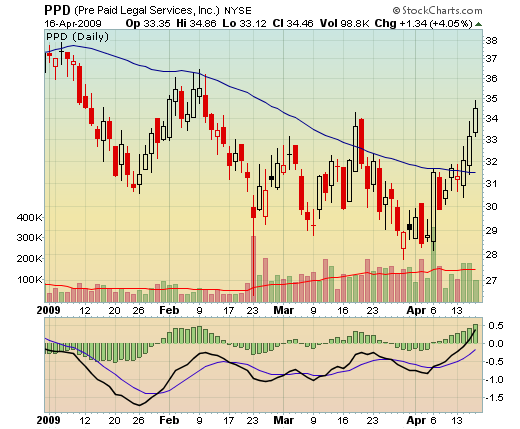
PPD Finally Breaks Out
Click here for a live version of this chart.
We discussed PPD and its long struggle with the 50-day MA in a previous post. Looks like things have finally changed! Should be fun to watch during the next couple of days....
READ MORE
MEMBERS ONLY
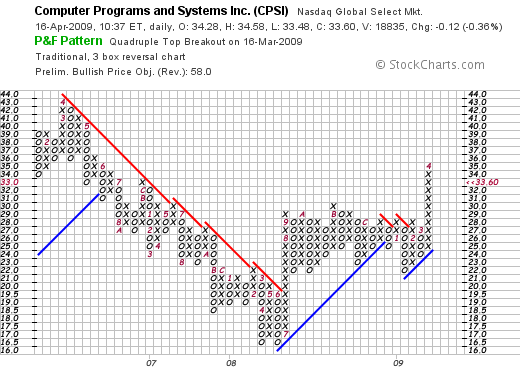
Quadrupal Top Breakout Now Faltering (CPSI)
Click here for a live version of this chart
CPSI has had a pretty impressive P&F chart for a while now. On March 16th, it completed a Quadrupal Top Breakout pattern that is, technically, still in place today. The problem is that CPSI is dangerously close to reversing...
READ MORE
MEMBERS ONLY
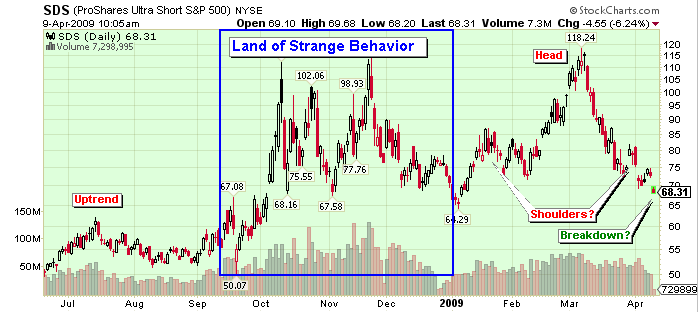
Ticker Cloud leads to SDS Head and Shoulders
Click here for a live version of this chart
SDS is the ProShares Ultra Short S&P 500 ETF. It's a way to invest (gamble really) that the market is going to fall. It showed up today on our Ticker Cloud page as one of today'...
READ MORE
MEMBERS ONLY
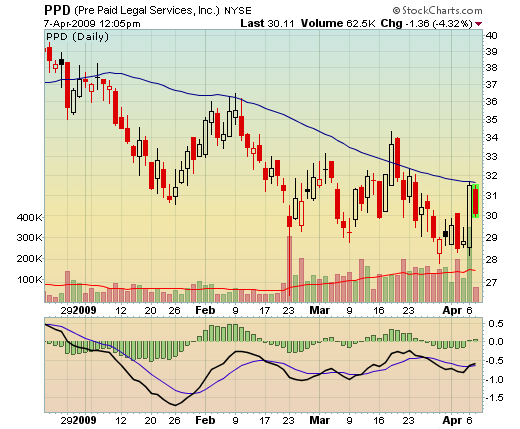
Getting Beat Down Legally (PPD)
Click here for a live version of this chart
Help! Police! Pre-Paid Legal Services (PPD) is getting beat down by its 50-day Moving Average! Again!
This is the third time this year that PPD has failed to penetrate the 50-day MA (blue line). Things were looking promising too - this...
READ MORE
MEMBERS ONLY

TEN YEARS YOUNG!
OUR TEN-YEAR CELEBRATION IS NOW ON! Chip started StockCharts.com ten years ago this month and to celebrate we are running our best special ever!
* Subscribe to (or renew) any of our online services for a year and get two additional months of service free!
Normally, you'd only...
READ MORE
MEMBERS ONLY
TECHNICAL ANALYSIS 101 - PART 5
This is the fifth part of a series of articles about Technical Analysis from a new course we're developing. If you are new to charting, these articles will give you the "big picture" behind the charts on our site. if you are an "old hand&...
READ MORE
MEMBERS ONLY
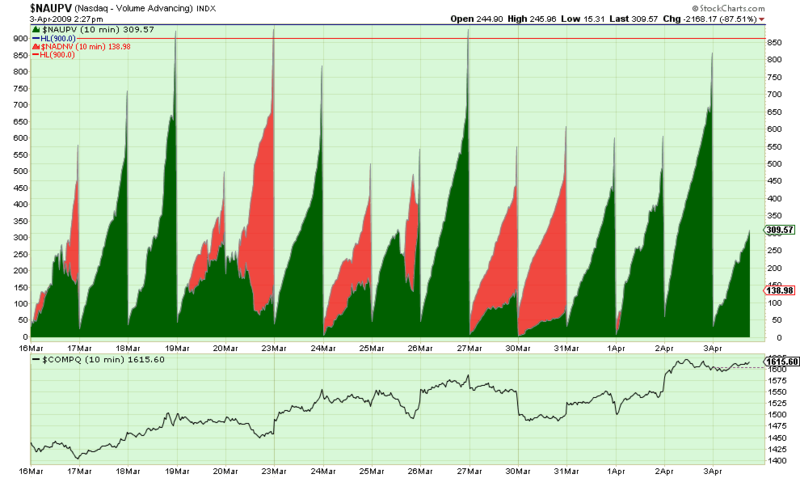
Intraday Up/Down Volume Sentiment Chart
Click here for a live version of this chart.
"Wow. That doesn't look like any financial chart I've ever seen before."
I agree, that is one strange looking chart. What the green area shows is the total amount of "Up" volume -...
READ MORE
MEMBERS ONLY
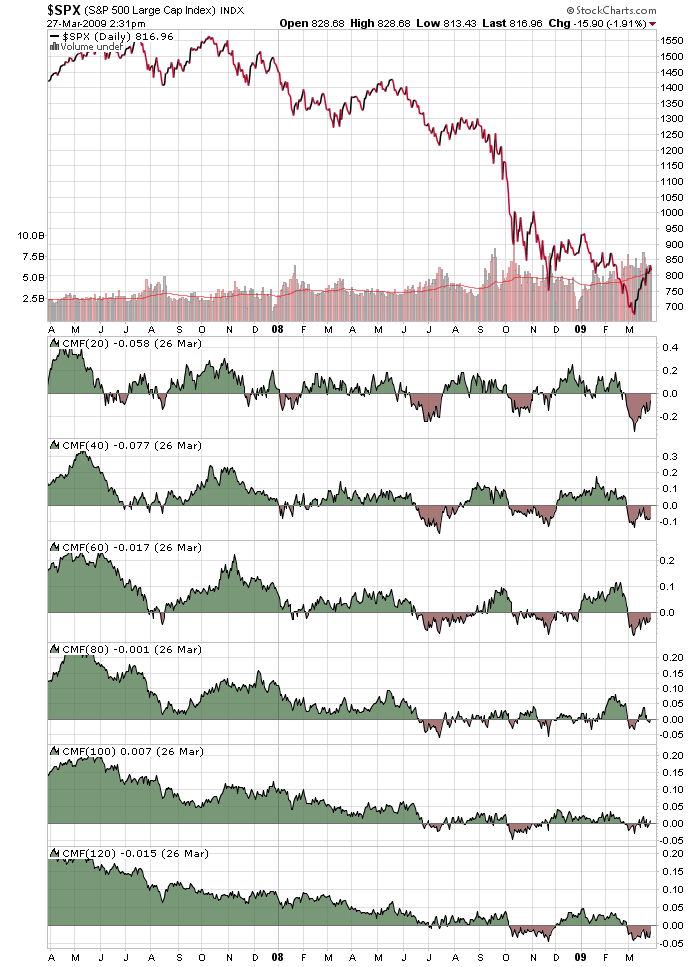
Chaikin Money Flow Study ($SPX)
Click here for a live version of this chart.
Often we get asked "What settings should I use on my indicators? What's the best?" and our answer is the always infuriating "It depends." The chart above shows why "It depends" is always...
READ MORE
MEMBERS ONLY
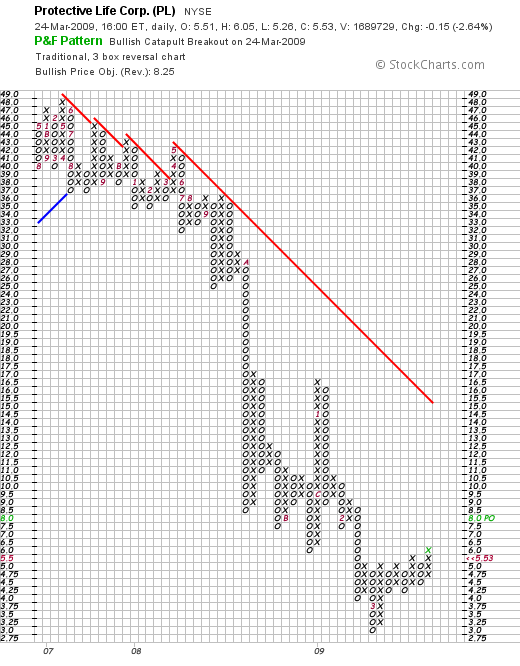
Catapulting Bulls (PL)
Click here for a live version of this chart.
The "Bullish Catapult" P&F pattern is a great way to find stocks that are breaking out above resistance. Today, Protective Life Corp. (PL) was the only high volume stock to create a new Bullish Catapult pattern when...
READ MORE
MEMBERS ONLY
NEW LOOK, NEW FEATURES, NEW NAME FOR OUR MARKET MESSAGE SERVICE
Today we're unveiling several design changes to the "John Murphy" area of our website. These changes include:
* A new, cleaner design that echos the look of our free commentary areas - i.e. out blogs (i.e., this page!)
* Email notifications that let subscribers see the...
READ MORE
MEMBERS ONLY
TECHNICAL ANALYSIS 101 - PART 4
This is the fourth part of a series of articles about Technical Analysis from a new course we're developing. If you are new to charting, these articles will give you the "big picture" behind the charts on our site. if you are an "old hand&...
READ MORE
MEMBERS ONLY
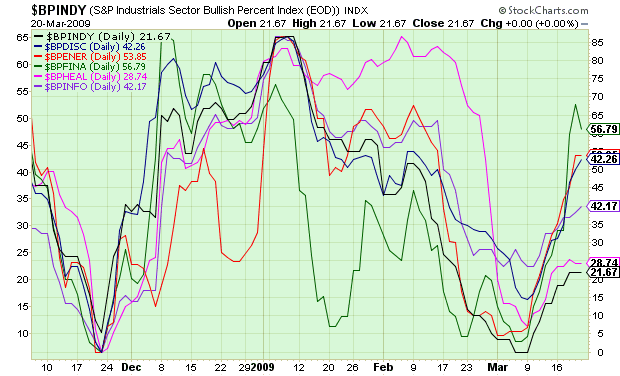
Bullish Percent Sector Indices Moving Higher
Click here for a live version of this chart.
Click here for a live version of this chart.
Bullish Percent indexes show the percentage of stocks in a given group that have a "Buy Signal" on their P&F chart. Above are charts with the 11 different...
READ MORE
MEMBERS ONLY
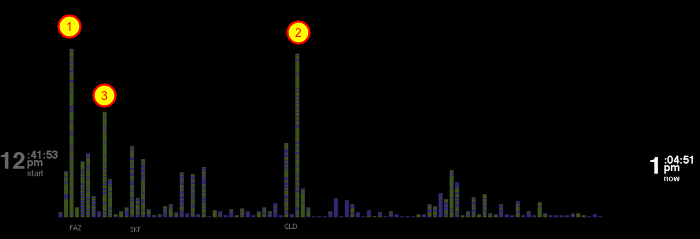
Singing in the (Ticker) Rain (FAS/FAZ)
Click here to start watching Ticker Rain
This is not your typical stock chart. This is what you see after running our Ticker Rain program for a while. It can show you what tickers are popular on StockCharts.com. More importantly, it can show you what everyone else is looking...
READ MORE
MEMBERS ONLY
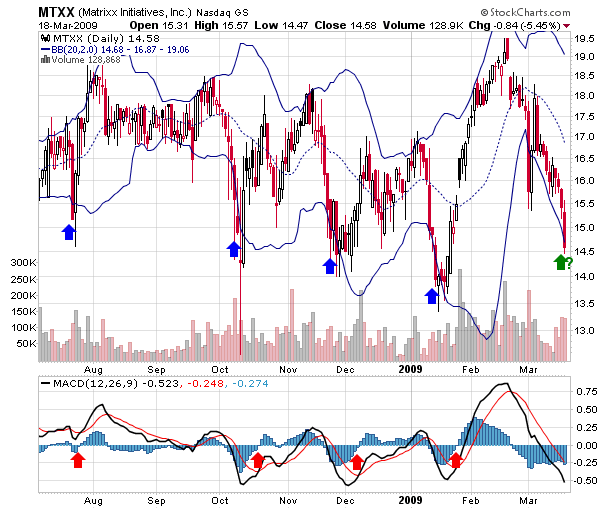
Bouncing Off Bollinger Bands (MTXX)
Click here for a live version of this chart
How are your money management skills these days? Here's a real test for you:
Over the past 10 months, MTXX has been bouncing up and down between roughly 14 and 19. One of the first signals that the stock...
READ MORE
MEMBERS ONLY
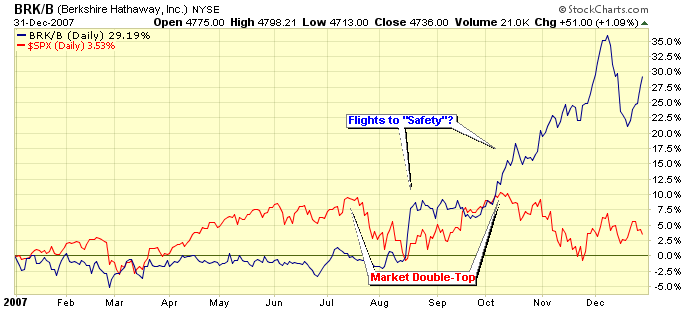
Berkshire's "Flight to Safety" Breakouts (BRK/B)
Click here for a live version of this chart.
Continuing to look for "leading" technical signals that pointed to the market's recent crash. It's always interesting to see how the country's "best" investor did. Warren Buffet's Berkshire Hathaway...
READ MORE
MEMBERS ONLY
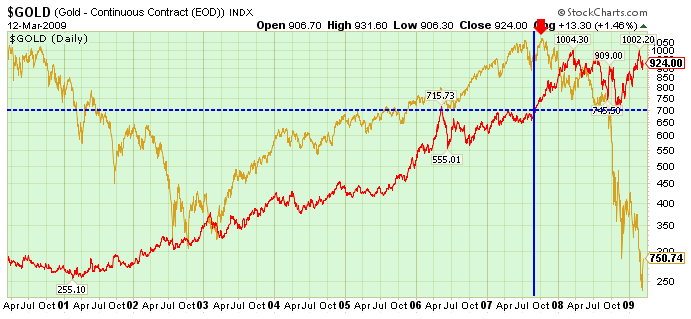
Gold at 700 was the Beginning of the End
Click here for a live version of this chart.
The S&P 500 Index (yellow line) hit its most recent high in early October of 2007 (red arrow). Since then it's been all downhill. Were there any clear warning signs before the plunge began?
It's...
READ MORE
MEMBERS ONLY
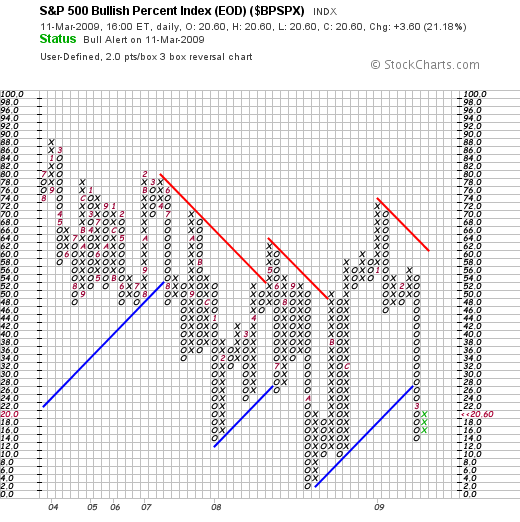
S&P Bullish Percent Chart Turning Upwards ($BPSPX)
Click here to see a live version of this chart.
Bullish Percent charts track the percentage of stocks in a specified group that have a P&F "Buy Signal" on their charts. While the large-scale Bullish Percent indexes - the NYSE's ( $BPNYA) and the Nasdaq&...
READ MORE
MEMBERS ONLY
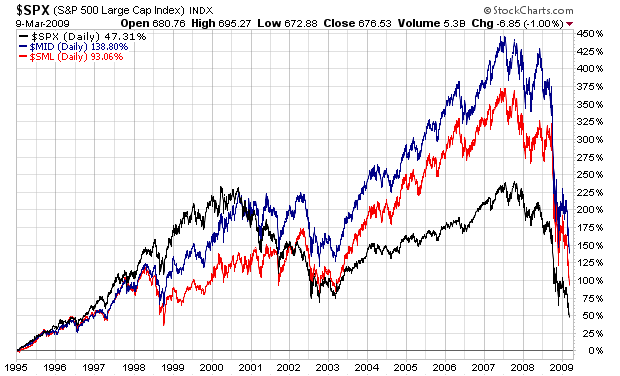
Large Caps, Mid Caps or Small Caps?
Click here for a live version of this chart.
Long term answer: Mid caps. Next question?...
READ MORE
MEMBERS ONLY
SITE NEWS FOR MARCH 7, 2009
NEW "WHAT'S NEW" AREA - We've reworked the "What's New" area on the "Members" page so that it now shows you all of the latest posts from our various blogs. I know that some of you just look...
READ MORE
MEMBERS ONLY
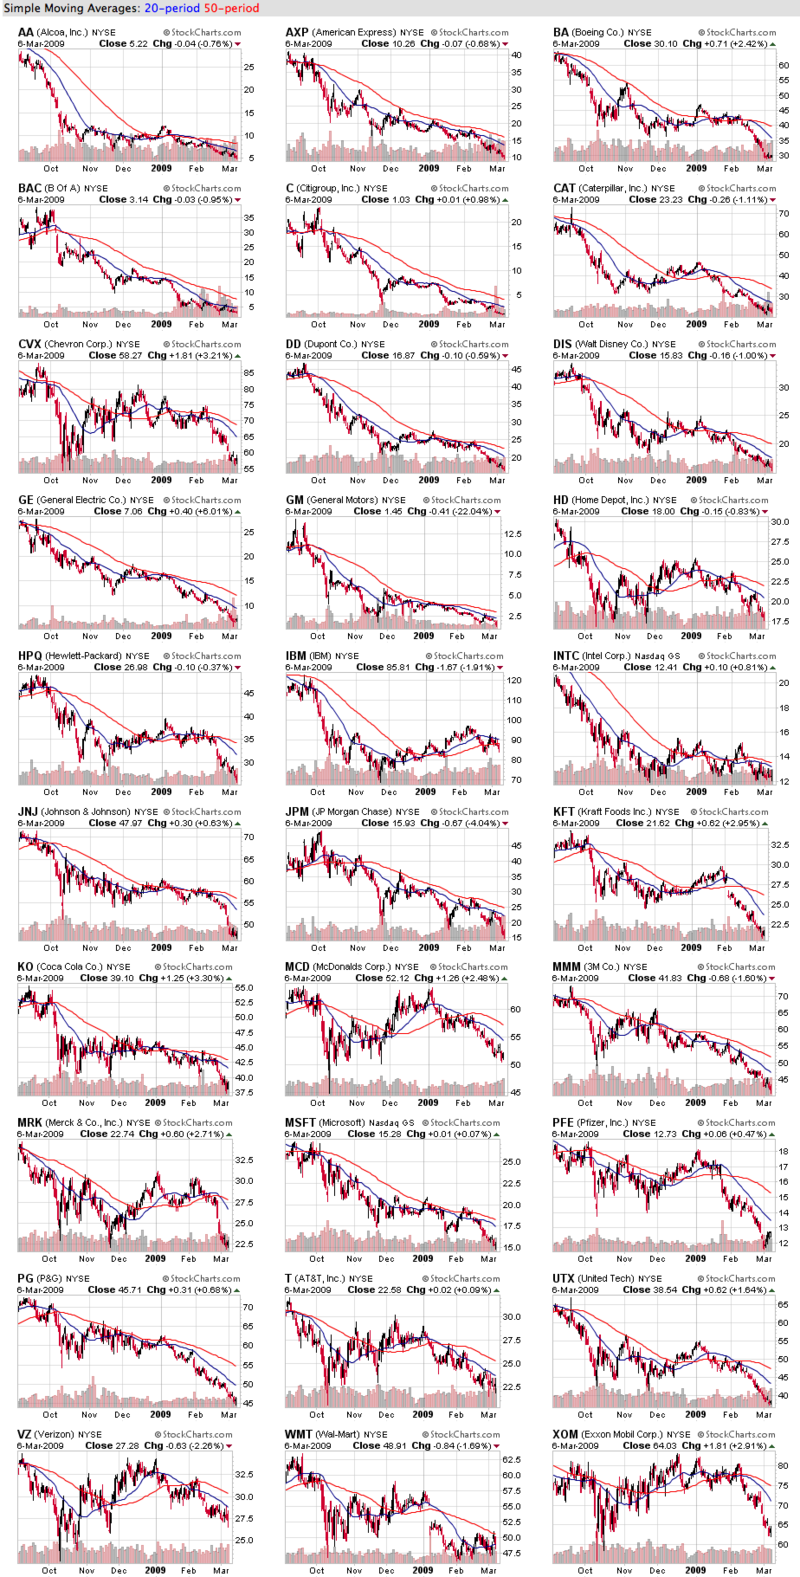
One of These Charts is Not Like the Others (Dow Stocks)
Click here for a live version of these charts.
OK - I apologize for the size of the image above, but it's worth the extra time needed to download I promise!
These are 6-month candlestick charts of the 30 stocks that make up the Dow Jones Industrial Average....
READ MORE
MEMBERS ONLY
TECHNICAL ANALYSIS 101 - PART 3
This is the third part of a series of articles about Technical Analysis from a new course we're developing. If you are new to charting, these articles will give you the "big picture" behind the charts on our site. if you are an "old hand&...
READ MORE
MEMBERS ONLY
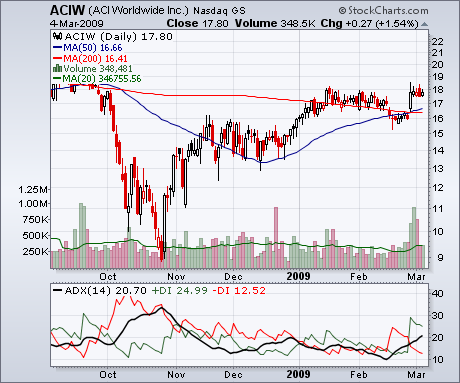
The Only Nasdaq Stock in a New Uptrend Right Now (ACIW)
Click here for a live version of this chart.
Only one Nasdaq stock began a new uptrend today. Well... began a new uptrend as defined by the ADX indicator. ACI Worldwide Inc recently had a bullish 50/200 Moving average crossover (corresponding to a nice bump up on good volume)...
READ MORE
MEMBERS ONLY
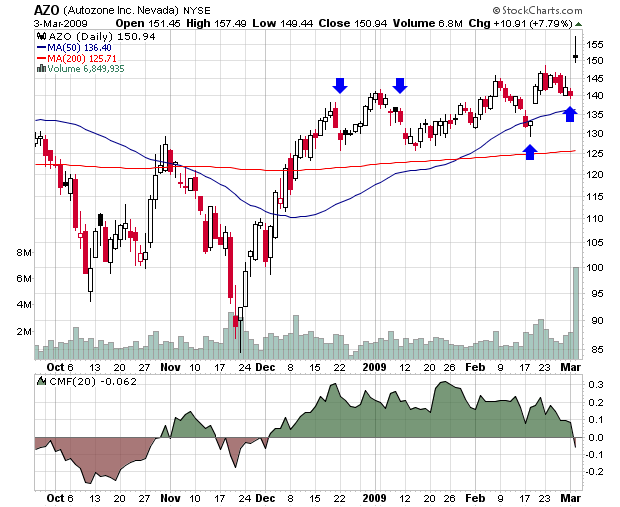
Vroom! Autozone Jumps the Gap (AZO)
Click here for a live version of this chart
After gapping down during December and January, AutoZone gapped up significantly in mid February and zoomed upwards today hitting a high of 157 at one point. So why is the Chaikin Money Flow not zooming upwards as well? The CMF gave...
READ MORE
MEMBERS ONLY
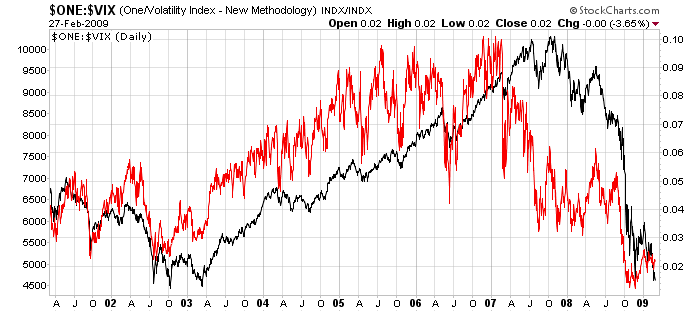
What Did the VIX Know and When Did It Know It?
Click here for a live version of this chart
The VIX is the Volatility Index published by the Chicago Board Options Exchange (CBOE). It measures the "implied volatility" of a hypothetical SPX option created from a weighted average of several actual SPX options. (For all the gory details,...
READ MORE
MEMBERS ONLY

The Battle for Apple (AAPL)
Click here for a live version of this chart.
Apple has been bouncing around $90 since October. Is that support going to hold? One way to gauge the strength of a support level is to use the "Vol by Price" overlay - the horizontal histogram on the left...
READ MORE
MEMBERS ONLY
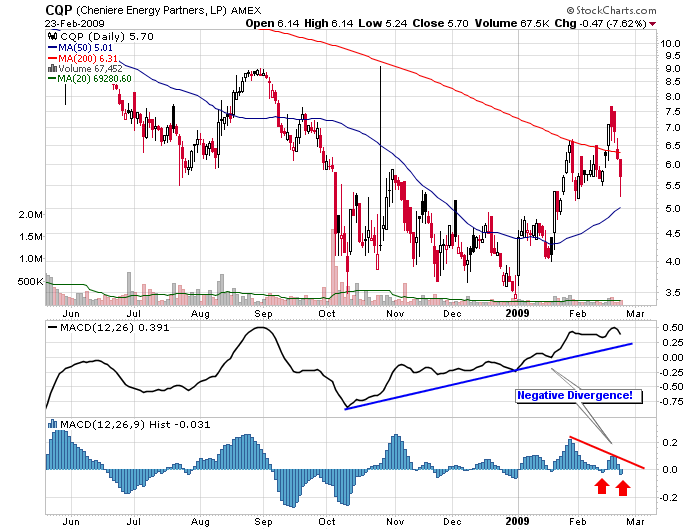
Up + Down = Down (CQP)
Click here for a live version of this chart.
The MACD Histogram shows the change in momentum of the MACD Line. The MACD Line - in turn - shows the change of momentum in the underlying stock. In the case of CQP, the MACD Line has been moving up pretty...
READ MORE
MEMBERS ONLY
MASTERING OUR BLOGS
In case you missed it, we are now publishing a ton of new content about charting and technical analysis on our seven(!) different blogs. One of the great things about blogs is that you can "subscribe" to a blog and then get notified as soon as anything new...
READ MORE
MEMBERS ONLY
TECHNICAL ANALYSIS 101 - PART 2
This is the second part of a series of articles about Technical Analysis from a new course we're developing. If you are new to charting, these articles will give you the "big picture" behind the charts on our site. if you are an "old hand&...
READ MORE
MEMBERS ONLY
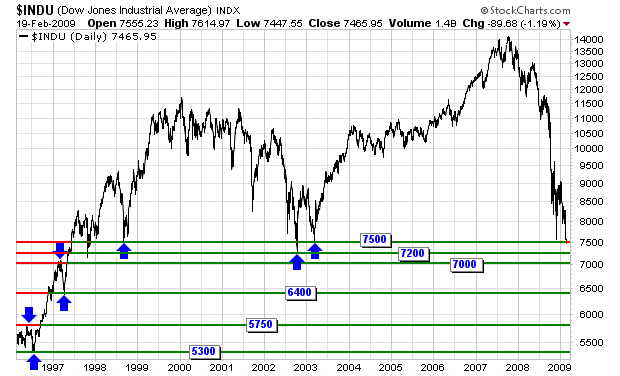
Support for the Dow? ($INDU)
Click here for a live version of this chart.
Today the Dow Jones Industrials closed below its 6 year low just under 7500. What's the next important support level? What's the one below that? (and, gulp, the one below that?) Here you go. Let's...
READ MORE
MEMBERS ONLY
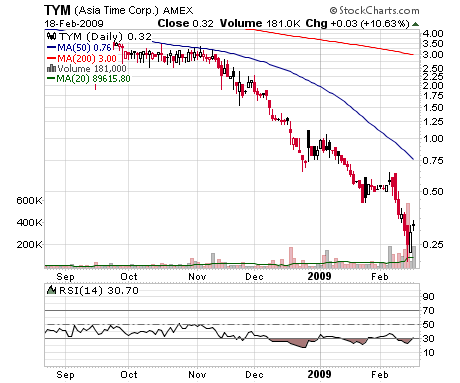
Bottom Feeding: Time for Asia Time? (TYM)
Click here for a live version of this chart.
Trying to catch a "falling knife" like Asia Time (TYM) is extremely risky in any market. Doing it in today's market is pure folly. And yet... TYM is the only stock on any of the major markets...
READ MORE
MEMBERS ONLY
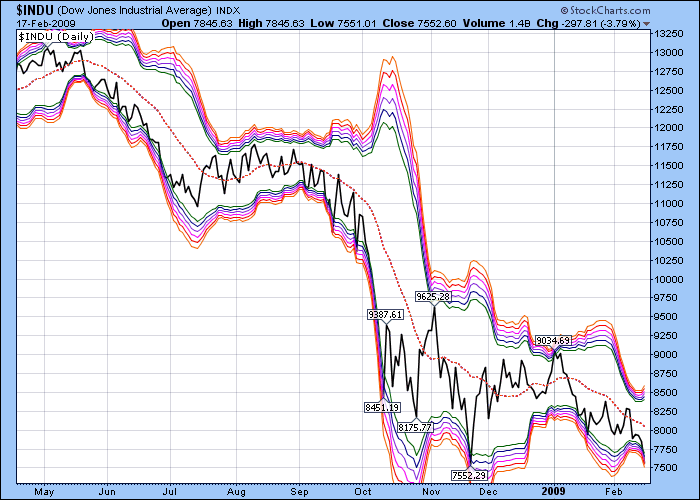
Bollinger Band "Topo Map" ($INDU)
Click here for a live version of this chart.
Based on the statistical concept of Standard Deviations, Bollinger Bands graphically illustrate how "far away" prices are from their "average" value. Traditionally, 2.0 standard deviations are used to determine where the upper and lower bands should...
READ MORE
MEMBERS ONLY

Long-Term Log Scale Chart Provides Context ($INDU)
How bad is it? How big was the Internet bubble? How does the current decline compare to the 1987 crash? It's all here in black and white (and red and blue). On a log scale chart like this, movements of the same percentage appear to have the same...
READ MORE
