MEMBERS ONLY

After the Head and Shoulders (NDN)
NDN has been falling after completing a classic Head & Shoulders chart pattern back in January. Today was the first set of positive technical signals for the stock in quite a while - a bullish MACD crossover, a rising RSI line and a bullish Parabolic SAR signal. While all of...
READ MORE
MEMBERS ONLY

McClellan Summation Index Struggling to Stay Positive
Click here for a live version of this chart.
The McClellan Summation Index is a great market indicator that recently set some all-time record lows back at the end of last year. Since then, it has bounced back into positive territory, but over the past couple of days a new...
READ MORE
MEMBERS ONLY

Anatomy of a Doji (STAA)
STAA put in a huge Doji on its daily chart today. Technically, a doji is a candlestick where the open and the close are the same. The huge upper shadow and relatively small lower candle makes STAA's Doji especially striking. It is very close to being a "...
READ MORE
MEMBERS ONLY
NEW BLOGS, NEW CHARTWATCHERS, NEW BOOK FROM JOHN MURPHY!
Hello Fellow ChartWatchers!
This week is the start of big changes here at StockCharts.com. We are moving much of our free content over into a new set of Blogs. ("Blogs" are Web Logs - collections of articles on a particular topic.) Things like, well, this newsletter are...
READ MORE
MEMBERS ONLY

DROOY - Bullish CMF Signal Confirmed by Long-Term Crossover
(Click here for a live version of this chart.)
Durban Roodeport Deep (DROOY) is a major gold mining company in South Africa. Their stock jumped in late November generating a "buy" signal from the standard 20-day Chaiken Money Flow (CMF) in early December. The longer term moving averages...
READ MORE
MEMBERS ONLY

Sirius XM Radio's (SIRI) Runaway Gap Up
( Click here for a live version of this chart.)
SIRI gapped up on the open and moved higher from there today on strong volume. Very nice turnaround play with resistance at 0.225. When a stock that is already in an uptrend gaps up like this, it is called a...
READ MORE
MEMBERS ONLY

Hitachi's (HIT) RSI Rebound
( Click here for a live version of this chart.)
Hitachi's RSI indicator moved back above 30 today after sinking down around 20 two days ago. This big jump indicates that an important rebound is underway and has a good chance of continuing at least until the RSI crosses...
READ MORE
MEMBERS ONLY

NetFlix (NFLX) has a Powerful MA Crossover
The 50-day Simple Moving Average for NetFlix moved above the 200-day Simple Moving Average today in a very convincing manner confirming the stock's gains over the past couple of days. No other heavily traded Nasdaq stock has a similarly bullish signal right now....
READ MORE
MEMBERS ONLY

Quadruple Bottom P&F Breakdown for Target (TGT)
( Click here to see a live version of this chart.)
Target Corp's Point and Figure chart broke below the bottom of the Quadruple Bottom Pattern that it had put in over the past 5 weeks. See the 4 "O's" in the boxes at 32?...
READ MORE
MEMBERS ONLY

Dark Cloud Cover for ODFL
( Click here to see a live version of this chart.)
The Dark Cloud Cover candlestick pattern occurs when a stock that is in an uptrend has a tall hollow candle that is followed by a tall filled candle that extends below the mid-point of the first candle.
A Dark Cloud...
READ MORE
MEMBERS ONLY

Nasdaq Bullish Percent Index will Signal the Return of the Bulls
(Click on the chart for a live version)
The Nasdaq Bullish Percent Index represents the percentage of Nasdaq stocks that have Bullish signals on their P&F charts. Typically, readings oscillate around 50. Readings above 60 are rare and indicate a strong rally is underway. Readings below 20 are...
READ MORE
MEMBERS ONLY
TECHNICAL ANALYSIS 101 - PART 1
This is the first part of a series of articles about Technical Analysis from a new course we're developing. If you are new to charting, these articles will give you the "big picture" behind the charts on our site. if you are an "old hand&...
READ MORE
MEMBERS ONLY
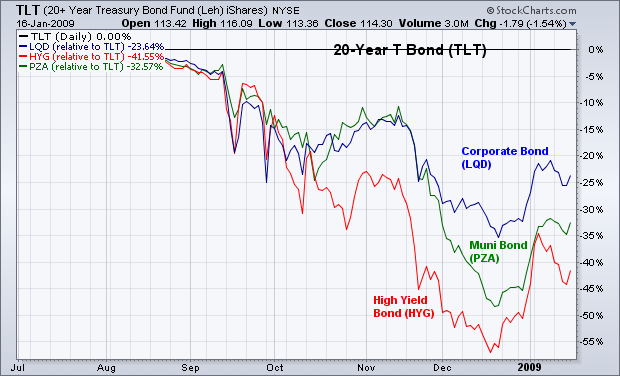
OTHER BOND CATEGORIES ARE BOUNCING
I recently wrote about how investment grade corporate bonds were starting to gain some ground on Treasury bonds. Today, I'm adding two other bond categories to that list. The flat line in Chart 1 is the 20+Year Treasury Bond iShares (TLT) which has been the strongest part...
READ MORE
MEMBERS ONLY
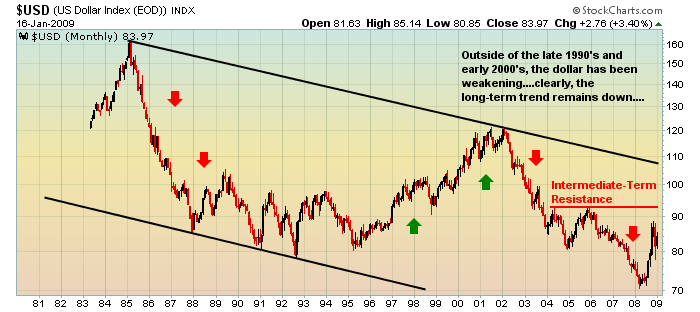
IS THE DOLLAR TOPPING?
An interesting result of the government bailout of the financials and automakers, along with the huge economic stimulus package will be the long-term impact on the U.S. dollar. Can the dollar maintain its relative value as interest rates fall and deficits mount? Let's take a look at...
READ MORE
MEMBERS ONLY
RALLY FAILURE
In my January 2 article I pointed out that the stock market was overbought by bear market standards, but that the rally had plenty of internal room for prices to expand upward if bullish forces were to persist. There was a brief rally and a small breakout, but then the...
READ MORE
MEMBERS ONLY
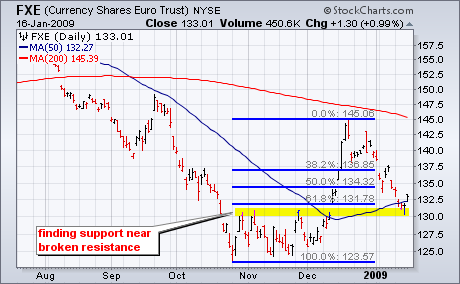
EURO FINDS SUPPORT AS DOLLAR HITS RESISTANCE
With a bounce on Friday, the Euro Trust ETF (FXE) found support from a confluence of indicators and chart features. First, broken resistance turns into support in 130-132 area. Second, there is support in this area from the 50-day moving average. Third, the decline over the last few weeks retraced...
READ MORE
MEMBERS ONLY
WHAT LIES AHEAD?
In order to gain a decent perspective as to where we might go in 2009, it's always helpful to take a look at the past to see how we got here. 2008 was a horrible year for the major stock market indices. The Dow Jones, S&P...
READ MORE
MEMBERS ONLY
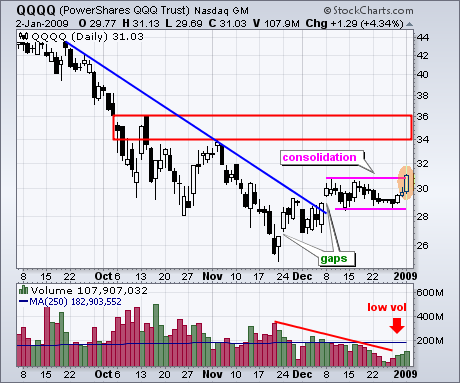
QQQQ BREAKS CONSOLIDATION RESISTANCE
QQQQ broke consolidation resistance with a big surge on the first trading day of the year. After surging in late November and early December with two gaps, QQQQ stalled for most of December with a flat trading range. The consolidation pattern looks like a flag and the upside breakout calls...
READ MORE
MEMBERS ONLY
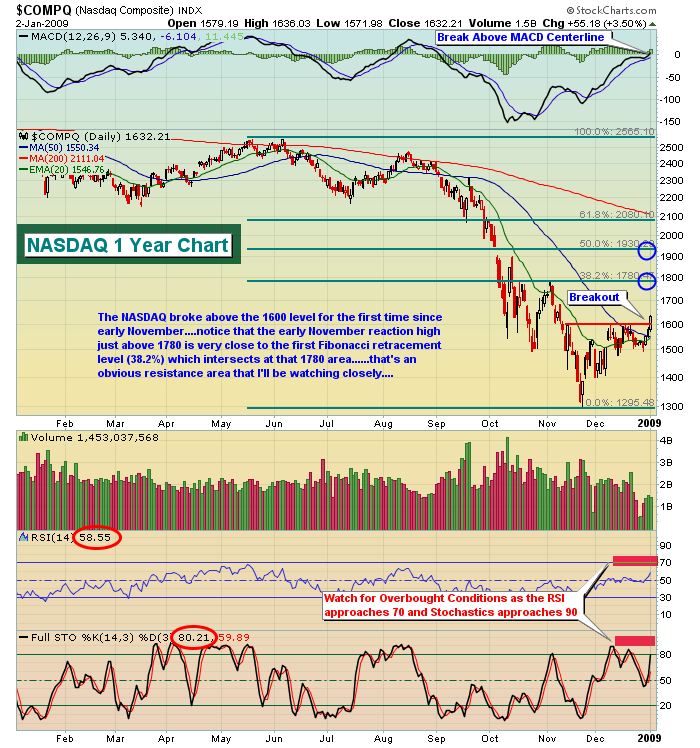
HOW OVERBOUGHT IS IT?
For the last few weeks the stock market has been drifting higher on low volume, and there is no doubt in my mind that the Fed/Treasury has been the invisible hand that has quickly moved in to squelch any selling that started. Under these conditions, I find it difficult...
READ MORE
MEMBERS ONLY
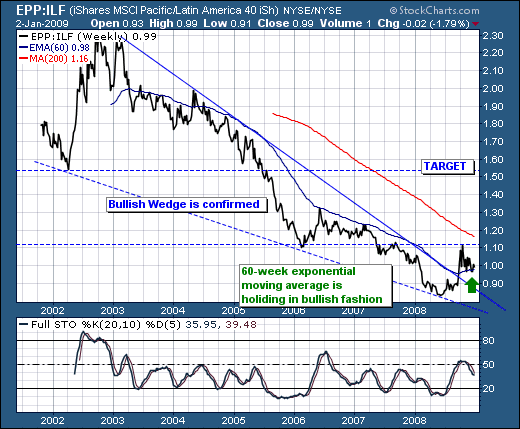
PURSUING HEDGING STRATEGIES IN 2009
As the credit crisis continues apace into 2009, we believe the time is rather "ripe" for pursuing various hedging "thematic" strategies to profit from relative valuations across the globe. Quite simply, we believe that the credit crisis will fundamentally impact various global regions in a different...
READ MORE
MEMBERS ONLY
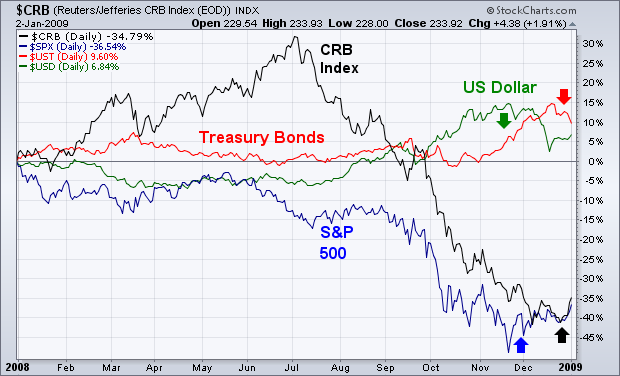
INTERMARKET TRENDS TURN MORE POSITIVE
Chart 1 shows how the interaction between the four main asset classes unfolded during 2008 and how they're entering 2009. The two weakest assets were commodities and stocks. The two strongest were Treasury bonds and the dollar. During the first half of the year, commodities were the strongest...
READ MORE
MEMBERS ONLY
STYLEBUTTONS GIVE YOU MULTIPLE WAYS TO ANALYZE A STOCK INSTANTLY
Hello Fellow ChartWatchers!
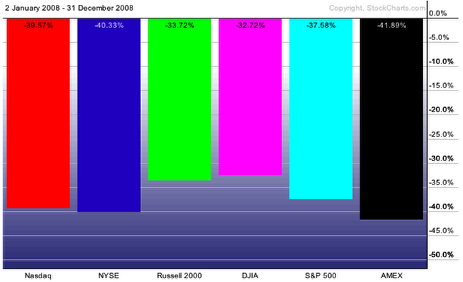
First off, Happy 2009! Let's hope this year is better than 2008 - one of the all time stinkers in terms of stock market performace. How bad was it? Here ya go:
Ugh. Well, let's not dwell on it too much. Instead I...
READ MORE
MEMBERS ONLY
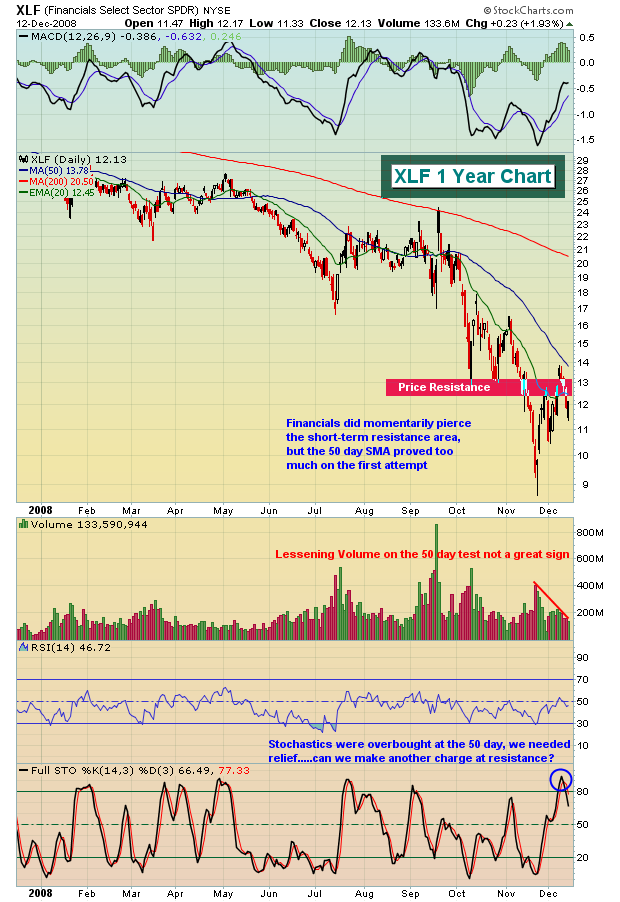
MARKET RALLIES TO FIND RESISTANCE
I knew eventually we'd get a rally with legs. The recent long-term positive divergences across our major indices suggested a 50 day SMA test was on the horizon and that's exactly what we saw this past week. Key indices hit resistance and, not surprisingly, backed away...
READ MORE
MEMBERS ONLY
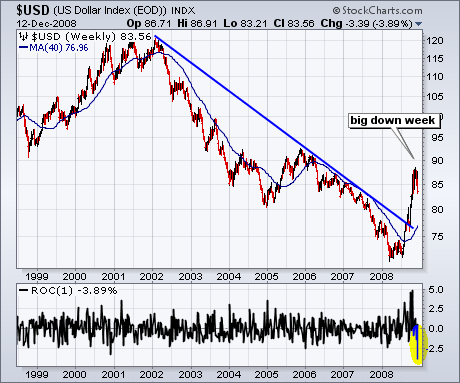
GOLD BENEFITS FROM WEAK DOLLAR
After surging from the low 70s to the upper 80s, the U.S. Dollar Index ($USD) experienced its sharpest decline in years. In fact, this week's decline was the sharpest in over 10 years. The bottom indicator window shows the 1-week Rate-of-Change dipping to -3.89% this week....
READ MORE
MEMBERS ONLY
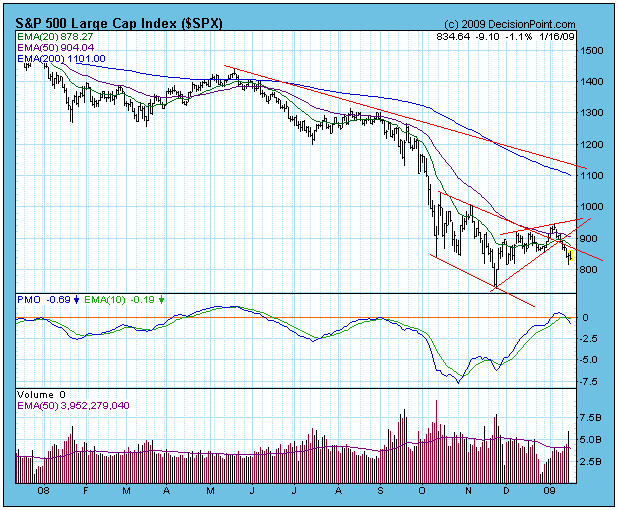
TIME RUNNING OUT ON RALLY
Last week we looked at a descending wedge pattern on the S&P 500 chart that could have sparked a rally had it resolved to the upside. Prices actually did break upward, but volume was poor, and the up move stalled immediately. Now there is an ascending wedge pattern...
READ MORE
MEMBERS ONLY
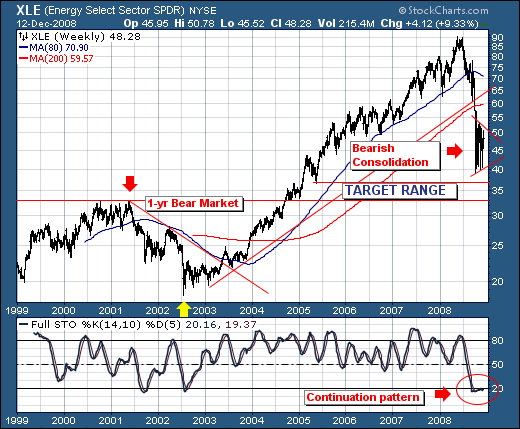
WORLD MARKETS, CRUDE OIL, AND S&P ENERGY
As we approach the end of the year, we find world stock markets attempting to trade a bit higher, although volatility remains quite high, but off it's worst high levels. However, we believe it shall not be low for very long; hence our propensity is to use this...
READ MORE
MEMBERS ONLY
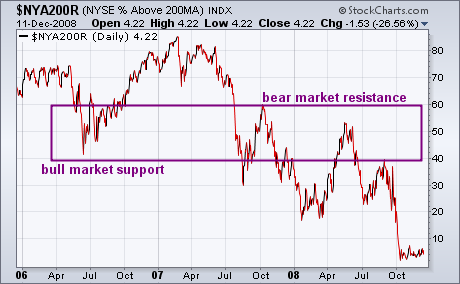
% NYSE STOCKS ABOVE 200 AVERAGE
A reliable measure of the market's strength or weakness can be found in the % of NYSE stocks trading above their 200-day averages. That's because 200-day averages are used to measure a market's long-term trend. [A 50-day line measures short- and intermediate- market trends]. Chart...
READ MORE
MEMBERS ONLY
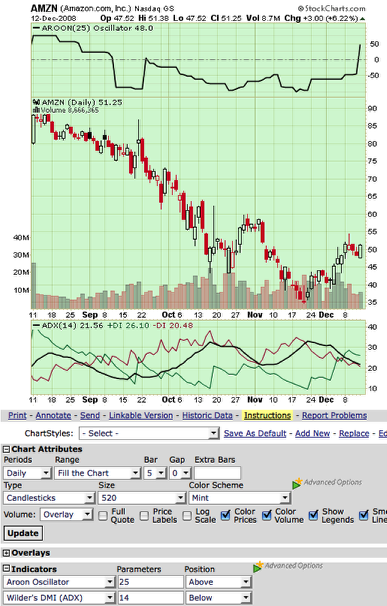
CHARTSTYLES ARE POWERFUL, UNDERUSED FEATURE OF STOCKCHARTS
Hello Fellow ChartWatchers!
Happy Holidays and welcome to our December issue of ChartWatchers. We only do one newsletter in December and so you can bet it's a good one. John, Arthur, Carl, Richard and Tom are all focused on the market but I wanted to take time today...
READ MORE
MEMBERS ONLY
LOOK UNDER THE SURFACE
This has been one ugly bear season. It cannot be compared to anything else seen on the S&P 500 since 1950. Not even close. But I'll say one thing - there's an awful lot of horrible economic news priced into this market right now....
READ MORE
MEMBERS ONLY
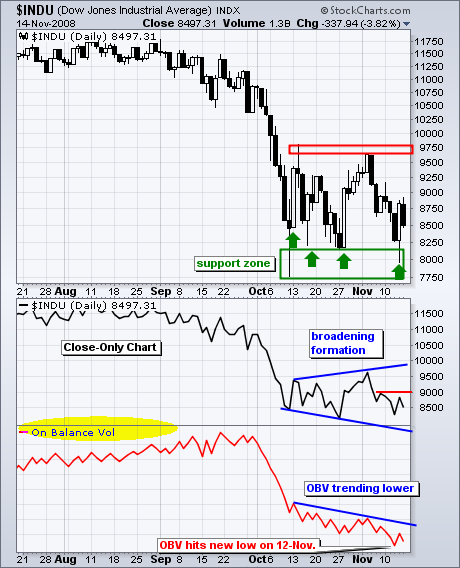
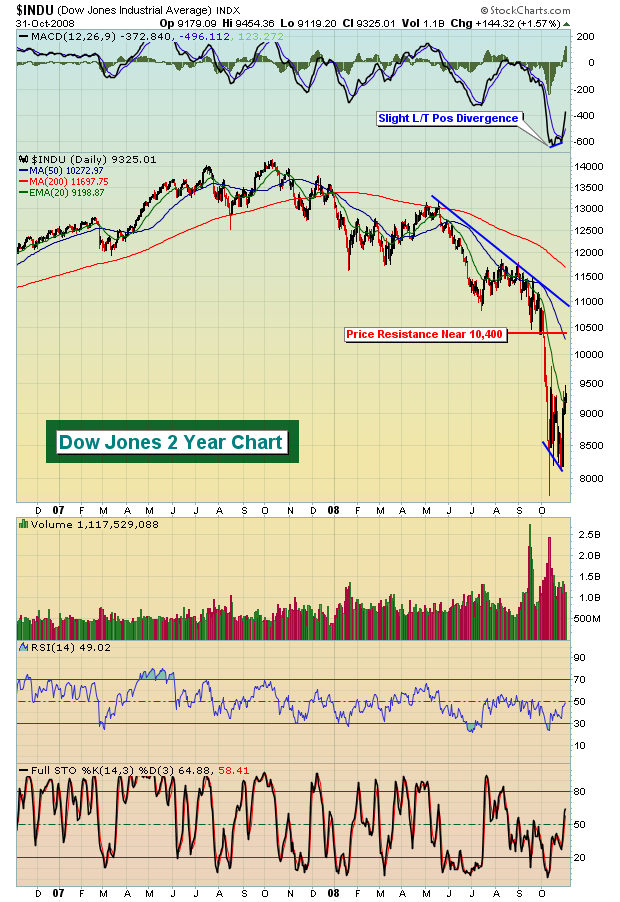
DOW BATTLES SUPPORT
The Dow Industrials surged off support for the fourth time in five weeks. Will this bounce produce a breakout or failure? As the candlestick chart below shows, the Dow Industrials is locked in a volatile trading range with support around 8000 and resistance around 9700. The Dow dipped below 8250...
READ MORE
MEMBERS ONLY
RYDEX RATIOS DIVERGE
Decision Point charts a couple of indicators that are useful in determining investor sentiment based on actual deployment of cash into Rydex mutual funds. The Rydex Asset Ratio is calculated by dividing total assets in Bear plus Money Market funds by total assets in Bull funds. The Rydex Cash Flow...
READ MORE
MEMBERS ONLY
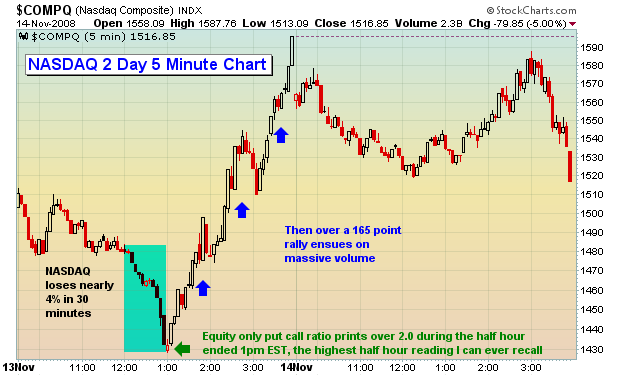
S&P JUMPS 6% AFTER TOUCHING NEW LOW
After dropping briefly to the lowest level since March 2003, the S&P 500 achieved an upside reversal day (as did all of the other major indexes) that resulted in a 6% gain. It also did that on the highest volume in weeks. The fact that the S&...
READ MORE
MEMBERS ONLY
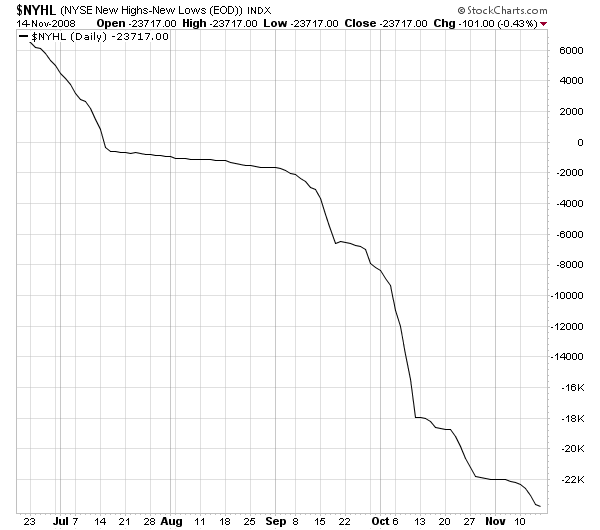
NYSE HIGH-LOW LINE TELLS THE TALE
StockCharts.com is all about visually representing what's going on in the markets. Here's a sobering visual representation for you:
Daily NYSE High-Low Line:
Weekly NYSE High-Low Line:
You can view these two charts anytime at https://stockcharts.com/charts/gallery.html?$NYHL
The $NYHL index...
READ MORE
MEMBERS ONLY
HISTORY REPEATS ITSELF AGAIN AND AGAIN AND AGAIN
Previously, I've mentioned a favorite indicator of mine - The Bowley Trend. The Bowley Trend is an analysis of stock market history, dating back to 1950 on the S&P 500 and 1971 on the NASDAQ. It identifies discernible bullish and bearish trends that have emerged over...
READ MORE
MEMBERS ONLY
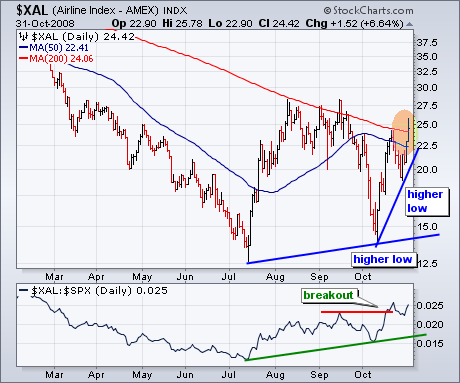
AIRLINES TAKE OFF
The Amex Airline Index ($XAL) is leading the market higher with a break above two key moving averages this week. XAL produced one of the sharpest October recoveries with surge from 14 to 25 over the last three weeks. This surge carried the index above the 50-day moving average and...
READ MORE
MEMBERS ONLY
CHANGING WITH THE MARKET
When the market changes, we must change our tactics, strategies, and analysis techniques to accommodate the new market conditions. This is not a new idea, but it is one that is not very widely recognized, particularly when applied to the long-term. In recent writings I have emphasized that we are...
READ MORE
MEMBERS ONLY
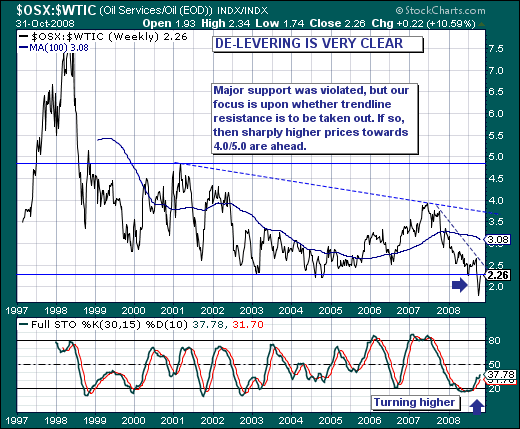
WILL OIL SERVICES RETEST RECENT LOWS?
The world stock markets remain rather "volatile" as the credit crisis continues to unfold, while this volatility pendulum continues to create some very unique and interesting value propositions we haven't seen in quite some time. Our focus at present is the relative relationship of the Oil...
READ MORE
MEMBERS ONLY
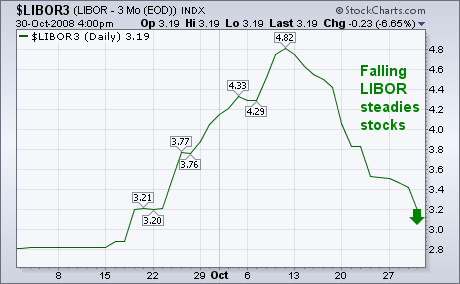
LIBOR DROP ENCOURAGES MARKETS
One of the recent positive trends is the continuing drop in the three-month London Interbank Overnight Lending Rate (LIBOR). That rate determines what banks charge each other for loans. During the credit freeze that started in mid-September, the LIBOR jumped from 2.8% to 4.8% as stocks fell sharply....
READ MORE
MEMBERS ONLY
HISTORY REPEATS ITSELF... AGAIN AND AGAIN
Hello Fellow ChartWatchers,
As you (hopefully) know already, StockCharts.com also has an online bookstore that is dedicated to providing great investment-oriented books at great prices. (We work hard to keep the prices as low as possible. No, seriously! From a business perspective we just want to break even on...
READ MORE
MEMBERS ONLY
IS THIS THE BUFFETT-BOTTOM?
Warren Buffett said he was buying stocks this past week. Should you? Well, it depends. If you buy stocks on a regular basis as part of a disciplined strategy - say in your 401(k) plan - then keep buying. The idea of buying stocks over the long haul is...
READ MORE
