MEMBERS ONLY
Stay Ahead: Key Sentiment Indicators to Track in October 2024!
by David Keller,
President and Chief Strategist, Sierra Alpha Research
Which market sentiment indicators should we follow to validate the current bull market phase and anticipate a potential market top? David Keller, CMT breaks down three sentiment indicators he's watching in October 2024, explains their calculations and methodology, reviews their signals during previous bull market cycles, and describes...
READ MORE
MEMBERS ONLY
The One Volume Indicator You Should Follow
by David Keller,
President and Chief Strategist, Sierra Alpha Research
KEY TAKEAWAYS
* While the daily volume reading can give us limited insight on the balance of buyers and sellers, Chaikin Money Flow gives a much clearer picture of trends in volume.
* Major tops in the last 12-18 months have been marked with a particular pattern in the S&P...
READ MORE
MEMBERS ONLY
Three Thoughts on Risk Management for October 2024
by David Keller,
President and Chief Strategist, Sierra Alpha Research
KEY TAKEAWAYS
* Watch the S&P 500's "line in the sand" for a signs of a breakdown in the major averages.
* Market breadth indicators could provide an early warning of a potential breakdown for the benchmarks.
* By being thoughtful about your position sizing for each...
READ MORE
MEMBERS ONLY
Market Top in October? 2007 vs. 2024
by David Keller,
President and Chief Strategist, Sierra Alpha Research
Will we see a major market top during the month of October? Dave breaks down three market breadth indicators and compares their current configuration to what we observed at the 2007 market top. He then goes through the charts and reviews market topping conditions from a breadth perspective using the...
READ MORE
MEMBERS ONLY
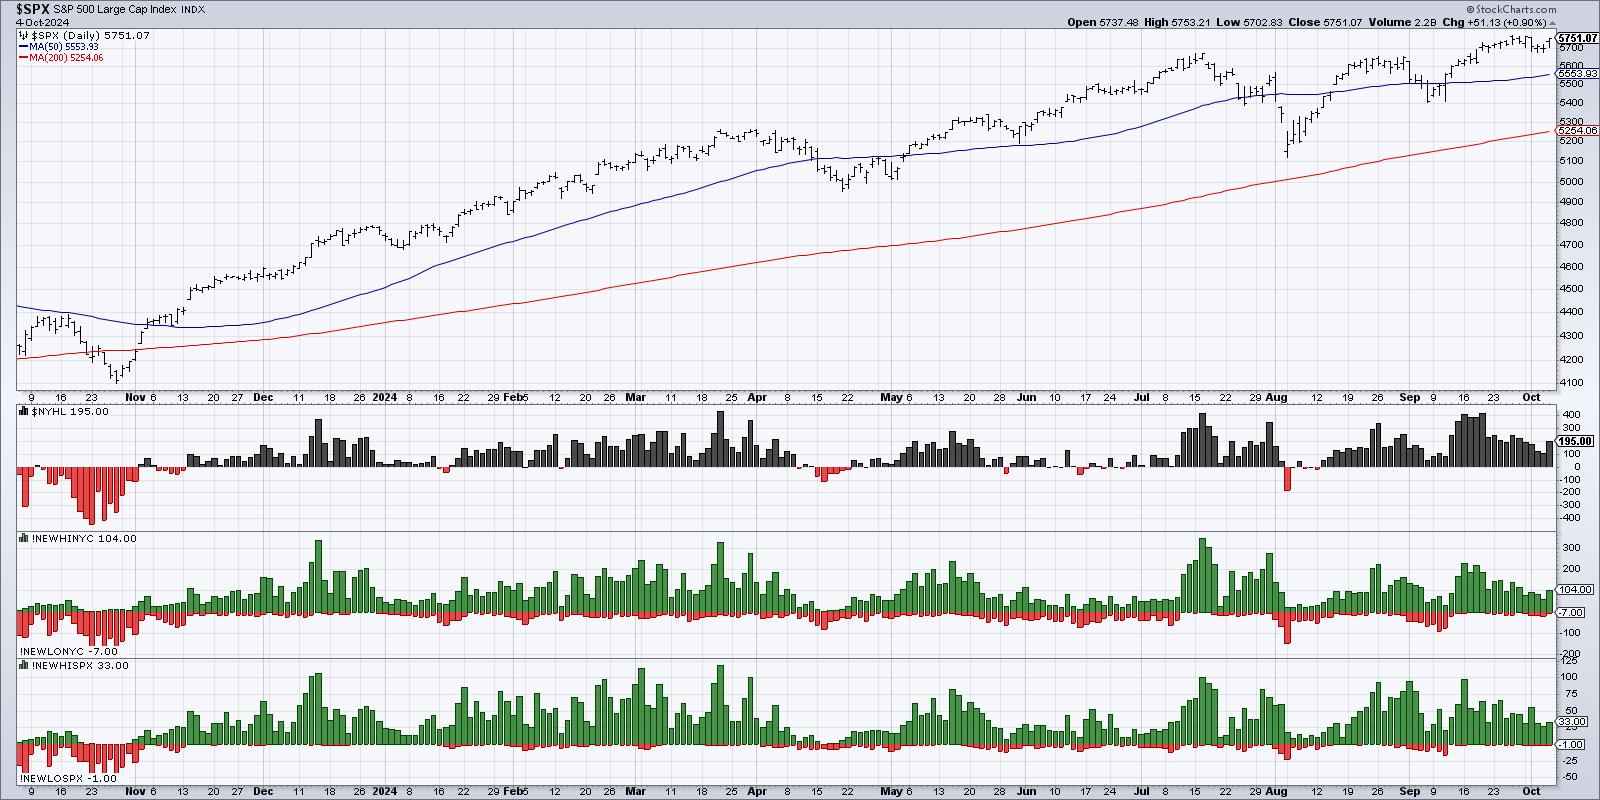
Does the Market Have Bad Breadth?
by David Keller,
President and Chief Strategist, Sierra Alpha Research
KEY TAKEAWAYS
* There have been less new 52-week highs since mid-September, suggesting leaders are falling off.
* The percent of S&P 500 members above their 50-day moving average is below 75%, which often serves as a threshold for a downturn.
* The S&P 500 Bullish Percent Index remains...
READ MORE
MEMBERS ONLY
Top Ten Charts to Watch for October 2024
by David Keller,
President and Chief Strategist, Sierra Alpha Research
As we near the end of what has been a fairly solid Q3 for the equity markets, we are left with the eternal question for investors: "What's next?"
We now have the Fed's first rate cut in the rearview mirror, with multiple rate cuts...
READ MORE
MEMBERS ONLY
Bullish or Bearish? The Truth About Rate Cuts and Stock Performance
by David Keller,
President and Chief Strategist, Sierra Alpha Research
So the first Fed rate cut is behind us, and we are no longer in a "higher for longer" period, but in a new rate cut cycle which will most likely last well into 2025. So that's good news for stocks, right? Well, not necessarily.
The...
READ MORE
MEMBERS ONLY
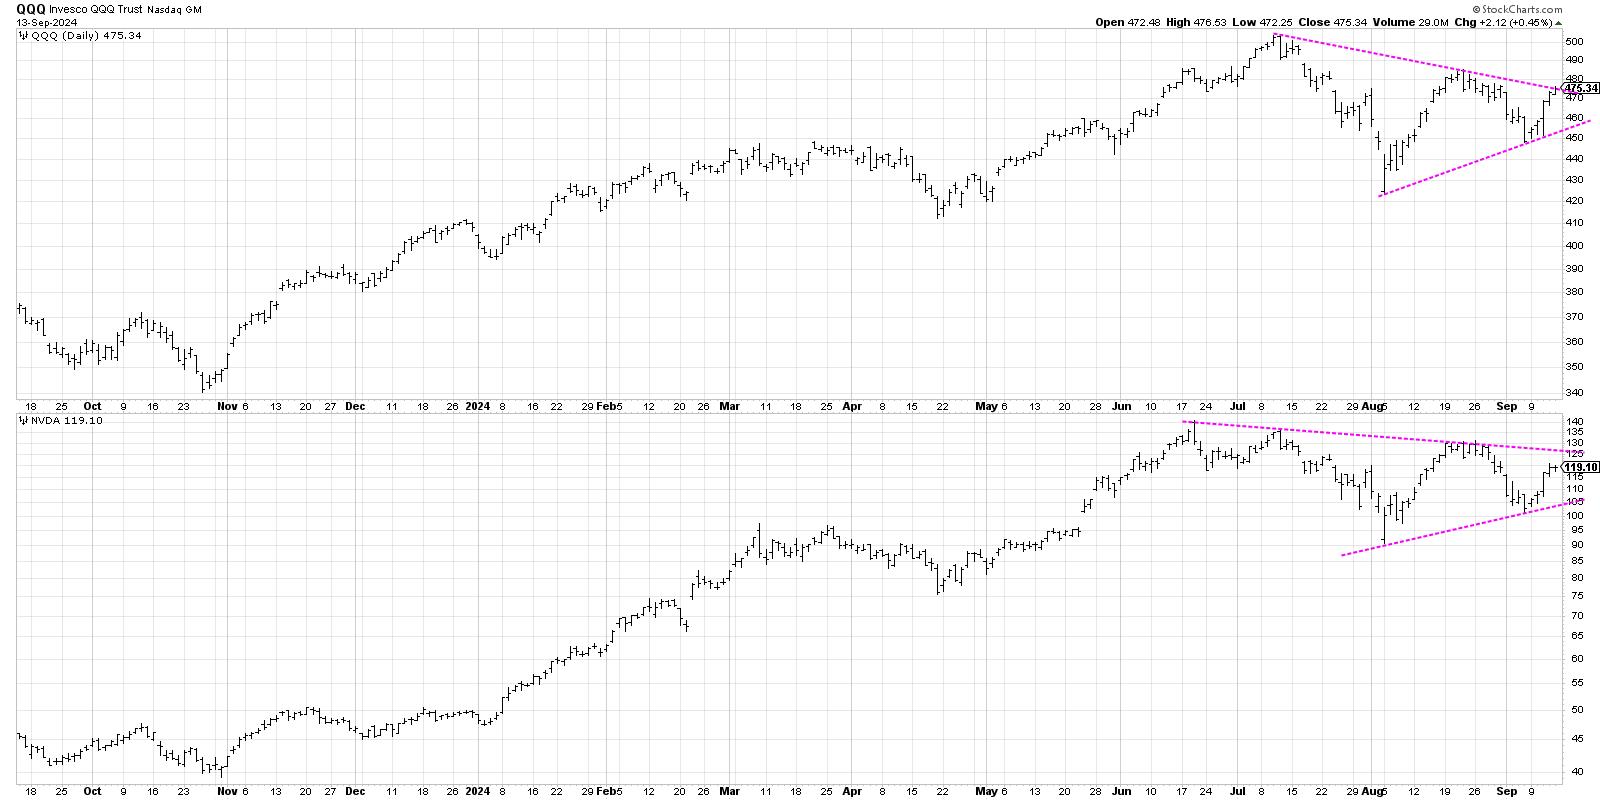
Here's My Most-Likely Scenario for QQQ
by David Keller,
President and Chief Strategist, Sierra Alpha Research
While the S&P 500 finished the week once again testing new all-time highs around 5650, the Nasdaq 100 remains rangebound in a symmetrical triangle or "coil" pattern. While this pattern does not necessarily suggest a potential next move for the QQQ, it did lead me to...
READ MORE
MEMBERS ONLY
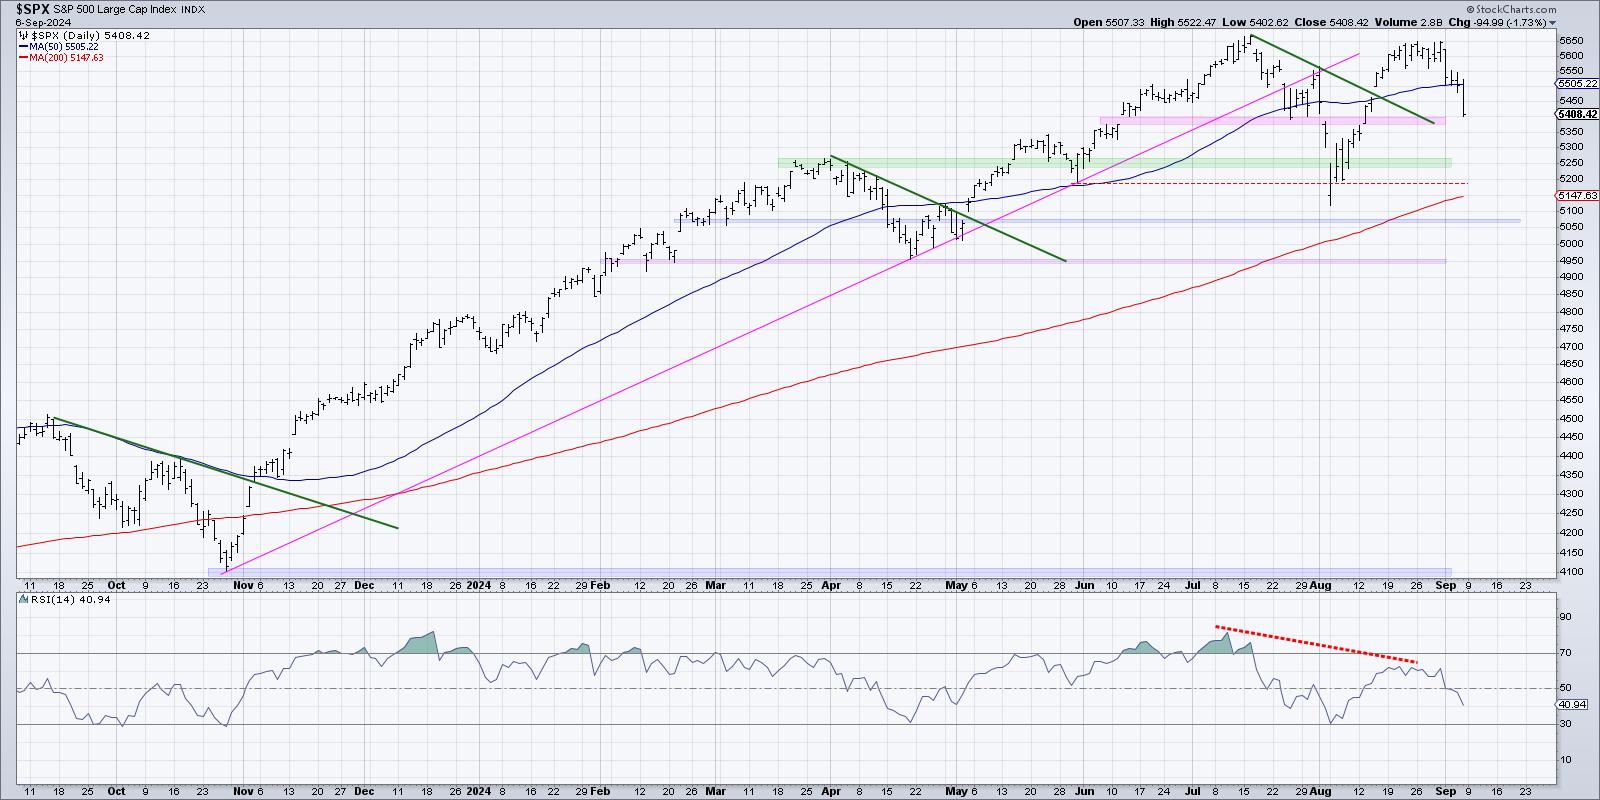
Three Charts Screaming Market Top
by David Keller,
President and Chief Strategist, Sierra Alpha Research
KEY TAKEAWAYS
* Weaker price momentum suggests an exhaustion of buyers.
* The VIX pushed back above 20 this week, indicating a higher likelihood of a price correction.
* The equal-weighted S&P 500 made a new all-time high in August, but that was not echoed with a new high from the...
READ MORE
MEMBERS ONLY
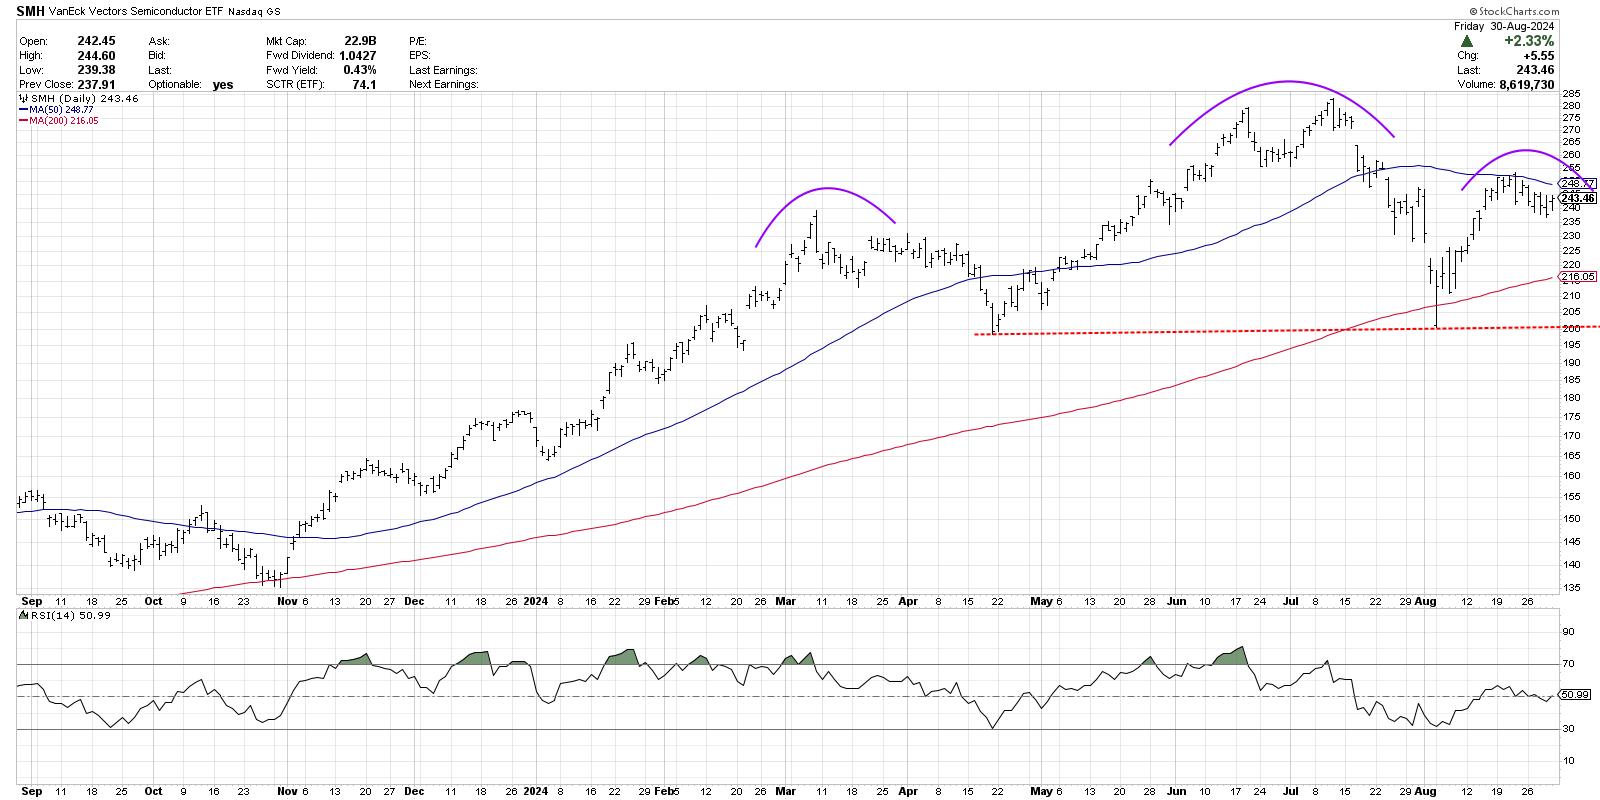
What Would a Top in Semiconductors Mean for the S&P 500?
by David Keller,
President and Chief Strategist, Sierra Alpha Research
KEY TAKEAWAYS
* A head-and-shoulders top pattern has to complete three phases before it can be considered valid.
* Even if semiconductors would complete this bearish price pattern, strength in other sectors suggests limited impact on the broader equity space.
After Nvidia (NVDA) dropped after earnings this week, investors are once again...
READ MORE
MEMBERS ONLY
NVDA Earnings Miss, Yet Dow Powers Higher
by David Keller,
President and Chief Strategist, Sierra Alpha Research
In this edition of StockCharts TV'sThe Final Bar, Dave breaks down key sector leadership themes and why growth stocks like Nvidia continue to take a back seat to value-oriented sectors. He speaks to the inverted yield curve, performance of the equal-weighted S&P 500 vs. the Magnificent...
READ MORE
MEMBERS ONLY
Earnings Provide Another Nail in the Retail Coffin
by David Keller,
President and Chief Strategist, Sierra Alpha Research
In this edition of StockCharts TV'sThe Final Bar, Dave recaps a brutal day for retailers as ANF, FL, and BBWI drop on earnings misses. He also highlights the bullish primary trend for hold, shares two breakout names in the consumer staples sector, and breaks down key names in...
READ MORE
MEMBERS ONLY
Three Technology Stocks in Make or Break Scenarios
by David Keller,
President and Chief Strategist, Sierra Alpha Research
In this edition of StockCharts TV'sThe Final Bar, Dave focuses in on three key charts to watch in the technology sector as investors anxiously await NVDA earnings and Friday's inflation data. He also shares two important charts for tracking improving market breadth conditions and highlights the...
READ MORE
MEMBERS ONLY
Top Ten Charts for August: Two Bearish Turnaround Plays
by David Keller,
President and Chief Strategist, Sierra Alpha Research
In this edition of StockCharts TV'sThe Final Bar, Dave completes a five-part series covering ten charts to watch in August 2024, breaking down to stocks in established downtrends. What would we need to see to confirm a rotation from a distribution phase to an accumulation phase, and where...
READ MORE
MEMBERS ONLY
Top Ten Charts for August: Best Healthcare Stocks for August 2024
by David Keller,
President and Chief Strategist, Sierra Alpha Research
In this edition of StockCharts TV'sThe Final Bar, Dave continues a five-part series covering ten charts to watch in August 2024, honing in on two Health Care stocks showing renewed signs of strength. He also breaks down how earnings releases relate to price trends, and how investors should...
READ MORE
MEMBERS ONLY
Top Ten Charts for August: Two Key Defensive Plays
by David Keller,
President and Chief Strategist, Sierra Alpha Research
In this edition of StockCharts TV'sThe Final Bar, Dave continues a five-part series covering ten charts to watch in August 2024, with a focus today on Utilities and Real Estate. Why do low-beta, high-income stocks do so well in bearish market phases, and do we still see signs...
READ MORE
MEMBERS ONLY
Top Ten Charts for August: Two Tempting Consumer Staples Names
by David Keller,
President and Chief Strategist, Sierra Alpha Research
In this edition of StockCharts TV'sThe Final Bar, Dave continues a five-part series covering ten charts to watch in August 2024, focusing on potential ideas in the Consumer Staples sector. Are dividend-paying defensive names the way to ride out a period of market uncertainty?
This video originally premiered...
READ MORE
MEMBERS ONLY
Top Ten Charts for August: Two Magnificent 7 Stocks Worth Watching
by David Keller,
President and Chief Strategist, Sierra Alpha Research
In this edition of StockCharts TV'sThe Final Bar, Dave kicks off a five-part series covering ten charts to watch in August 2024, starting with two mega-cap growth stocks testing key resistance levels. Will they power up to new all-time highs into September?
This video originally premiered on August...
READ MORE
MEMBERS ONLY
What Inflation Fear? Strong Retail Sales Fuel Growth
by David Keller,
President and Chief Strategist, Sierra Alpha Research
In this edition of StockCharts TV'sThe Final Bar, Dave recaps another strong up day for growth leadership names, with ULTA and NVDA powering higher after retail sales numbers pushed aside inflation fears. He notes the cautious positioning in the NAAIM Exposure Index, Bitcoin's failed attempt to...
READ MORE
MEMBERS ONLY
Head and Shoulders Top for Semiconductors?
by David Keller,
President and Chief Strategist, Sierra Alpha Research
In this edition of StockCharts TV'sThe Final Bar, Dave shows how breadth conditions have evolved so far in August, highlights the renewed strength in the financial sector with a focus on insurance stocks, and describes how the action so far in Q3 could be forming a potential head-and-shoulders...
READ MORE
MEMBERS ONLY
The Growth Trade is Back!
by David Keller,
President and Chief Strategist, Sierra Alpha Research
In this edition of StockCharts TV'sThe Final Bar, Dave recaps an epic rally in mega cap growth stocks, with NVDA up over 6% and META threatening a new 52-week high. Dave highlights how gold and bond prices continue to rise in the face of stronger stocks, and breaks...
READ MORE
MEMBERS ONLY
Why Bonds and Gold Are Outperforming Stocks
by David Keller,
President and Chief Strategist, Sierra Alpha Research
In this edition of StockCharts TV'sThe Final Bar, Dave recaps a choppy Monday for the equity markets, as gold tests new all-time highs and interest rates continue to plummet. He highlights the stock to bond ratio, revisits the classic 60:40 ratio favored by investors, and breaks down...
READ MORE
MEMBERS ONLY
Three Market Sentiment Indicators Confirm Bearish Phase
by David Keller,
President and Chief Strategist, Sierra Alpha Research
KEY TAKEAWAYS
* The VIX reaching 65 signals extreme volatility and elevated risk of market downside
* The AAII Survey is close to showing more bears than bulls, which would line up with previous corrections
* The NAAIM Exposure Index indicates that money managers were rotating to defensive positioning in early July
While...
READ MORE
MEMBERS ONLY
How the PROS Time Entry Points
by David Keller,
President and Chief Strategist, Sierra Alpha Research
In this edition of StockCharts TV'sThe Final Bar, Dave presents a special all-mailbag episode, answering viewer questions on optimizing entry points for long ideas, best practices for point & figure charts, and the relationship between gold and interest rates.
See Dave's chart showing Zweig Breadth Thrust...
READ MORE
MEMBERS ONLY
Will the S&P 500 Break 5000 by September?
by David Keller,
President and Chief Strategist, Sierra Alpha Research
This week saw the major equity averages continue a confirmed pullback phase, with some of the biggest gainers in the first half of 2024 logging some major losses. Is this one of the most buyable dips of the year? Or is this just the beginning of a protracted decline with...
READ MORE
MEMBERS ONLY
S&P 500 Breaks Key Trendline as Growth Stocks Plunge
by David Keller,
President and Chief Strategist, Sierra Alpha Research
In this edition of StockCharts TV'sThe Final Bar, Dave previews earnings releases from TSLA and GOOGL, breaks down key levels to watch for SPOT, GE, and more, and analyzes the discrepancy between S&P 500 and Nasdaq breadth indicators.
See Dave's MarketCarpet featuring the Vanilla...
READ MORE
MEMBERS ONLY
Small Caps Surge, Markets React to TSLA & GOOGL Earnings
by David Keller,
President and Chief Strategist, Sierra Alpha Research
In this edition of StockCharts TV'sThe Final Bar, Dave previews earnings releases from TSLA and GOOGL, breaks down key levels to watch for SPOT, GE, and more, and analyzes the discrepancy between S&P 500 and Nasdaq breadth indicators.
This video originally premiered on July 23, 2024....
READ MORE
MEMBERS ONLY
The Stock Market is Bracing for Earnings IMPACT!
by David Keller,
President and Chief Strategist, Sierra Alpha Research
In this edition of StockCharts TV'sThe Final Bar, Dave breaks down today's upside recovery day for stocks, then shares the charts of TSLA, NVDA, and more. He also illustrates the conflicting messages from AAII and NAAIM sentiment surveys, and also highlights the VIX testing the key...
READ MORE
MEMBERS ONLY
Hindenburg Omen: The Truth, Effects, and Duration
by David Keller,
President and Chief Strategist, Sierra Alpha Research
In this edition of StockCharts TV'sThe Final Bar, Dave answers viewer questions on the best time frames for viewing charts, insights on using Vanguard ETFs for sector rotation, the duration and effect of the Hindenburg Omen indicator, how stocks are indexed in Dow Jones Groups on StockCharts, and...
READ MORE
MEMBERS ONLY
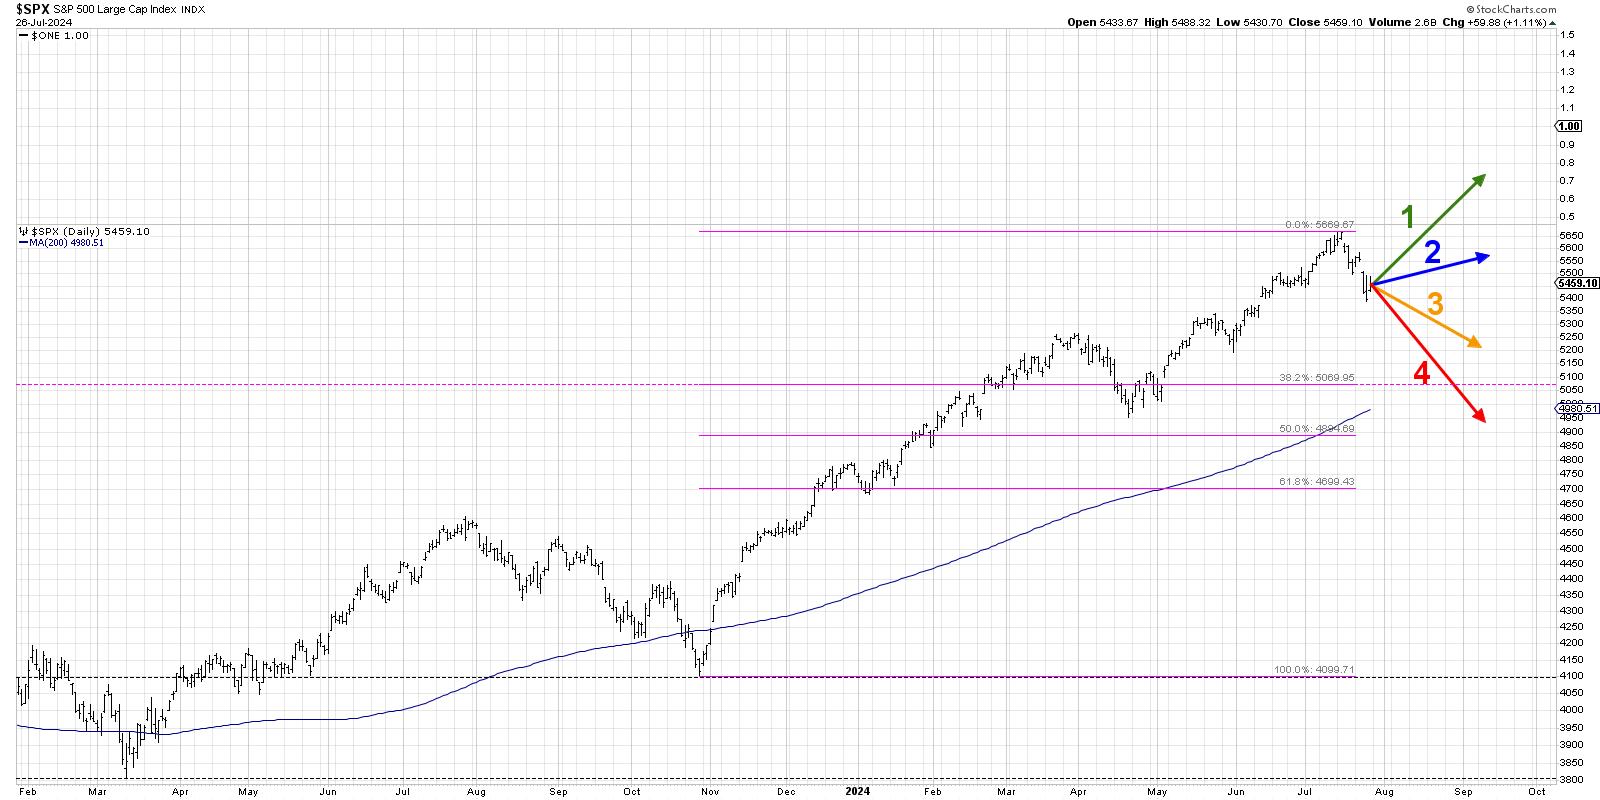
What Does a Market Top Look Like?
by David Keller,
President and Chief Strategist, Sierra Alpha Research
The S&P 500 remains in a primary uptrend, as confirmed by a fairly consistent pattern of higher highs and higher lows. But what would confirm that a top is in place for our major equity benchmarks? To answer that, it may be helpful to review other charts that...
READ MORE
MEMBERS ONLY
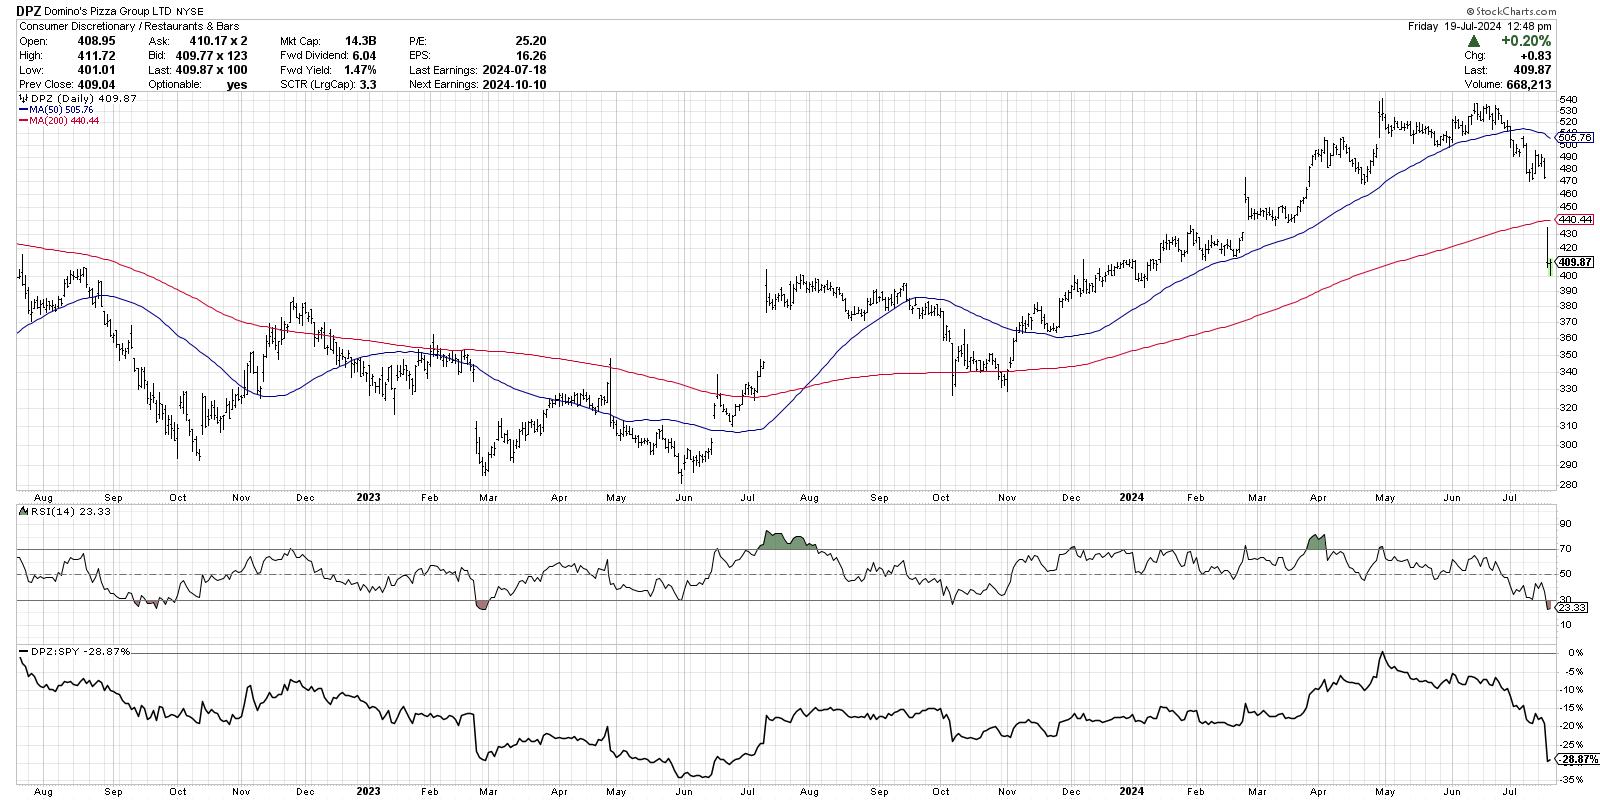
VIX SPIKES! Is a Market Correction Coming?
by David Keller,
President and Chief Strategist, Sierra Alpha Research
In this edition of StockCharts TV'sThe Final Bar, Dave shares a market update including key levels to watch for the S&P 500 index, what a VIX above 15 means for a possible market correction, the improvement in value-oriented sectors, and why DPZ may be the world&...
READ MORE
MEMBERS ONLY
Dow Theory Bull Confirmed! What Happens Next?
by David Keller,
President and Chief Strategist, Sierra Alpha Research
In this edition of StockCharts TV'sThe Final Bar, Dave comments on the Newer Dow Theory signal, improving market breadth conditions, impact of lower interest rates, and key levels to watch for GLD, UNH, CAT, and BAC. He also breaks down today's rally driven by small caps...
READ MORE
MEMBERS ONLY
Small Caps & Value Sectors are Booming (For Now)
by David Keller,
President and Chief Strategist, Sierra Alpha Research
In this edition of StockCharts TV'sThe Final Bar, Dave recaps a strong Monday for value stocks, with the Financial and Energy sectors leading the S&P 500 and Nasdaq to new highs. He shares an update on the Hindenburg Omen, how Bitcoin has regained its 200-day moving...
READ MORE
MEMBERS ONLY
How To Manage Risk Using Technical Analysis!
by David Keller,
President and Chief Strategist, Sierra Alpha Research
In this edition of StockCharts TV'sThe Final Bar, Dave completes a three-part series based on the successful "Top Ten Charts" episodes ofThe Final Bar. Today, he wraps the series with talks about risk management and how to use technical analysis tools to better manage risk vs....
READ MORE
MEMBERS ONLY
The BEST Way to Track Stock and ETF Performance
by David Keller,
President and Chief Strategist, Sierra Alpha Research
In this edition of StockCharts TV'sThe Final Bar, available to watch below, Dave continues a three-part series on selecting top charts to follow every month. In this second episode, Dave reviews charts he and Grayson Roze selected in May and June, reflecting on what has happened, what has...
READ MORE
MEMBERS ONLY
Identifying Top Charts with Upside Potential in 2024
by David Keller,
President and Chief Strategist, Sierra Alpha Research
In this edition of StockCharts TV'sThe Final Bar, available to watch below, Dave begins a three-part series on selecting top charts to follow every month. In this first episode, he shares how he and Grayson Roze select the charts to include in the Top 10 lists using the...
READ MORE
MEMBERS ONLY
The Chart to Help Navigate a Summer Market Top
by David Keller,
President and Chief Strategist, Sierra Alpha Research
KEY TAKEAWAYS
* Value sectors have been consistently underperforming the benchmarks since the April market low
* Technology has outperformed the S&P 500 as well as other growth sectors in 2024
* Defensive sectors like Utilities and Consumer Staples may be the most important to watch, as they can demonstrate investor...
READ MORE
MEMBERS ONLY
Technology Shares SOAR to New All-Time Highs
by David Keller,
President and Chief Strategist, Sierra Alpha Research
In this edition of StockCharts TV'sThe Final Bar, available to watch below, Dave recaps a shortened trading session marked by strength in the technology sector, potential breakouts in gold stocks, and key levels to watch as the S&P 500 index makes a new closing high on...
READ MORE
MEMBERS ONLY
Should You Be Worried About Poor Market Breadth?
by David Keller,
President and Chief Strategist, Sierra Alpha Research
In this edition of StockCharts TV'sThe Final Bar, available to watch below, Dave celebrates the S&P 500 closing above 5500, laments the lack of market breadth, and provides updates on the infamous Hindenburg Omen. He also breaks down key levels to watch on charts of V,...
READ MORE
MEMBERS ONLY
AAPL and TSLA Kick Off Q2 With BREAKOUTS!
by David Keller,
President and Chief Strategist, Sierra Alpha Research
In this edition of StockCharts TV'sThe Final Bar, available to watch below, Dave lays out the strong seasonal pattern for the S&P 500 in July, highlights the breakouts in AAPL and TSLA, shares the painful breakdowns in MGM, WM and CCL, and addresses the sudden rise...
READ MORE