MEMBERS ONLY
Bearish Engulfing Pattern Marks Top For NVDA?
by David Keller,
President and Chief Strategist, Sierra Alpha Research
KEY TAKEAWAYS
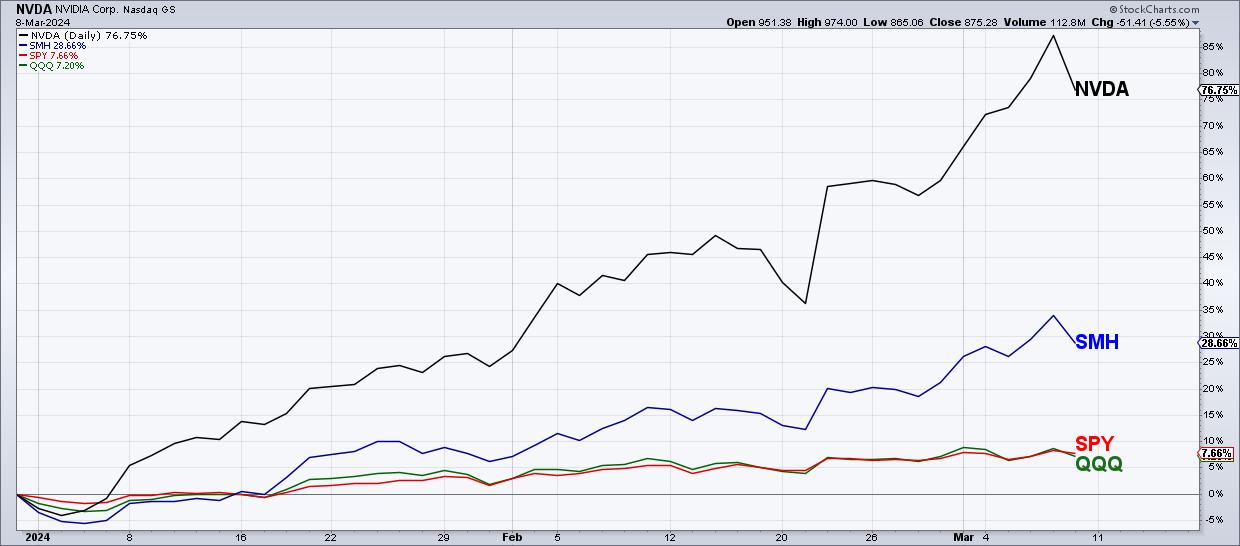
* Nvidia is up 77% year-to-date, far outpacing the S&P 500 and Nasdaq which are both up about 7-8%.
* A bearish engulfing pattern is a two-bar candle pattern indicating short-term distribution and negative sentiment.
* Downside targets for NVDA can be identified using trendlines and Fibonacci retracements.
Large-cap...
READ MORE
MEMBERS ONLY
Top 10 Actionable Charts to Watch 2024
by David Keller,
President and Chief Strategist, Sierra Alpha Research
by Grayson Roze,
Chief Strategist, StockCharts.com
In this edition of StockCharts TV'sThe Final Bar, Grayson and Dave run through the 10 charts they feel present actionable opportunities based on their technical analysis setups. They'll cover breakout strategies, moving average techniques, relative strength, and much more. And you'll have ten new...
READ MORE
MEMBERS ONLY
Small Caps Breaking Out BULLISH
by David Keller,
President and Chief Strategist, Sierra Alpha Research
In this edition of StockCharts TV'sThe Final Bar, Dave interviews Ari Wald, CFA CMT of Oppenheimer. He also covers Kroger, the iShares S&P 500 Value ETF, and Costco.
This video originally premiered on March 7, 2024. Watch on our dedicated Final Bar pageon StockCharts TV!
New...
READ MORE
MEMBERS ONLY
AAPL and TSLA Stocks Are COLLAPSING!
by David Keller,
President and Chief Strategist, Sierra Alpha Research
In this edition of StockCharts TV'sThe Final Bar, Dave highlights mega-cap growth names that are in full breakdown mode, including TSLA, AAPL, and GOOGL. He also updates the latest market breadth indicators which suggest more of a leadership rotation into value-oriented sectors, and even Consumer Staples names including...
READ MORE
MEMBERS ONLY
Bitcoin Tests All-Time Highs While Growth Stocks Sag
by David Keller,
President and Chief Strategist, Sierra Alpha Research
In this edition of StockCharts TV'sThe Final Bar, Dave breaks down the hourly chart of Bitcoin and highlights recent breakouts for regional banks. Guest Julius de Kempenaer of RRG Research focuses in on the Communication Services sector, including META, DIS, and GOOG, and shows how defensive sectors have...
READ MORE
MEMBERS ONLY
Would You Rather Own AMZN or AAPL Stock?
by David Keller,
President and Chief Strategist, Sierra Alpha Research
In this edition of StockCharts TV'sThe Final Bar, Dave shows how the Magnificent 7 has become much less of a comparable group of stocks, with TSLA, AAPL, and GOOGL all breaking down in recent weeks. He also tracks Bitcoin's retest of all-time highs and why high...
READ MORE
MEMBERS ONLY
Could This Stock Be the NEXT NVDA?
by David Keller,
President and Chief Strategist, Sierra Alpha Research
In this edition of StockCharts TV'sThe Final Bar, Dave wraps up his Dubai journey with a special Viewer's Questions Mailbag edition! Dave explores whether LABU is on the path to mimic NVIDIA and if it's still the right time to jump in. He also...
READ MORE
MEMBERS ONLY
AMD Spikes Higher as AI Trade Still Kicking
by David Keller,
President and Chief Strategist, Sierra Alpha Research
In this edition of StockCharts TV'sThe Final Bar, Dave recaps today's market activity from the CMT 2024 Summit in Dubai, highlighting AMD's upside breakout, breadth improvement for US stocks, and why big round numbers matter for stocks like SMCI.
This video originally premiered on...
READ MORE
MEMBERS ONLY
Magnificent 7 Not All Magnificent!
by David Keller,
President and Chief Strategist, Sierra Alpha Research
In this edition of StockCharts TV'sThe Final Bar, Dave speaks to the diversifying patterns within the Magnificent 7, with GOOGL and AAPL showing clear signs of short-term distribution. He also tracks Bitcoin reaching the 64K level and shares some initial thoughts from the CMT Dubai Summit.
This video...
READ MORE
MEMBERS ONLY
New Dow Theory CONFIRMS BULL Phase!
by David Keller,
President and Chief Strategist, Sierra Alpha Research
In this edition of StockCharts TV'sThe Final Bar, Dave continues his market recaps from Dubai, focusing on the impressive rally in small caps, continued strength in Bitcoin, and upside potential for crude oil and oil services stocks. He highlights one technology name in a persistent downtrend, but potentially...
READ MORE
MEMBERS ONLY
BITCOIN Rally Picks Up Steam, What's Next?
by David Keller,
President and Chief Strategist, Sierra Alpha Research
In this edition of StockCharts TV'sThe Final Bar, Dave shares his first market update from Dubai with a recap of Bitcoin's electrifying rally, Tesla's bounce higher, and Alphabet's pullback. The S&P 500 remains above 5K with plenty of new 52-week...
READ MORE
MEMBERS ONLY
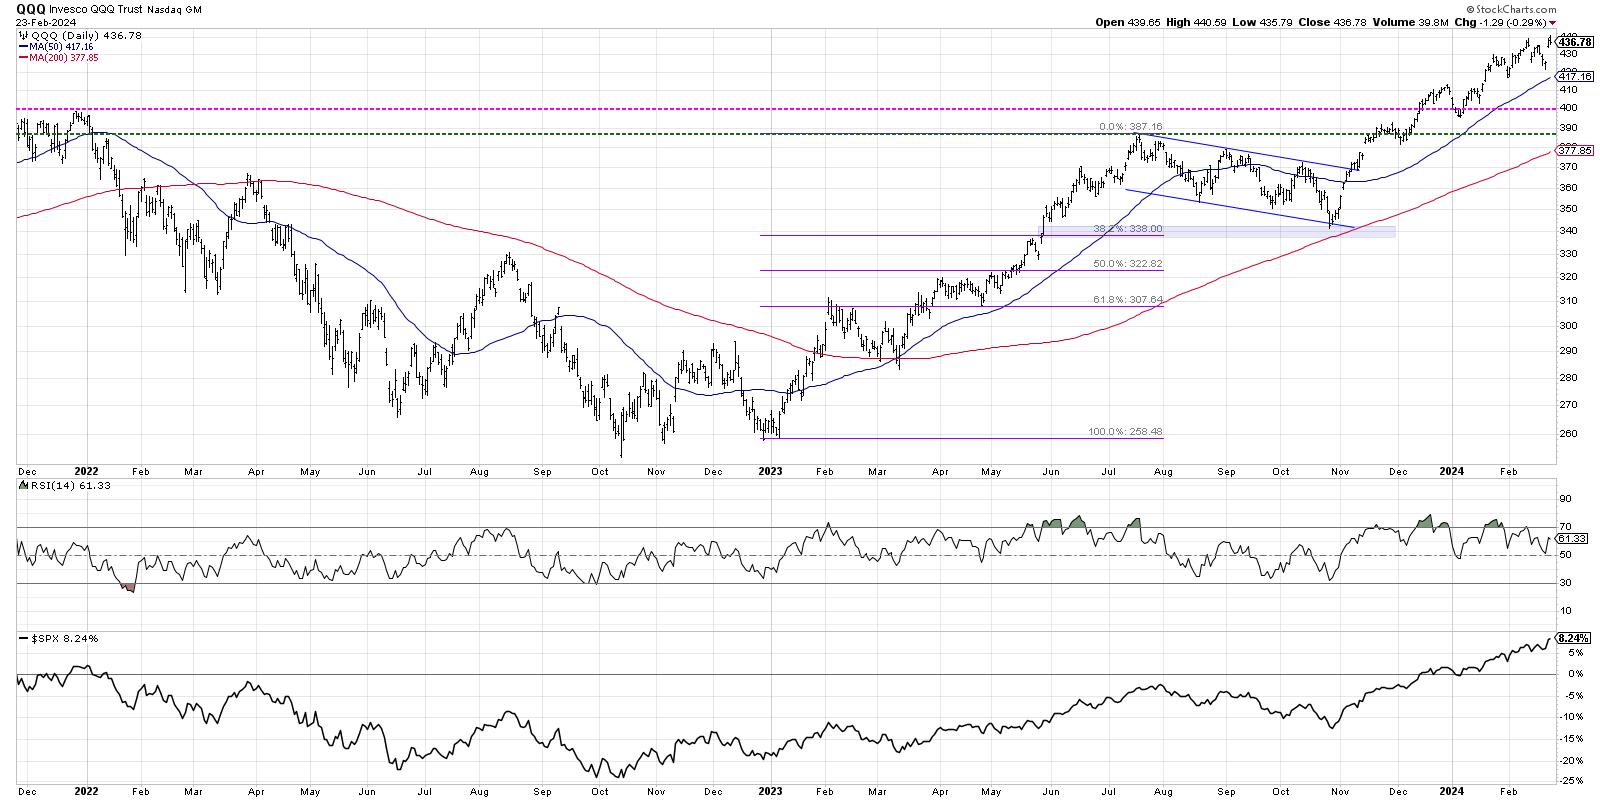
How Overextended Are You, QQQ?
by David Keller,
President and Chief Strategist, Sierra Alpha Research
We've highlighted all the warning signs as this bull market phase has seemed to near an exhaustion point. We shared bearish market tells, including the dreaded Hindenburg Omen,and how leading growth stocks have beendemonstrating questionable patterns. But despite all of those signs of market exhaustion, our growth-led...
READ MORE
MEMBERS ONLY
The Best Technical Indicator for Long-Term Investors
by David Keller,
President and Chief Strategist, Sierra Alpha Research
In this edition of StockCharts TV'sThe Final Bar, Dave drops an all-mailbag episode featuring viewer questions on the Hindenburg Omen, ascending triangle patterns, Fibonacci Retracements, projecting upside targets for stocks like NVDA, and the best technical indicator long-term investors should use!
This video originally premiered on February 23,...
READ MORE
MEMBERS ONLY
NVDA SCREAMS BULL With Earnings Breakout
by David Keller,
President and Chief Strategist, Sierra Alpha Research
In this edition of StockCharts TV'sThe Final Bar, Dave identifies key resistance levels for QQQ and HYG, along with a technical analysis downtrend checklist for charts in confirmed bear phases. Guest Larry Tentarelli of Blue Chip Daily Trend Report shares two stocks he's tracking along with...
READ MORE
MEMBERS ONLY
Markets Bracing for NVDA Earnings
by David Keller,
President and Chief Strategist, Sierra Alpha Research
In this edition of StockCharts TV'sThe Final Bar, Dave breaks down the latest market breadth indicators, ranging from bullish (S&P 500 advance-decline line) to bearish (Bullish Percent Indexes breaking down) to everything in between. He also analyzes key growth names including SMCI, PANW, AMZN, and NVDA....
READ MORE
MEMBERS ONLY
The Titanic Syndrome Indicator Issues a WARNING!
by David Keller,
President and Chief Strategist, Sierra Alpha Research
In this edition of StockCharts TV'sThe Final Bar, Dave focuses on AAPL which closed below its 200-day moving average as it tests key price support. Guest Jesse Felder of The Felder Report reports on the Titanic Syndrome, a market breadth indicator similar to the Hindenburg Omen that suggests...
READ MORE
MEMBERS ONLY
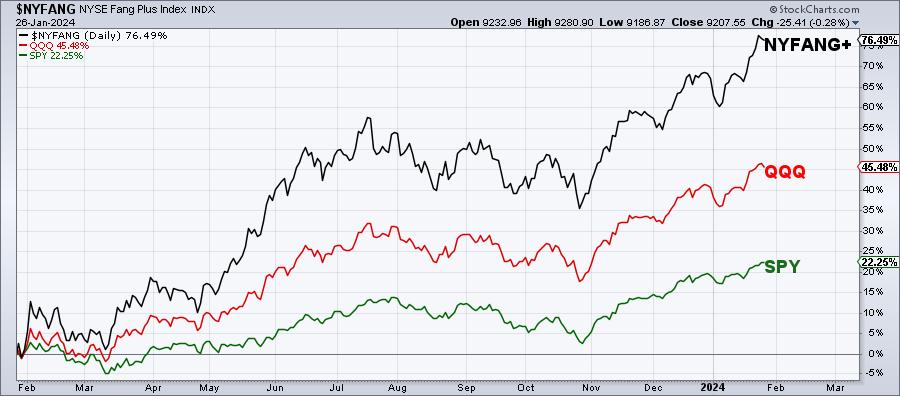
Three Leading Growth Stocks Testing Gap Support
by David Keller,
President and Chief Strategist, Sierra Alpha Research
KEY TAKEAWAYS
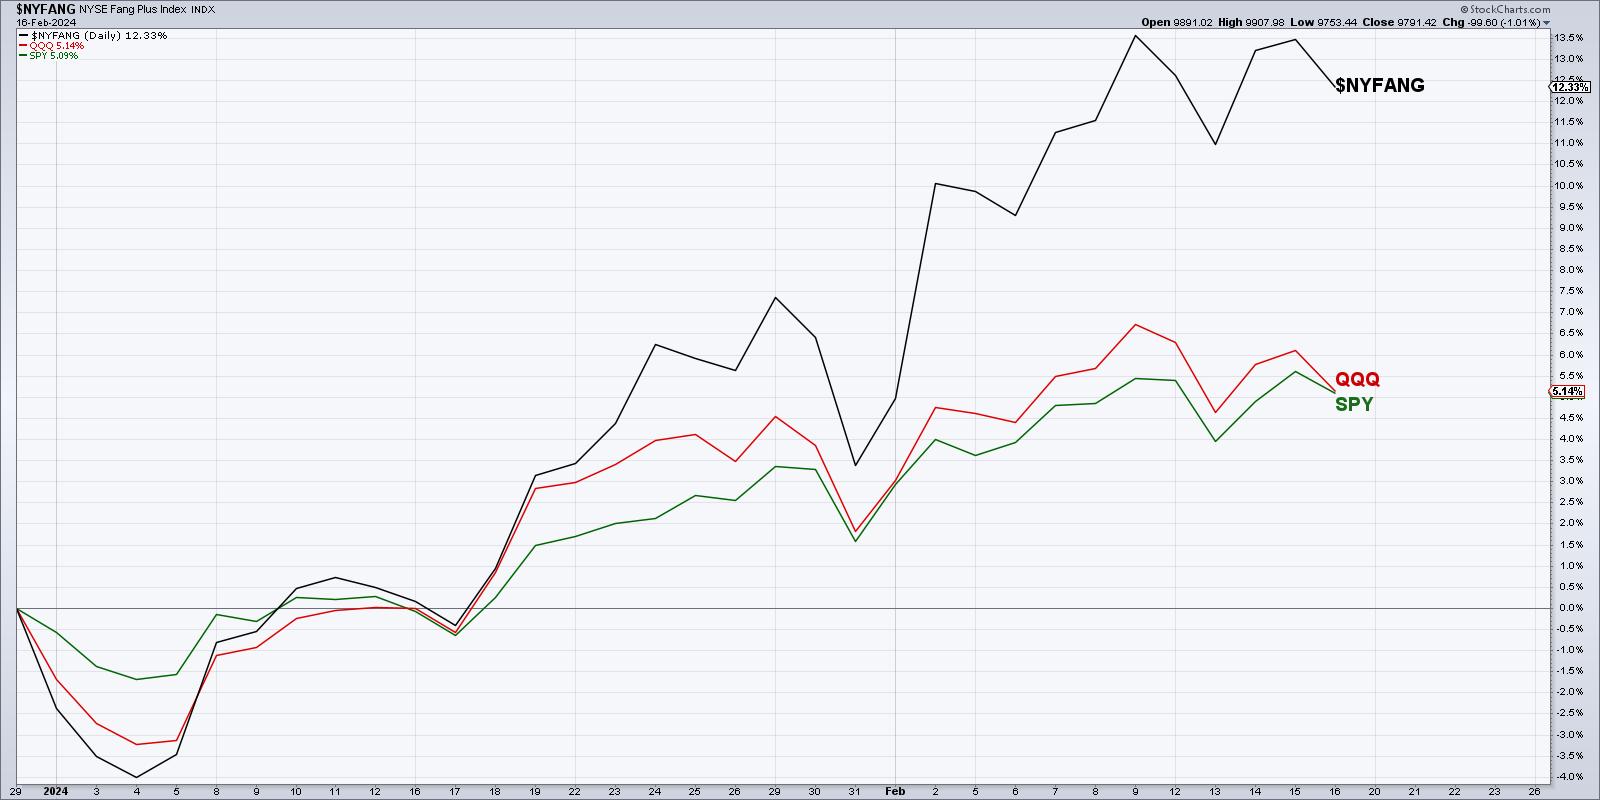
* The NYFANG+ index of leading growth stocks is up about 12% year-to-date, while the S&P 500 and Nasdaq 100 have gained only 5%.
* All three of these growth stocks show similar patterns, with a recent gap higher. But they have now all stalled out.
* If these...
READ MORE
MEMBERS ONLY
What to Do With NVDA (And Others Like It)
by David Keller,
President and Chief Strategist, Sierra Alpha Research
In this edition of StockCharts TV'sThe Final Bar, Dave answers viewer questions on the Money Flow Index, using RSP vs. SPY for relative strength analysis, strategies for names in extended uptrends like NVDA, applying Fibonacci retracements to charts like KRE, and more.
This video originally premiered on February...
READ MORE
MEMBERS ONLY
SMCI Breaks $1,000 Level - What's Next?
by David Keller,
President and Chief Strategist, Sierra Alpha Research
In this edition of StockCharts TV'sThe Final Bar, Bob Lang of Explosive Options shares three charts he's following as the S&P 500 continues to hold the crucial 5,000 level. Host David Keller, CMT highlights key stocks on the earnings list, including DKNG, COIN,...
READ MORE
MEMBERS ONLY
Market Pullback? Follow These Charts!
by David Keller,
President and Chief Strategist, Sierra Alpha Research
In this edition of StockCharts TV'sThe Final Bar, Dave tracks the S&P 500 back above 5K, Bitcoin back above 50K, and why NFLX, META, & AMZN may be the most important names to follow in the coming weeks. Guest Mish Schneider of MarketGauge breaks down the...
READ MORE
MEMBERS ONLY
S&P 500 Plunges Below 5K!
by David Keller,
President and Chief Strategist, Sierra Alpha Research
In this edition of StockCharts TV'sThe Final Bar, Dave shows how the S&P 500 is just barely holding trendline support as his short-term Market Trend Model threatens to turn bearish this week. Guest Sean McLaughlin of All Star Charts talks through how he's playing...
READ MORE
MEMBERS ONLY
Catch BIGGER GAINS by Fishing for Alpha
by David Keller,
President and Chief Strategist, Sierra Alpha Research
In this edition of StockCharts TV'sThe Final Bar, Dave highlights breakouts in home builders and Bitcoin and reviews key names reporting earnings including ABNB, SHOP, and MAR. He also shares an equity scan he uses every week to identify the next potential breakout candidates. Stay tuned until the...
READ MORE
MEMBERS ONLY
Beware the Hindenburg Omen!
by David Keller,
President and Chief Strategist, Sierra Alpha Research
KEY TAKEAWAYS
* Jim Miekka created the Hindenburg Omen after studying the conditions present at previous market peaks.
* The Hindenburg Omen triggered an initial signal this week, just as the S&P 500 finally closed above 5000 for the first time.
* If we see a second signal in the next...
READ MORE
MEMBERS ONLY
Your Questions, Answered! Price Gaps, Bull Flags, Inverse Patterns, and MORE
by David Keller,
President and Chief Strategist, Sierra Alpha Research
In this edition of StockCharts TV'sThe Final Bar, Dave digs into The Final Bar Mailbag and answers questions on price patterns like bull flags, what price gaps actually represent on the chart, and why analyzing earnings trends could help you anticipate subsequent moves for stocks like META.
This...
READ MORE
MEMBERS ONLY
3 Expert Earnings Plays: Maximizing Reward, Minimizing Risk
by David Keller,
President and Chief Strategist, Sierra Alpha Research
In this edition of StockCharts TV'sThe Final Bar, Dave welcomes Danielle Shay of Simpler Trading. Danielle highlights three earnings plays she's focused on this week, and shares how she combines multiple time frames in her trading to better define risk vs. reward. Dave laments the weakening...
READ MORE
MEMBERS ONLY
Why the NAAIM Exposure Index Matters to Your Investments
by David Keller,
President and Chief Strategist, Sierra Alpha Research
In this edition of StockCharts TV'sThe Final Bar, Dave welcomes Ryan Redfern, ChFC, CMT of Shadowridge Asset Management and President of NAAIM. Ryan provides a primer on the NAAIM Exposure Index, including what it is, how it's calculated, and how it can be used to measure...
READ MORE
MEMBERS ONLY
Three Things I WISH I'd Known About Trading
by David Keller,
President and Chief Strategist, Sierra Alpha Research
In this edition of StockCharts TV'sThe Final Bar, Dave speaks to weakening short-term breadth conditions as the McClellan Oscillator rotates to a bearish level this week. Guest Dave Landry of DaveLandry.com drops some serious trader wisdom and also shares what he does first thing every morning to...
READ MORE
MEMBERS ONLY
Market Breadth Divergence Says NO BULL!
by David Keller,
President and Chief Strategist, Sierra Alpha Research
In this edition of StockCharts TV'sThe Final Bar, Dave demonstrates how the market's recent upswing has left mid-caps and small-caps in the dust, with deteriorating breadth conditions suggesting an increased risk of downside for the S&P 500. He also unveils the latest enhancements to...
READ MORE
MEMBERS ONLY
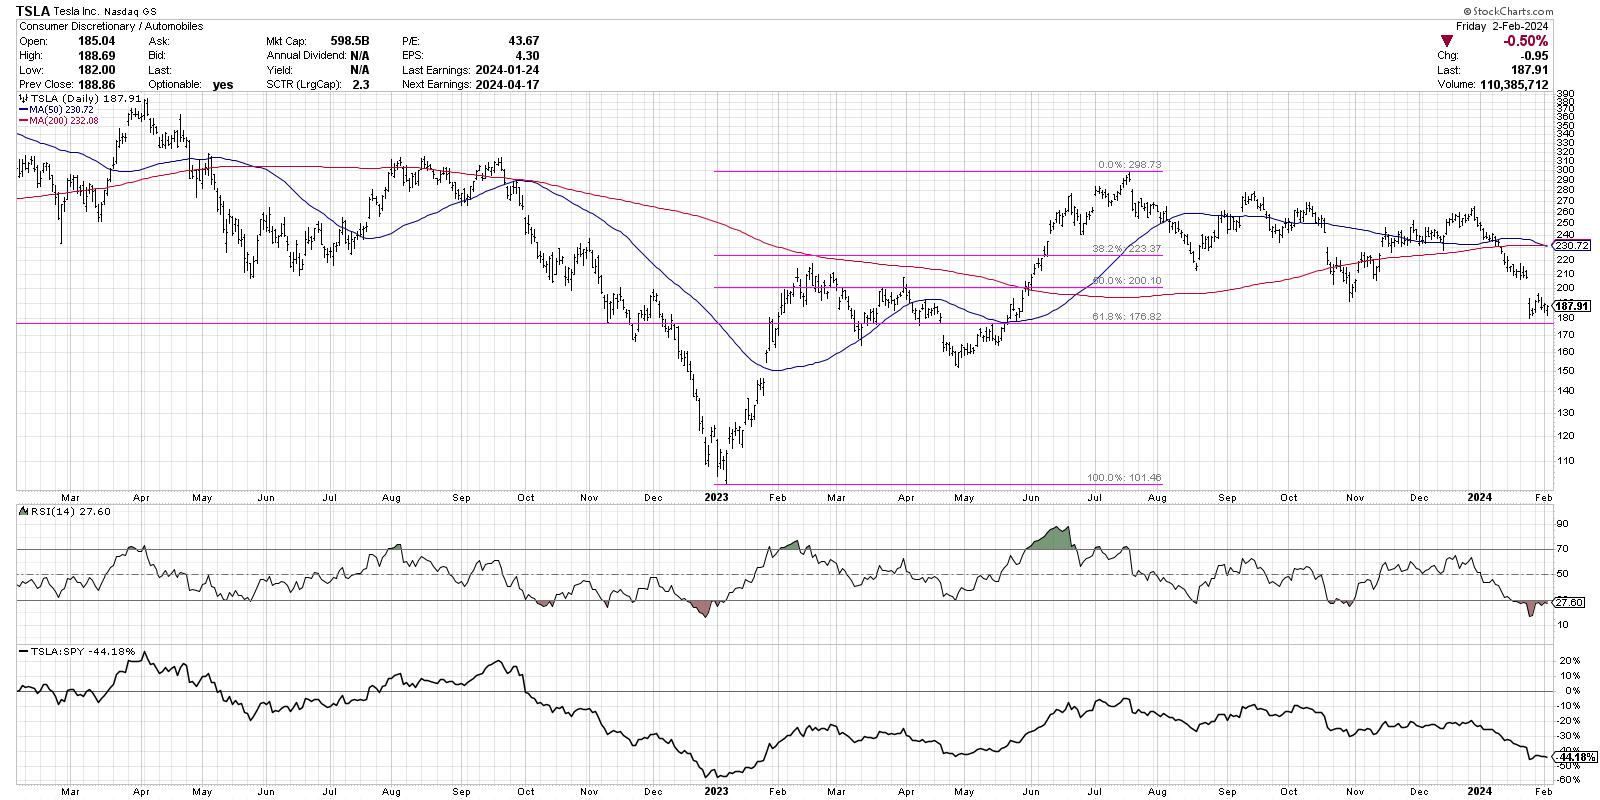
Tesla Tests Key Support: Is This a Trade? Or an Investment?
by David Keller,
President and Chief Strategist, Sierra Alpha Research
KEY TAKEAWAYS
* Tesla is an outlier from the other Magnificent 7 stocks, remaining in a downtrend channel for the last six months.
* RSI oversold conditions, along with Fibonacci retracements, suggests a return to the upper end of the trend channel.
* TSLA shows a "confluence of resistance" above current...
READ MORE
MEMBERS ONLY
Top Ten Charts to Watch for February 2024
by David Keller,
President and Chief Strategist, Sierra Alpha Research
In this edition of StockCharts TV'sThe Final Bar, Grayson and Dave run through charts they feel present actionable opportunities based on their technical analysis setups. They'll cover breakout strategies, moving average techniques, relative strength, and much more. And you'll have ten new charts to...
READ MORE
MEMBERS ONLY
Bullish Buyers Return After Market Selloff
by David Keller,
President and Chief Strategist, Sierra Alpha Research
In this edition of StockCharts TV'sThe Final Bar, Jay Woods, CMT of Freedom Capital Markets brings the energy of the NYSE floor to the show, relating today's market rebound to longer term themes for small caps and regional banks. Dave shares one breadth indicator recognizing broad...
READ MORE
MEMBERS ONLY
Betting Against the Fed is RISKY!
by David Keller,
President and Chief Strategist, Sierra Alpha Research
In this edition of StockCharts TV'sThe Final Bar, Tony Dwyer of Canaccord Genuity shares insights on today's Fed meeting and what data he's following to anticipate rate cuts through 2024. Dave tracks mega cap growth stocks, including MSFT and GOOGL, which are in pullback...
READ MORE
MEMBERS ONLY
Market Wisdom from the Godfather of Technical Analysis
by David Keller,
President and Chief Strategist, Sierra Alpha Research
In this edition of StockCharts TV'sThe Final Bar, legendary technical analyst Ralph Acampora, CMT visit StockCharts HQ to share lessons learned in the 1970s secular bear market, what he learned about simplicity from the late Alan Shaw, and how leadership rotation may be the theme for the coming...
READ MORE
MEMBERS ONLY
Will Catalysts Push Markets HIGHER or Drag Them LOWER?
by David Keller,
President and Chief Strategist, Sierra Alpha Research
In this edition of StockCharts TV'sThe Final Bar, Dave tracks the S&P 500 as it pushes to a new high above 4900, while the McClellan Oscillator rotates to a bullish reading. He breaks down earnings plays this week, including XOM, MSFT, and more.
This video originally...
READ MORE
MEMBERS ONLY
Magnificent 7 Stocks: Overheated or Just Getting Started?
by David Keller,
President and Chief Strategist, Sierra Alpha Research
One of the key themes, if not THE theme, of 2023 was the dominance of the mega-cap growth trade. The Magnificent 7 stocks handily outperformed our equity benchmarks through the course of 2023, and, so far in 2024, it's been more of the same.
With Netflix (NFLX) gapping...
READ MORE
MEMBERS ONLY
How to Avoid Huge Drawdowns from High-Flying Stocks
by David Keller,
President and Chief Strategist, Sierra Alpha Research
In this edition of StockCharts TV'sThe Final Bar, Dave hosts an all-mailbag episode, answering viewer questions on the Relative Strength Index (RSI), how ETFs like QTEC have outperformed benchmarks including the Nasdaq 100, and how to avoid painful losses in leading names like NVDA, PANW, and ADBE.
This...
READ MORE
MEMBERS ONLY
Unlocking the Power of Technical Indicators
by David Keller,
President and Chief Strategist, Sierra Alpha Research
In this edition of StockCharts TV'sThe Final Bar, Dave breaks down the chart of Intel Corp (INTC) to demonstrate the benefits of three important technical indicators: Moving Averages, Relative Strength Index (RSI) and Relative Strength. He shares why a disciplined process of interpreting these indicators can help investors...
READ MORE
MEMBERS ONLY
Macro Model Gives Mixed Signals as NFLX LIGHTS UP!
by David Keller,
President and Chief Strategist, Sierra Alpha Research
In this edition of StockCharts TV'sThe Final Bar, guest John Kosar, CMT of Asbury Research shares his proprietary Asbury Six macro model, which suggests caution based on weak fund flows and breadth conditions. Dave focuses in on crude oil and gold charts, and also reviews key earnings plays...
READ MORE
MEMBERS ONLY
S&P 500 Still SUPER Undervalued!
by David Keller,
President and Chief Strategist, Sierra Alpha Research
In this edition of StockCharts TV'sThe Final Bar, guest Ari Wald, CFA CMT of Oppenheimer lays out a bull case for the S&P 500 based on valuations and forward returns given strong breadth conditions. Dave reviews stocks reporting earnings this week, including LOGI, LMT, PG, DHI,...
READ MORE
MEMBERS ONLY
Small Caps Surge Higher As S&P 500 Stalls
by David Keller,
President and Chief Strategist, Sierra Alpha Research
In this edition of StockCharts TV'sThe Final Bar, Dave observes the S&P 500 index pressing higher after achieving new all-time highs on Friday. While large caps have dominated small caps so far in January, days like today suggest small-cap strength as a potential emerging trend. He...
READ MORE