MEMBERS ONLY
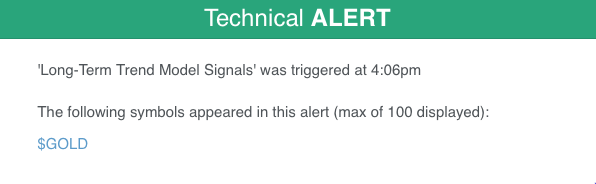
New Long-Term Trend Model BUY Signal for Gold
by Erin Swenlin,
Vice President, DecisionPoint.com
A new Long-Term Trend Model signal triggered on Gold today. This occurs when the 50-EMA crosses above the 200-EMA. When this happens, DecisionPoint theory is that any stock, ETF, index, etc. with a 50-EMA above the 200-EMA is in a technical bull market. What does this mean? If you are...
READ MORE
MEMBERS ONLY
DP Alert: Volume Indicators Mixed - SPY Finds Support...For Now - ITTM Neutral Signal on RYF
by Erin Swenlin,
Vice President, DecisionPoint.com
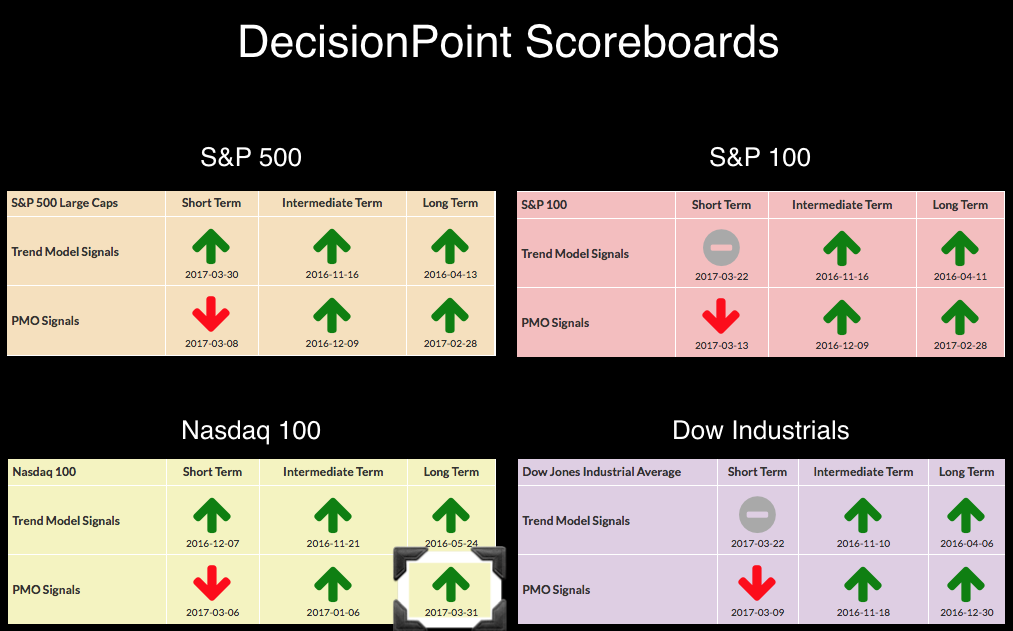
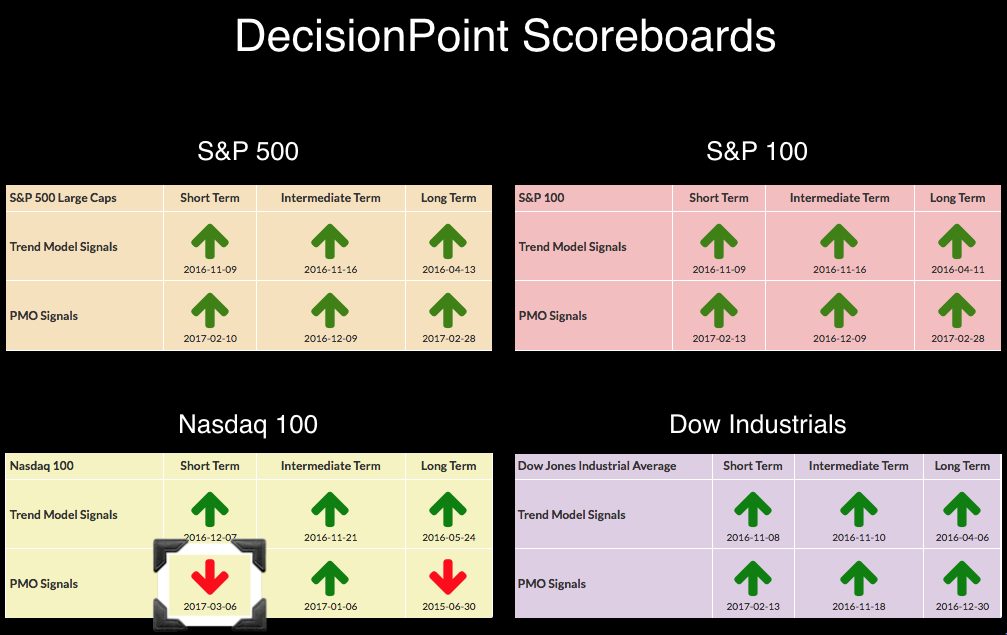
No changes on the DecisionPoint Scoreboards. You'll find these boards in the DP Chart Gallery. However, we did get a new Intermediate-Term Trend Model (ITTM) Neutral signal on the equal-weight Financials ETF (RYF).
The purpose of the DecisionPoint Alert Daily Update is to quickly review the day'...
READ MORE
MEMBERS ONLY
Uranium Looking Good - Excerpt from MarketWatchers LIVE
by Erin Swenlin,
Vice President, DecisionPoint.com
I'm really enjoying myself co-hosting the MarketWatchers LIVE webcasts Monday/Wednesday/Fridays at 12:00p - 1:30p EST. On Mondays and Wednesdays in this blog, I'll pick up an interesting topic or chart to elaborate on. I have to thank one of our Twitter followers...
READ MORE
MEMBERS ONLY
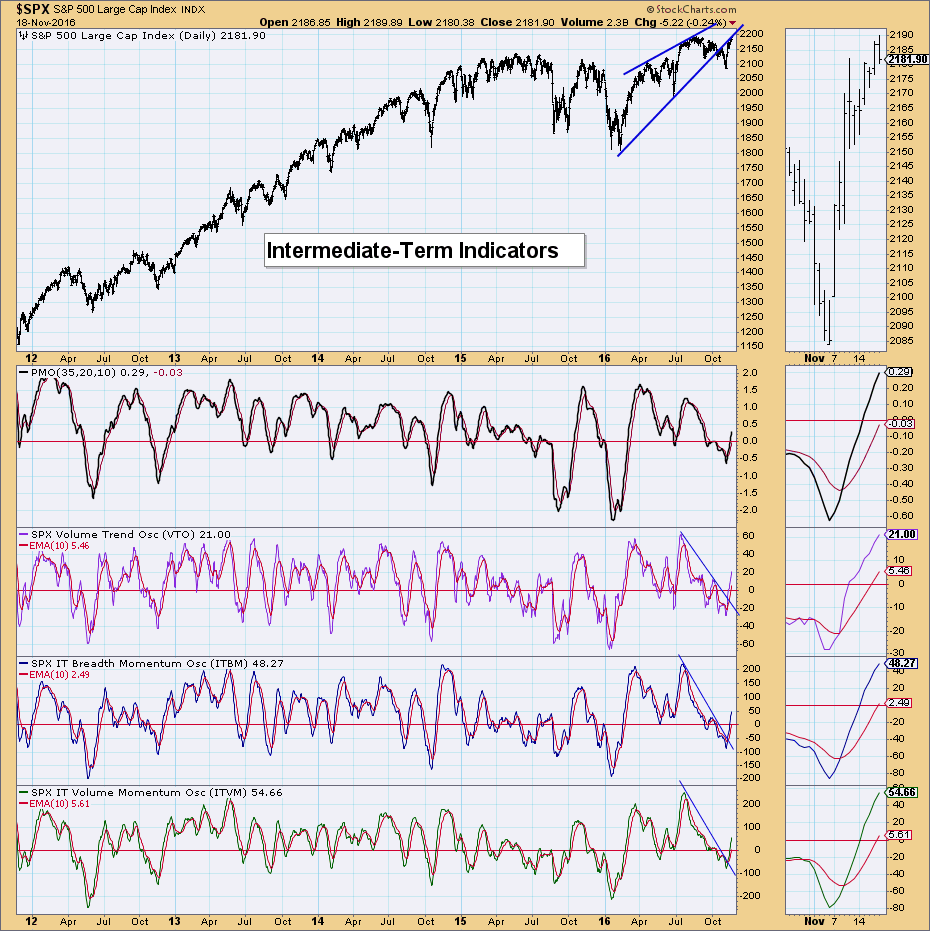
Declining Trend Persists - IT Indicators Bottoming
by Erin Swenlin,
Vice President, DecisionPoint.com
No new changes on the DP Scoreboards. I was expecting to see the Dow trigger a Short-Term Trend Model BUY signal, but with yesterday's failed breakout and price stagnating over the past week or two, you can see that the 5-EMA is maintaining below the 20-EMA with little...
READ MORE
MEMBERS ONLY
DP Alert: New BUY Signal for S&P 100 - S&P 600 (IJR) New ITTM Neutral Signal
by Erin Swenlin,
Vice President, DecisionPoint.com
The DecisionPoint Scoreboards updated with a new signal change today. The $OEX just managed a new Short-Term Trend Model BUY signal. The 5-EMA crossed above the 20-EMA triggering the signal. Right now price is running along the declining tops trendline. The PMO is no longer rising and that is a...
READ MORE
MEMBERS ONLY
MarketWatchers LIVE Kick-Off - Recap of Market Indicators
by Erin Swenlin,
Vice President, DecisionPoint.com
MarketWatchers LIVE kicked off today at noon EST! Tom Bowley and I host this new webcast Monday, Wednesday and Friday from 12:00p - 1:30p EST. Very soon we will have a public ChartList available for the show as well as a MarketWatchers LIVE blog that will recap some...
READ MORE
MEMBERS ONLY
Monthly PMO BUY Signal for Nasdaq 100
by Erin Swenlin,
Vice President, DecisionPoint.com
Patience was rewarded today as the Long-Term Price Momentum Oscillator (PMO) confirmed a BUY signal that had been pending most of the month. We don't log new monthly PMO signals until the chart goes "final" on the last trading day of the month. Similarly, we don&...
READ MORE
MEMBERS ONLY
Short-Term Trend Model/PMO Scan from 3/29 DecisionPoint Report Webinar - James River Group (JRVR) Analyzed
by Erin Swenlin,
Vice President, DecisionPoint.com
Yesterday during the DecisionPoint Report webinar I decided to run a short-term scan and run through the results with my viewers. You can find the webinar here. I promised to write a blog article with the text of the scan so that Extra members can copy and paste directly into...
READ MORE
MEMBERS ONLY
Net Advances-Declines Indicators Rock the Ultra-Short Term
by Erin Swenlin,
Vice President, DecisionPoint.com
The DecisionPoint universe is evolving. As many of you are aware, some of our indicators will be retired. Two of the indicators many are concerned about losing are the Climactic Volume Indicator and Participation Index. Writing a blog everyday and doing regular webinars during the week tends to keep my...
READ MORE
MEMBERS ONLY
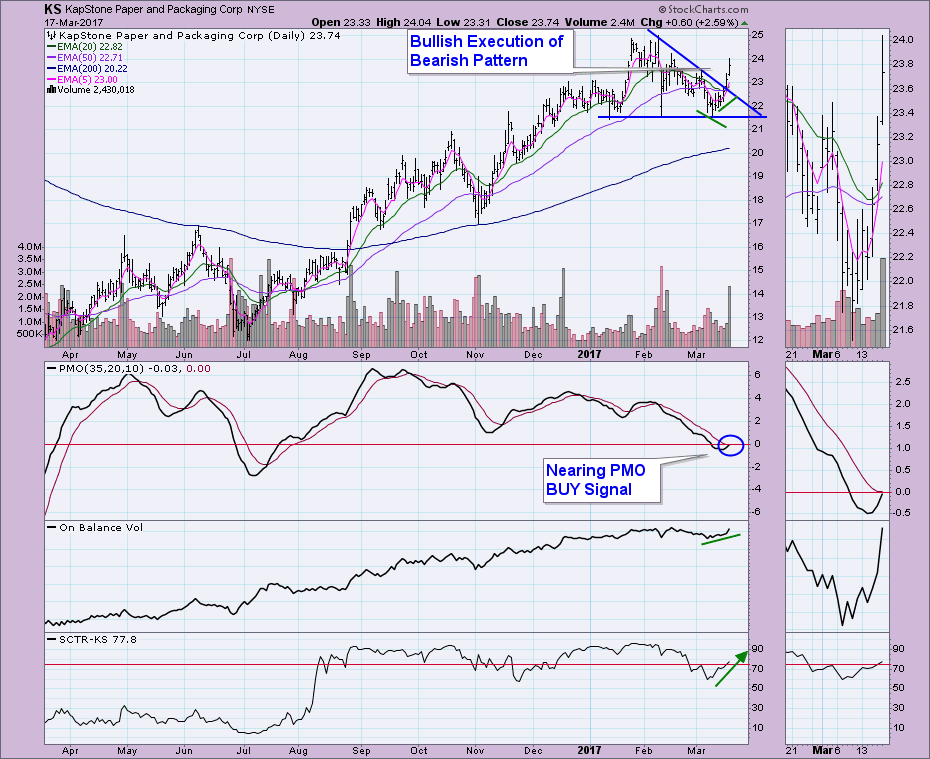
PMO Scan from 3-17-2017 DP Webinar - Spotlight on KapStone Paper (KS)
by Erin Swenlin,
Vice President, DecisionPoint.com
I am asked constantly about how to use the Price Momentum Oscillator (PMO) and Trend Models in a scan. These two ingredients combine into a great tandem for the scan engine. I'll give you a reprint of the scan and analyze a chart I found in it today....
READ MORE
MEMBERS ONLY
Investors Feeling Bearish = Good for the Market
by Erin Swenlin,
Vice President, DecisionPoint.com
I thought this "yin yang" symbol was actually a nice metaphor for sentiment. When we look at the sentiment numbers on a chart they are expressed as a percentage. For example, 31% are bullish, 39% are bearish, and the rest fall into the neutral category. It's...
READ MORE
MEMBERS ONLY
Chart Spotlight on Pfizer, Inc. (PFE)
by Erin Swenlin,
Vice President, DecisionPoint.com
Chart Spotlights will be a regular addition to the DecisionPoint blog and have already been incorporated into the DecisionPoint Report webinars. The purpose of the Chart Spotlight is not to recommend a particular stock, it is a learning exercise. Many readers and viewers want to understand how to pull up...
READ MORE
MEMBERS ONLY
New NDX PMO SELL Signal Likely the First of Many
by Erin Swenlin,
Vice President, DecisionPoint.com
Many of you may have noticed yesterday's DecisionPoint Alert blog headline, "New PMO SELL Signal for the NDX". I had thought we'd make it to DP Scoreboards with all BUY signals, but the NDX refused to give up the Long-Term Price Momentum Oscillator (PMO)...
READ MORE
MEMBERS ONLY
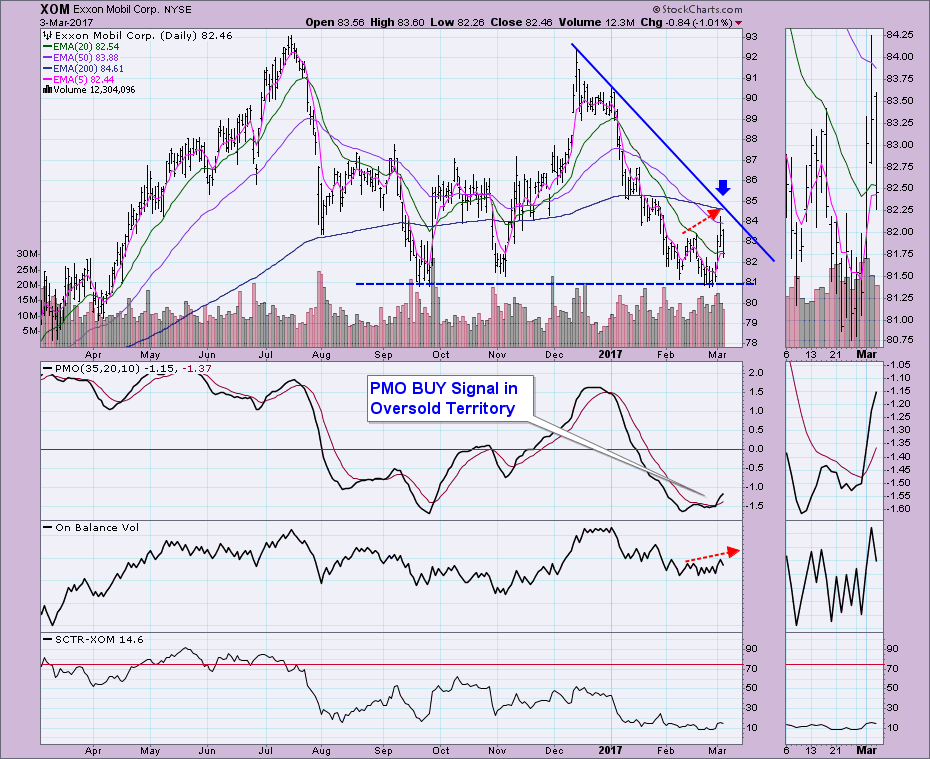
Chart Spotlight: Exxon-Mobil (XOM) Reveals Possibilities
by Erin Swenlin,
Vice President, DecisionPoint.com
During the DecisionPoint Report webinars I've added a "chart spotlight". For those of you who were members of the original DecisionPoint website, you probably remember Carl's "Chart Spotlight" on Fridays. Viewers and readers offer up some symbol suggestions via Twitter (@_DecisionPoint) and...
READ MORE
MEMBERS ONLY
Energy SPDR Showing No Improvement - XLE Reaching a Decision Point
by Erin Swenlin,
Vice President, DecisionPoint.com
Every Wednesday and Friday, I review the DecisionPoint Market/Sector Summary with my webinar viewers. It is actually only one table that is taken from the full Market/Sector Summary found in the "DP Reports" blog. This table shows us the DecisionPoint Intermediate-Term Trend Model (ITTM) "posture&...
READ MORE
MEMBERS ONLY
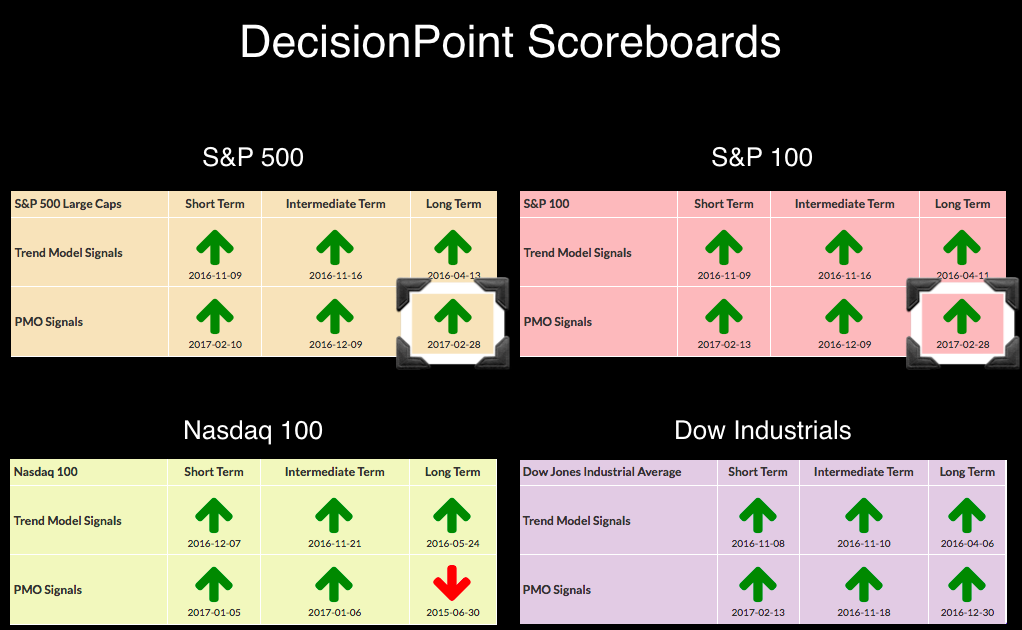
SPX and OEX - Two New Long-Term PMO BUY Signals - Monthly Chart Review of DP Scoreboards
by Erin Swenlin,
Vice President, DecisionPoint.com
The DecisionPoint Scoreboards in the DP Chart Galleries are now almost completely bullish. Two new Long-Term Price Momentum Oscillator (PMO) BUY signals appeared for the S&P 500 and S&P 100 when the monthly charts went final today. We don't tally up our Long-Term PMO...
READ MORE
MEMBERS ONLY
Chart Spotlight on Tesla (TSLA) - Decisive Breakdown
by Erin Swenlin,
Vice President, DecisionPoint.com
I noticed on the StockCharts.com homepage "symbol cloud" that readers were downloading this chart more than Amazon and the SPX (based on size of the font). I decided to take a look. Wow! TSLA dropped more than 6.4% today! There are some real problems with this...
READ MORE
MEMBERS ONLY
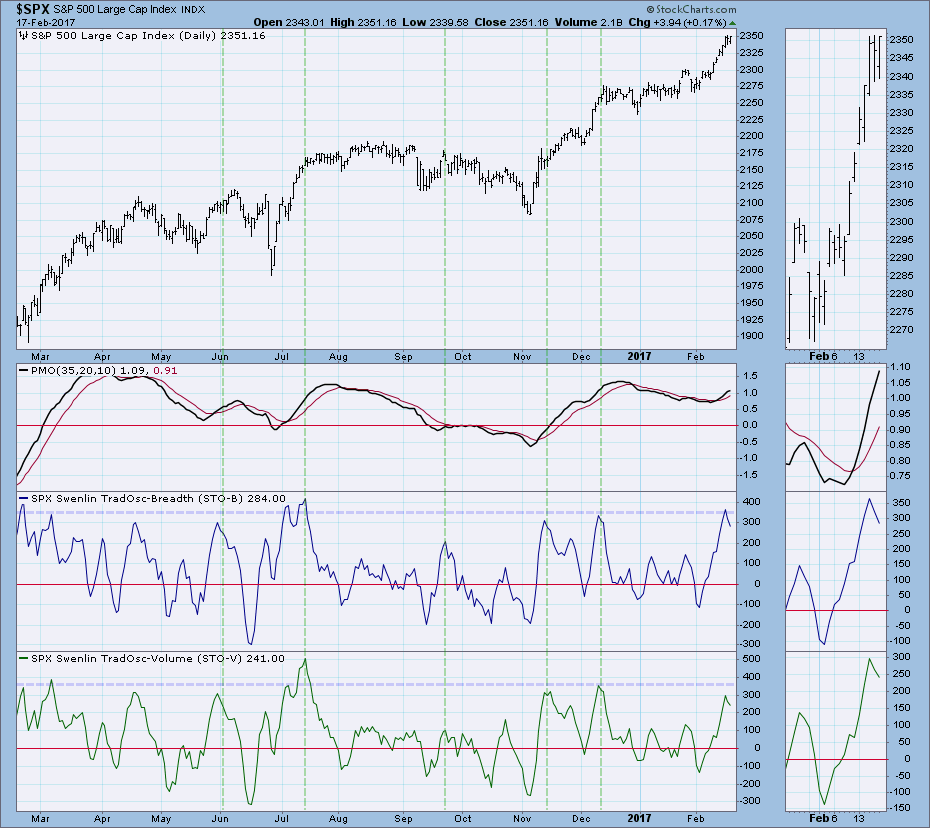
Swenlin Trading Oscillators Very Bearish
by Erin Swenlin,
Vice President, DecisionPoint.com
The market has been experiencing an almost vertical rally over the past few weeks, but it has cooled over the past two days. The steep rising trend pushed our short-term Swenlin Trading Oscillators (STOs) into highly overbought territory. With Thursday and Friday's cooling off period, they have peaked....
READ MORE
MEMBERS ONLY
New Chart Spotlight Added to DecisionPoint LIVE Webinars
by Erin Swenlin,
Vice President, DecisionPoint.com
The DecisionPoint LIVE webinars on Wednesday and Fridays at 7:00pm EST are news programs. In just 30 minutes, I go over the current DecisionPoint Scoreboards, cover daily/weekly/monthly charts of major large- and small-cap indexes, review indicators and finish with analysis of the "Big Four" --...
READ MORE
MEMBERS ONLY
Cooling Energy ETFs - New Intermediate-Term Trend Model Neutral Signals on XLE and RYE
by Erin Swenlin,
Vice President, DecisionPoint.com
Both the Energy SPDR (XLE) and its counterpart, the equally-weighted Energy ETF (RYE) triggered new Intermediate-Term Trend Model Neutral signals when the 20-EMAs crossed below the 50-EMAs while the 50-EMA was below the 200-EMA. We consider a stock, index, ETF, etc. to be in a "bull market" as...
READ MORE
MEMBERS ONLY
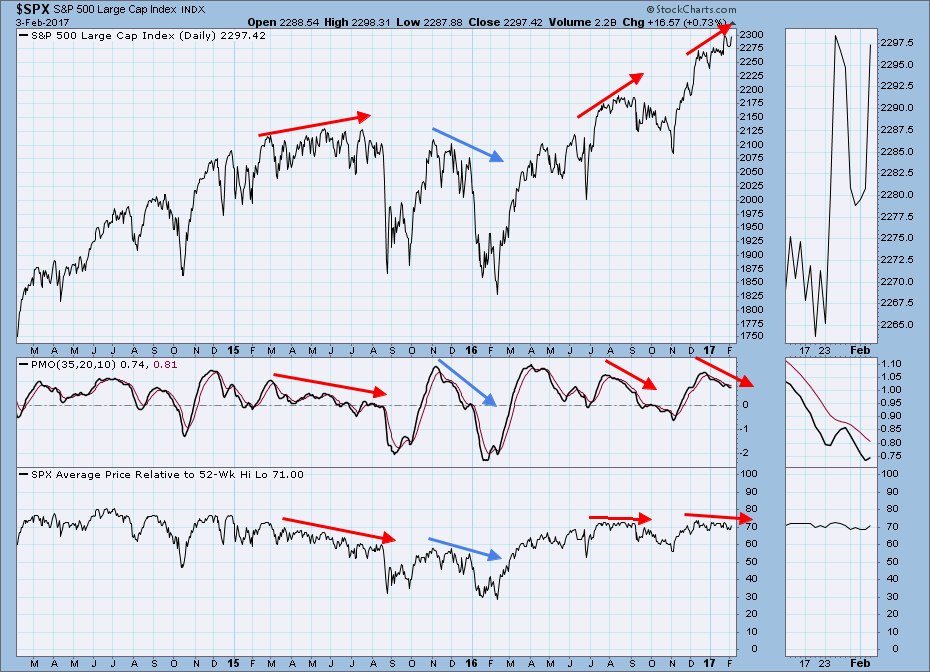
Stocks Relative to Their 52-Week High-Low - SPX v. NDX
by Erin Swenlin,
Vice President, DecisionPoint.com
Today during my DecisionPoint Report webinar, I pulled the intermediate-term indicator chart of SPX Stocks Relative to Their 52-Week Hi-Lo to show my viewers the divergences that are all over this chart. After I finished the webinar and reviewed the chart again, I decided it would be great to see...
READ MORE
MEMBERS ONLY
The January Barometer - Myth or Statistically Relevant?
by Erin Swenlin,
Vice President, DecisionPoint.com
Yale Hirsch was the first to propose, "As the Standard & Poor's goes in January, so goes the year". Simply meaning, if the S&P 500 closes higher in January, the end of the year should finish higher OR if it closes lower, it will...
READ MORE
MEMBERS ONLY
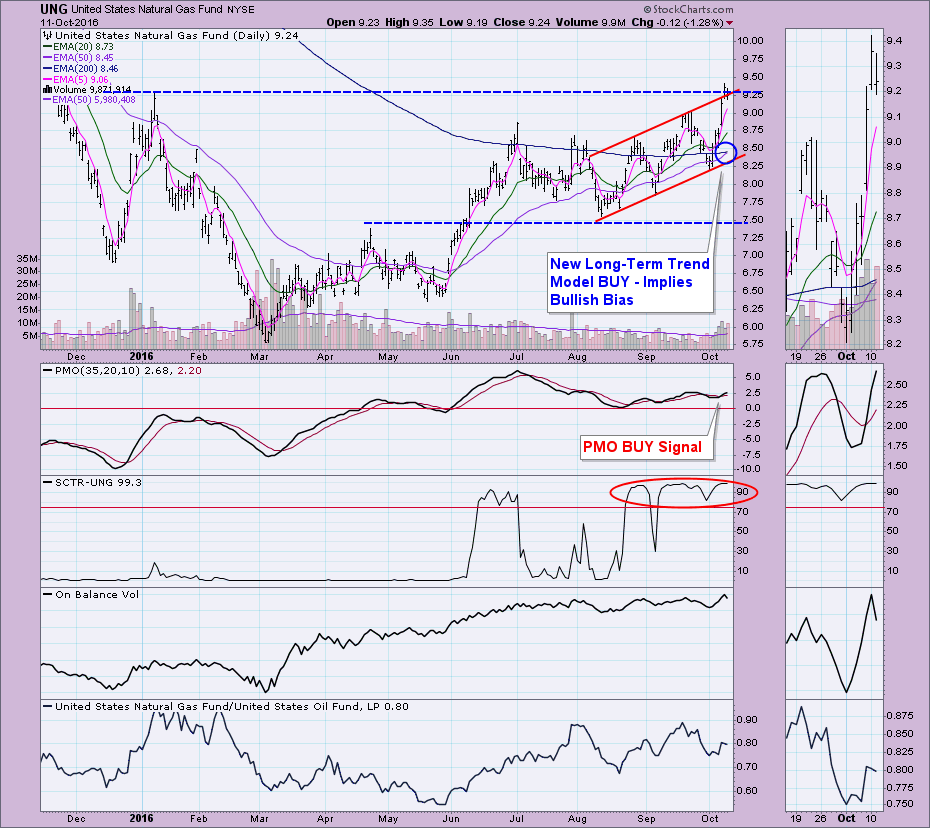
Natural Gas (UNG) Analysis Request - Heating Up?
by Erin Swenlin,
Vice President, DecisionPoint.com
I've begun taking symbol requests prior to my Wednesday and Friday webinars. Viewers are treated to a DecisionPoint viewpoint on their favorite symbols. This is an excellent opportunity to understand how to look at a chart and find what you need to in order to make an educated...
READ MORE
MEMBERS ONLY
Rainy Weather is Sunny for California Water Services Group (CWT)
by Erin Swenlin,
Vice President, DecisionPoint.com
As I can attest to, California has been hit with a deluge of rain. We have needed it for a very long time to alleviate almost non-stop drought conditions. I found it interesting when I did a Short-Term Trend Model (STTM) technical scan, California Water Services Group (CWT) had just...
READ MORE
MEMBERS ONLY
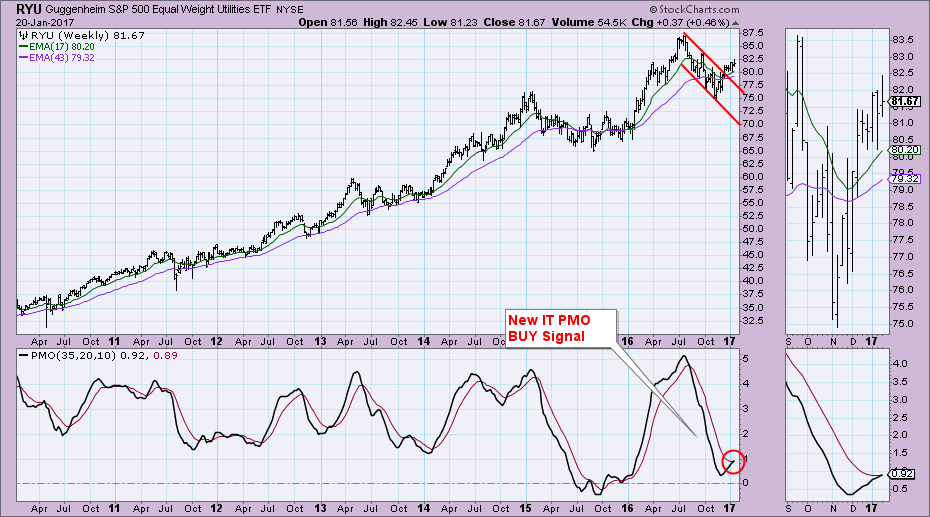
Utilities Equal-Weight ETF (RYU) Lights Up with Weekly PMO BUY Signal
by Erin Swenlin,
Vice President, DecisionPoint.com
On Friday, I received a StockCharts Technical Alert in my email inbox letting me know that the Equal-Weight Utilities ETF (RYU) had triggered a new Intermediate-Term Price Momentum Oscillator (PMO) BUY signal. I immediately had to check out the weekly chart.
There is a clear breakout from a declining trend...
READ MORE
MEMBERS ONLY
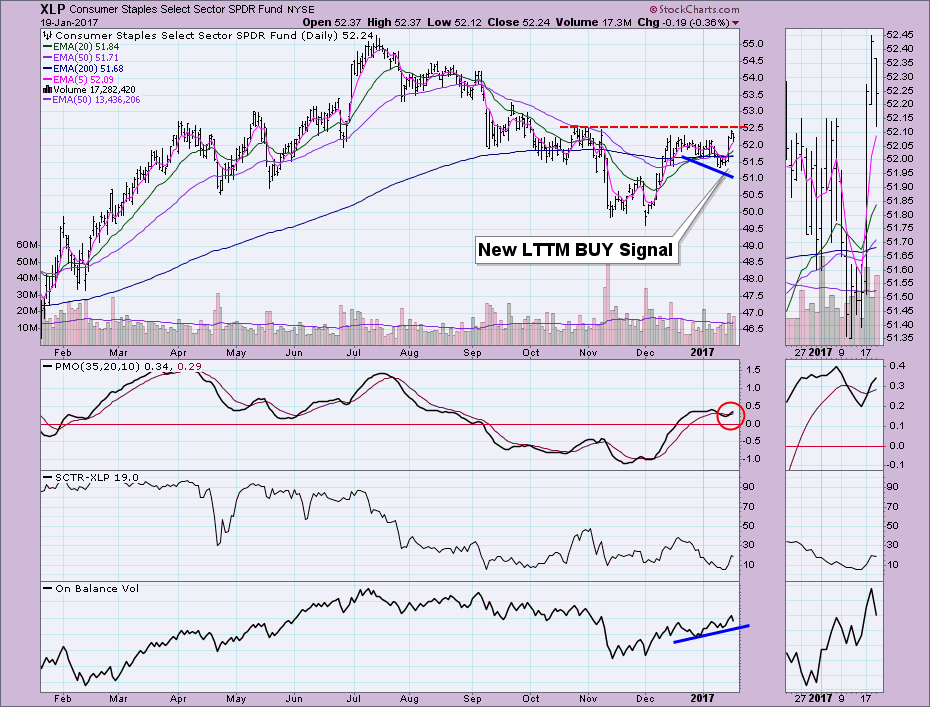
Webinar Review of Consumer Staples SPDR (XLP)
by Erin Swenlin,
Vice President, DecisionPoint.com
Yesterday during my webinar, I added a "chart spotlight" at the end of the program. It's a new feature that viewers had asked for since I generally go through a review of the major indexes (small and large), DP indicators and the "Big Four"...
READ MORE
MEMBERS ONLY
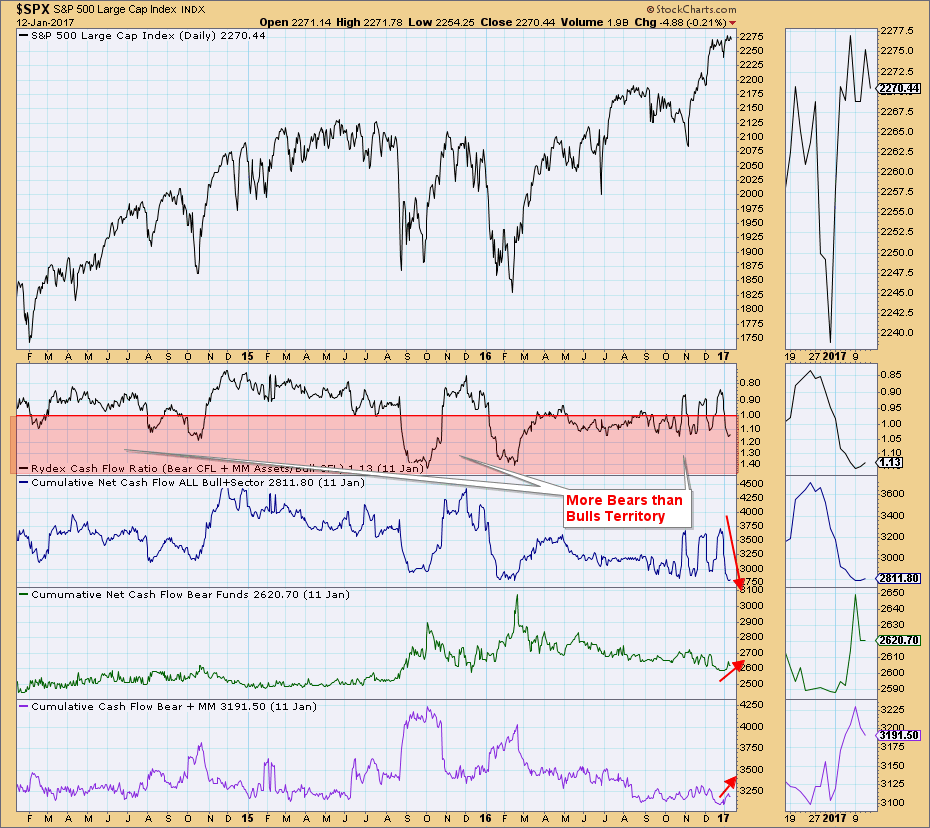
Rydex Cashflow Ratio Sentiment: Putting Money Where the Mouth Is
by Erin Swenlin,
Vice President, DecisionPoint.com
Carl Swenlin wrote back in a July 2014 an in-depth article about the Rydex Cashflow and Asset Ratios. His explanation of sentiment in relation to the Rydex Ratios is simple and well-stated so I won't rewrite it:
"Sentiment has traditionally been measured by taking polls of selected...
READ MORE
MEMBERS ONLY
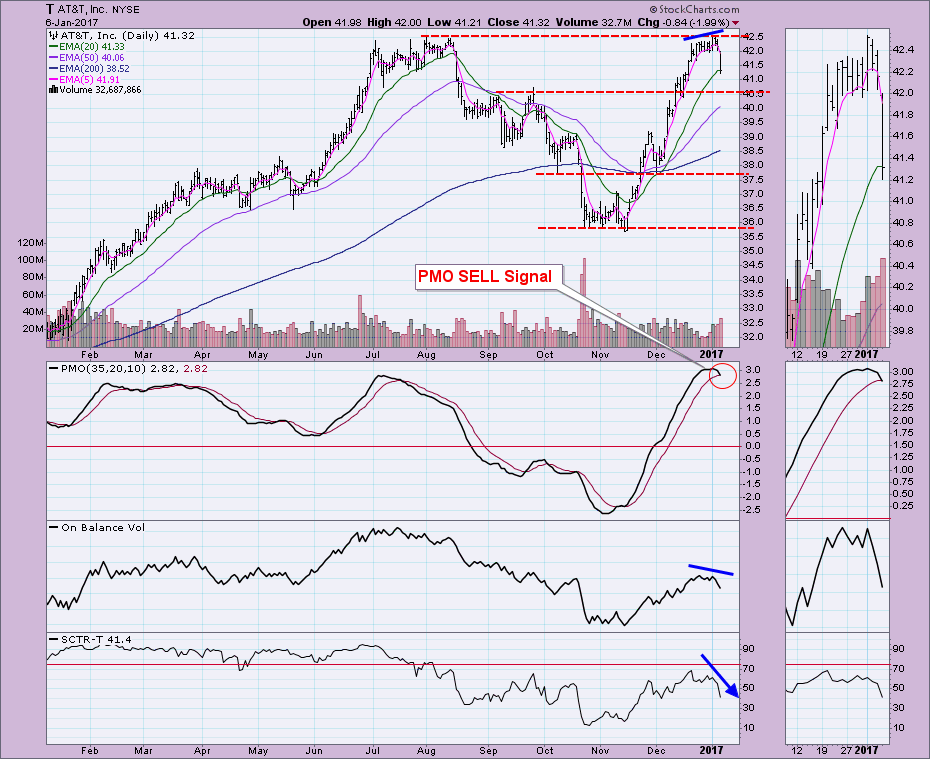
AT&T Takes a Nose Dive
by Erin Swenlin,
Vice President, DecisionPoint.com
A regular DecisionPoint webinar viewer and reader emailed me and suggested I take a look at AT&T because as he stated, "ouch". It was definitely a rough day for AT&T and what happened today has some very interesting implications.
Price dropped almost 2% today....
READ MORE
MEMBERS ONLY
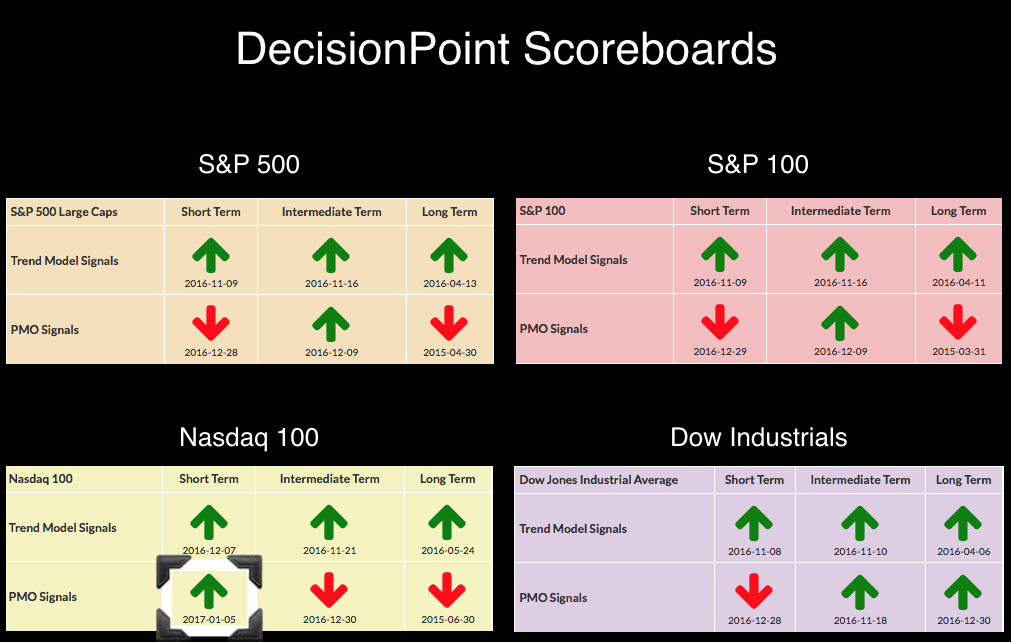
Nasdaq 100 PMO Decouples from Major Indexes
by Erin Swenlin,
Vice President, DecisionPoint.com
Today, the Nasdaq 100 rallied while the other indexes experienced declines. You'll note in the DecisionPoint Scoreboard Summary below that all of the major indexes are on short-term Price Momentum Oscillator (PMO) SELL signals that arrived in December. Meanwhile, the NDX received a new PMO BUY signal.
Here...
READ MORE
MEMBERS ONLY
Commodities ETF (GSG) Posts New Long-Term Trend Model BUY Signal
by Erin Swenlin,
Vice President, DecisionPoint.com
The iShares Commodity ETF (GSG) had a momentous BUY signal. Today, the 50-EMA crossed above the 200-EMA, reaching territory unseen since 2014. This crossover triggers a Long-Term Trend Model BUY signal that suggests GSG has entered a new bull market. A review of the charts reveals this new signal has...
READ MORE
MEMBERS ONLY
Utilities ETF (XLU) New Long-Term AND Intermediate-Term Trend Model BUY Signals
by Erin Swenlin,
Vice President, DecisionPoint.com
I have a variety of StockCharts technical alerts set up. As a result, I receive emails whenever the entities in my alert ChartList receives new Trend Model signals and Price Momentum Oscillator (PMO) crossover signals. Today I received an alert that the Utilities SPDR (XLU) triggered a new Intermediate-Term Trend...
READ MORE
MEMBERS ONLY
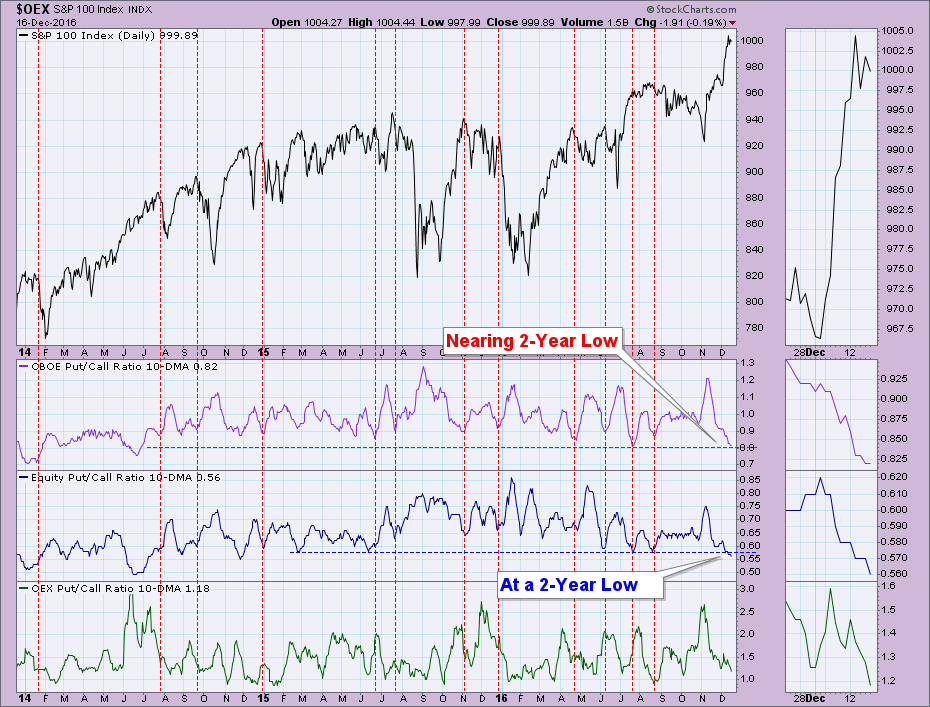
Put/Call Ratios At or Nearing Two-Year Lows - Sentiment Bullish
by Erin Swenlin,
Vice President, DecisionPoint.com
A webinar viewer recently sent me a chart showing put/call ratios nearing extreme lows. I pulled up the chart and indeed, the 10-DMA of the put/call ratios are nearing or are at two-year lows.
What does this actually mean? As the ratio gets smaller and smaller, that means...
READ MORE
MEMBERS ONLY
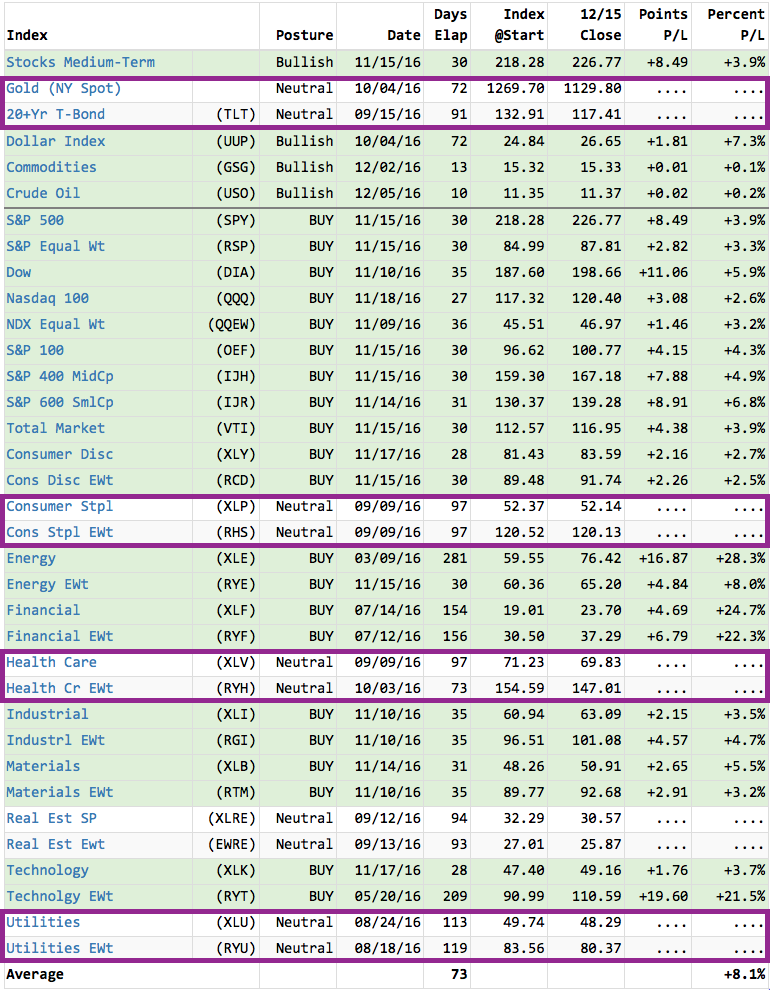
Creating a Relative Rotation Graph Using DP Market/Sector Summary Posture Table
by Erin Swenlin,
Vice President, DecisionPoint.com
I was first introduced to Relative Rotation Graphs (RRGs) at the 2014 ChartCon. I was blown away by its simplicity and visual impact. Julius de Kempenaer, a fellow blogger here at StockCharts developed RRGs. I would direct you to ChartSchool to read more about the inner workings that create these...
READ MORE
MEMBERS ONLY
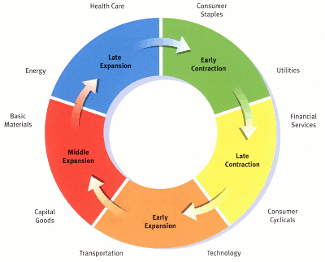
Sector Rotation Study Using the DecisionPoint Market/Sector Summary
by Erin Swenlin,
Vice President, DecisionPoint.com
If you haven't gotten John Murphy's Book, Trading with Intermarket Analysis, I highly recommend you do. He talks at length about sector rotation and how it can help you determine where the market is and could likely be headed. The graphic above shows us the economic...
READ MORE
MEMBERS ONLY
Revisit to Natural Gas (UNG) - New IT BUY Signal and Using Gaps to Set Stops
by Erin Swenlin,
Vice President, DecisionPoint.com
I recently received a tweet (follow me on Twitter @_DecisionPoint) thanking me for an updated chart of UNG on November 21st which helped him bag a 20% gain. Back in late October, I wrote an article on Natural Gas (UNG) discussing a possible bull market move to $12 if it...
READ MORE
MEMBERS ONLY
Weakened NDX Triggers Two Short-Term Bearish Signals
by Erin Swenlin,
Vice President, DecisionPoint.com
The daily chart of the Nasdaq 100 doesn't really resemble any of the other large-cap indexes or even most small-cap indexes. Technology sectors have performed terribly. The Election "euphoria" enjoyed by the Dow Industrials and most other indexes really didn't do much for tech....
READ MORE
MEMBERS ONLY
Head and Shoulders Forms on USO and WTIC
by Erin Swenlin,
Vice President, DecisionPoint.com
Readers of my DecisionPoint Alert blog have been watching the head and shoulders pattern forming on USO and Oil. There are plenty of fundamental factors that go into the pricing of Oil, but at this time they have lined up together with the technicals to form this bearish head and...
READ MORE
MEMBERS ONLY
Shrinking Volume - Holiday Trading or Lack of Participation?
by Erin Swenlin,
Vice President, DecisionPoint.com
Since the election and the explosive rally that resulted, volume has been slowly trending lower. This isn't a phenomenon specific to one index, it has been occurring in three of the large-cap indexes we track using the DecisionPoint Scoreboards. Some have pointed to holiday trading as a possibility....
READ MORE
MEMBERS ONLY
Put/Call Ratio and PMO Analysis Intermediate-Term Bullish
by Erin Swenlin,
Vice President, DecisionPoint.com
The Dow has shattered records, small- and mid-caps are doing the same. Those that have not yet reached record highs are still participating, preparing to break above all-time highs. Indicators for some time have been leaning bearish, but in the past week DecisionPoint indicators in the intermediate term have a...
READ MORE
MEMBERS ONLY
Nasdaq 100 and Techs Reawakening with Possible Double-Bottom
by Erin Swenlin,
Vice President, DecisionPoint.com
Today the NDX switched to a Short-Term Trend Model BUY signal. This signal was triggered when the 5-EMA crossed above the 20-EMA. I don't use STTM signals for trading, but they do work as a temperature gauge. This new STTM BUY signal tells us that the NDX may...
READ MORE