MEMBERS ONLY
Market/Sector Summary Getting Bullish - Minus Lagging Technology SPDR (XLK)
by Erin Swenlin,
Vice President, DecisionPoint.com
With the post-election rally continuing to march ahead, only a few sectors are lagging; the majority, however, are moving to Intermediate-Term Trend Model (ITTM) BUY Signals. BUY signals are triggered when the 20-EMA crosses above the 50-EMA. The Market/Sector Summary posture table is located in the DP Reports blog...
READ MORE
MEMBERS ONLY
Dow Smashes Records, But Where's the Nasdaq 100?
by Erin Swenlin,
Vice President, DecisionPoint.com
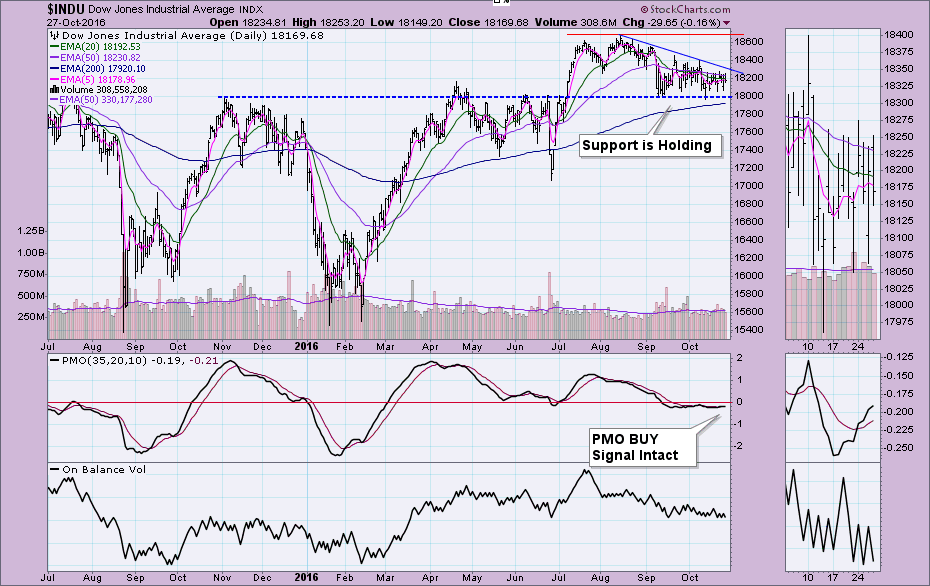
This week has been volatile for the market and the country. After Dow Futures were down well over 5% and even 8% at one point Tuesday night, the Dow surprised everyone with a solid rally on Wednesday. Today that rally was followed by a breakout to new all-time highs. The...
READ MORE
MEMBERS ONLY
What Does the Presidential Election Cycle Tell Us?
by Erin Swenlin,
Vice President, DecisionPoint.com
Technical analysis is a vast discipline that covers many different analysis processes. Through my continuing studies, I remembered reading about the "Presidential Election Cycle" and its effect on the markets. I thought this was a timely article given today is voting day. In this article I'll...
READ MORE
MEMBERS ONLY
NDX at Breaking Point
by Erin Swenlin,
Vice President, DecisionPoint.com
If you look at the DP Scoreboards by themselves, you would note that the NDX appears to have internal strength given that two July BUY signals are still intact in the intermediate term. However, a look at the charts reveals those signals are about to break.
The Intermediate-Term Trend Model...
READ MORE
MEMBERS ONLY
Big Box Costco (COST) and Big Coffee Starbucks (SBUX) in Big Trouble
by Erin Swenlin,
Vice President, DecisionPoint.com
With major support being broken on the SPY (see today's DP Alert blog article for more on the SPY), I decided to run my "dogs" scan. It picks up S&P 500 stocks that have a negative Trend Model configuration (20-EMA < 50-EMA < 200-EMA)...
READ MORE
MEMBERS ONLY
IWM Breaks Below Important Support
by Erin Swenlin,
Vice President, DecisionPoint.com
In Perry Kaufman's book, Trading Systems and Methods, he discusses a relationship between small-caps and large-caps:
"Investors shift from small-cap stocks to the S&P 500 and then to the Dow when they are looking for safety."
A quick comparison of the daily charts of...
READ MORE
MEMBERS ONLY
Gold Recovering Short Term - New Oversold PMO BUY Signal Encouraging
by Erin Swenlin,
Vice President, DecisionPoint.com
Interestingly, Gold has put in a short-term bottom and has held onto it even through the Dollar's magnificent rally. This shows there is likely short-term internal strength and this current support could hold. There are still plenty of obstacles for Gold in the longer term as you'...
READ MORE
MEMBERS ONLY
March Intermediate-Term BUY Signals Abort
by Erin Swenlin,
Vice President, DecisionPoint.com
The DecisionPoint Scoreboards had significant changes this week. Note the difference between last Friday's DP Scoreboard and today's. Scoreboards went from very bullish to very bearish in one week. The intermediate-term BUY signals that were replaced on the SPX and OEX had been in place since...
READ MORE
MEMBERS ONLY
New Intermediate-Term Trend Model Neutral Signal Triggers on SPX
by Erin Swenlin,
Vice President, DecisionPoint.com
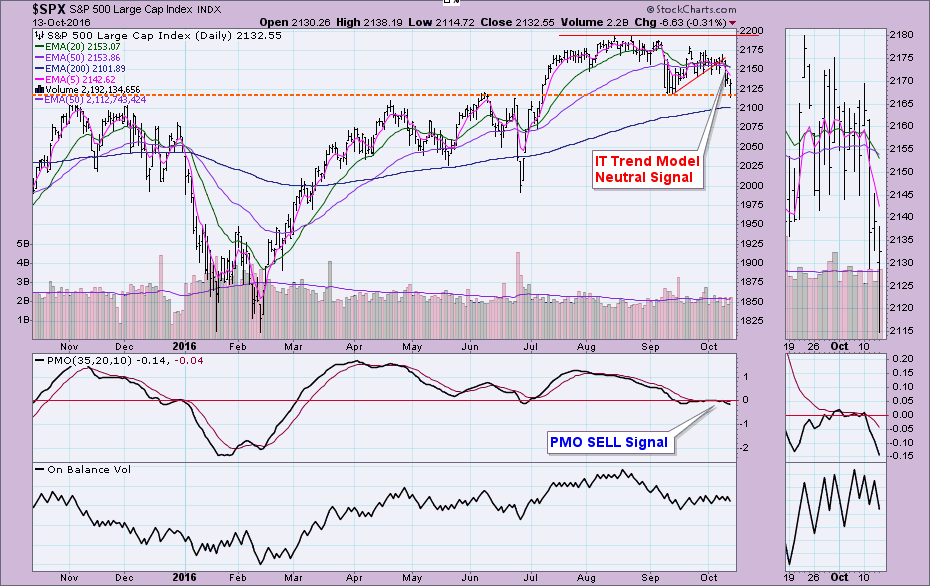
The DecisionPoint Scoreboards have been flipping out. Whipsaw has wreaked havoc on the Short-Term Trend Models (STTMs) and Price Momentum Oscillator (PMO). However, today's signal change is from the Intermediate-Term Trend Model (ITTM). Whipsaw isn't out of the question, but typically it doesn't happen...
READ MORE
MEMBERS ONLY
New Long-TermTrend Model BUY Signal for Natural Gas (UNG)
by Erin Swenlin,
Vice President, DecisionPoint.com
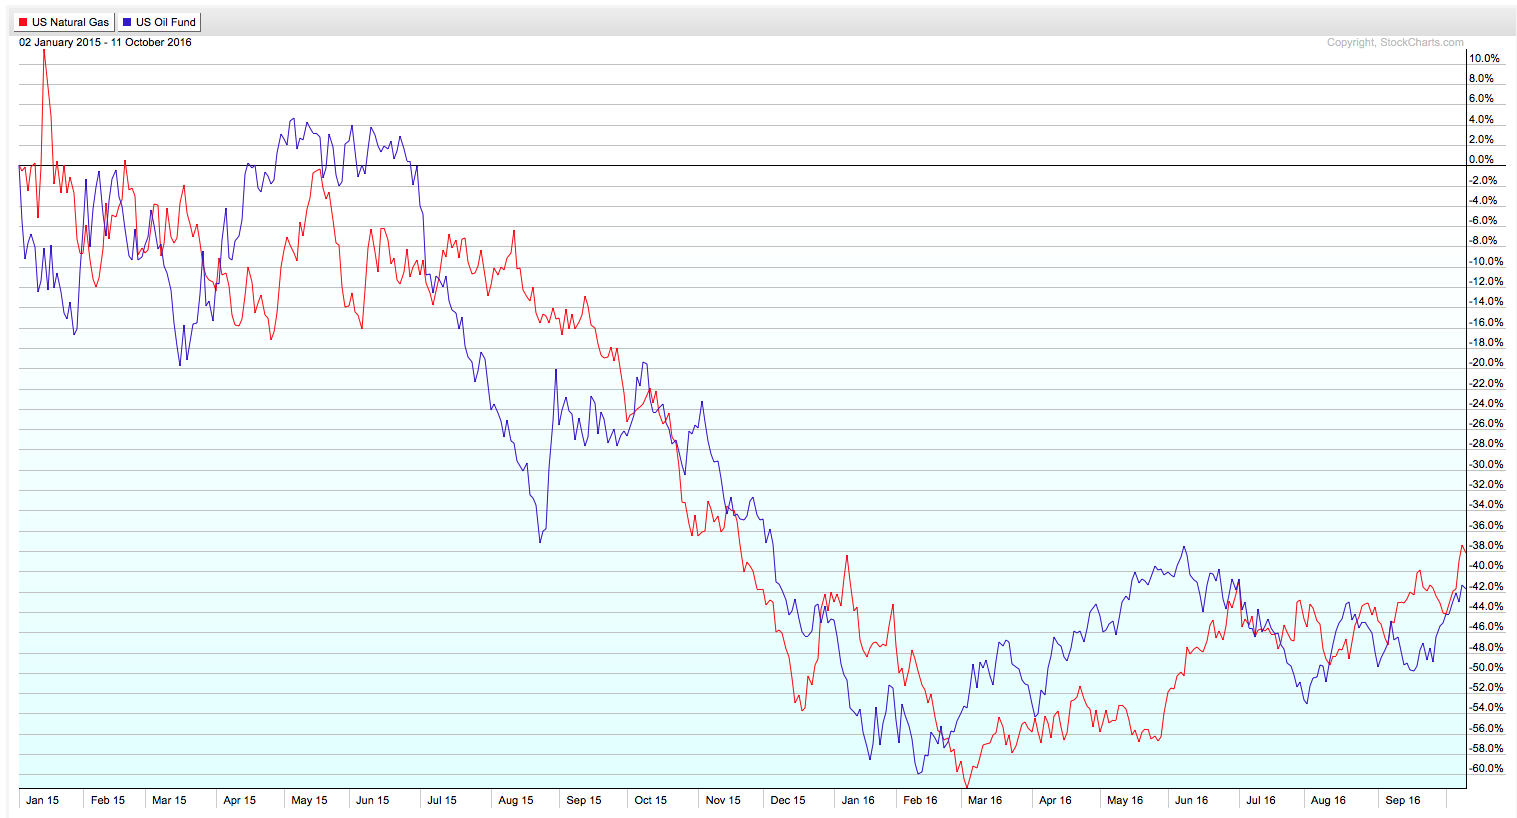
I recently received a request from a webinar viewer to make a comparison between Natural Gas (UNG) and US Oil Fund (USO). As I pulled up the daily chart for UNG, I noted a very important signal. The 50-EMA just crossed above the 200-EMA! This triggers a Long-Term Trend Model...
READ MORE
MEMBERS ONLY
Technical Alerts Go Hand in Hand with DP Scoreboards
by Erin Swenlin,
Vice President, DecisionPoint.com
In Tuesday's blog, "YOU to Can Create DP Scoreboards - Visually Stunning", I explained to you how to find the signals on the charts to create your own DP Scoreboards like the ones located in the DP Chart Galleries. The questions that followed were how to...
READ MORE
MEMBERS ONLY
YOU Too Can Create Your Own DecisionPoint Scoreboards - Visually Stunning
by Erin Swenlin,
Vice President, DecisionPoint.com
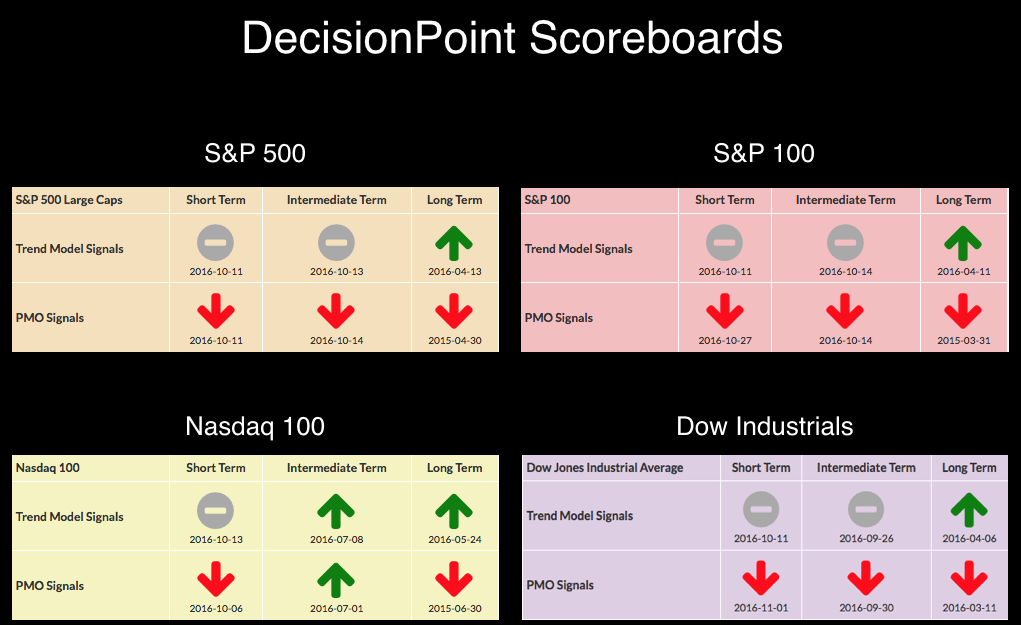
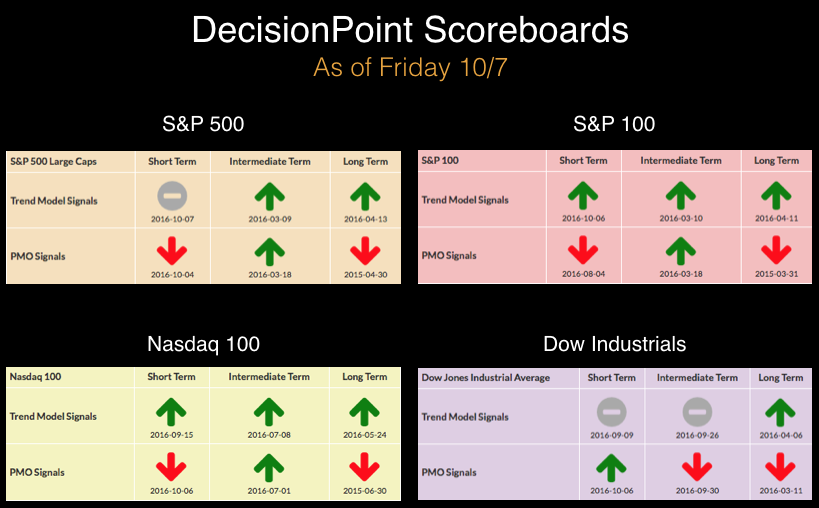
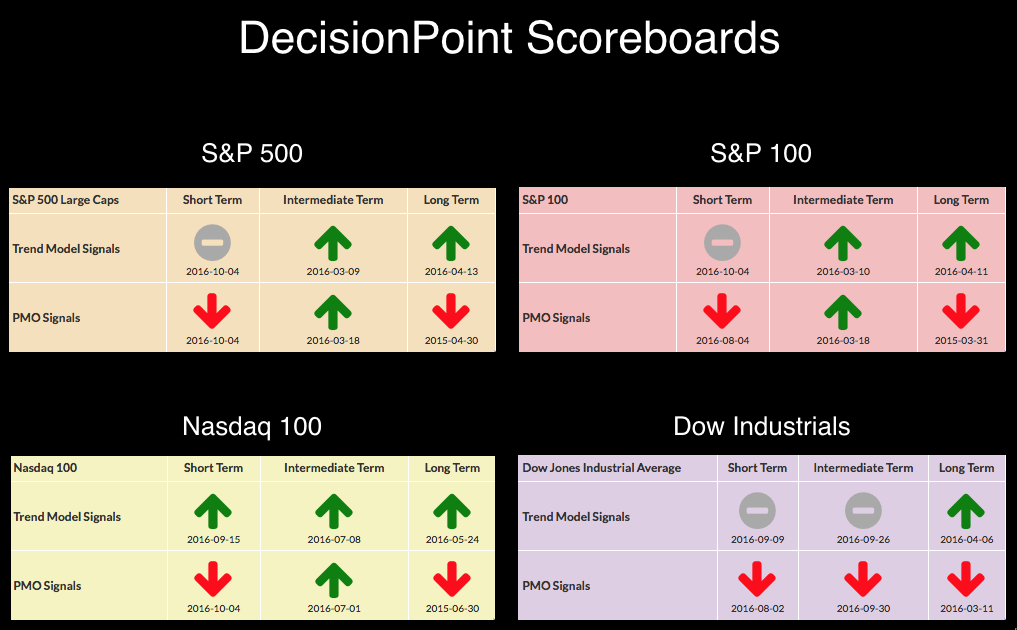
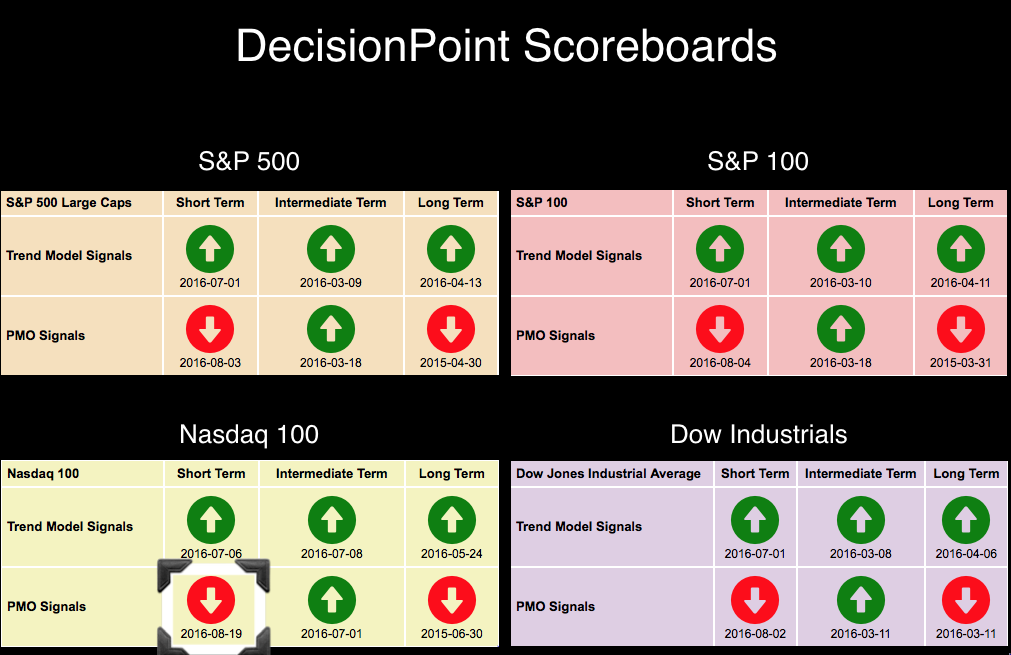
Since the DecisionPoint Scoreboards launched over a year ago, they have been wildly popular. The most current Scoreboards are below. Each of the four Scoreboards headline each index's Chart Gallery. These Scoreboards provide a very quick visual look at what the current trends and momentum readings are in...
READ MORE
MEMBERS ONLY
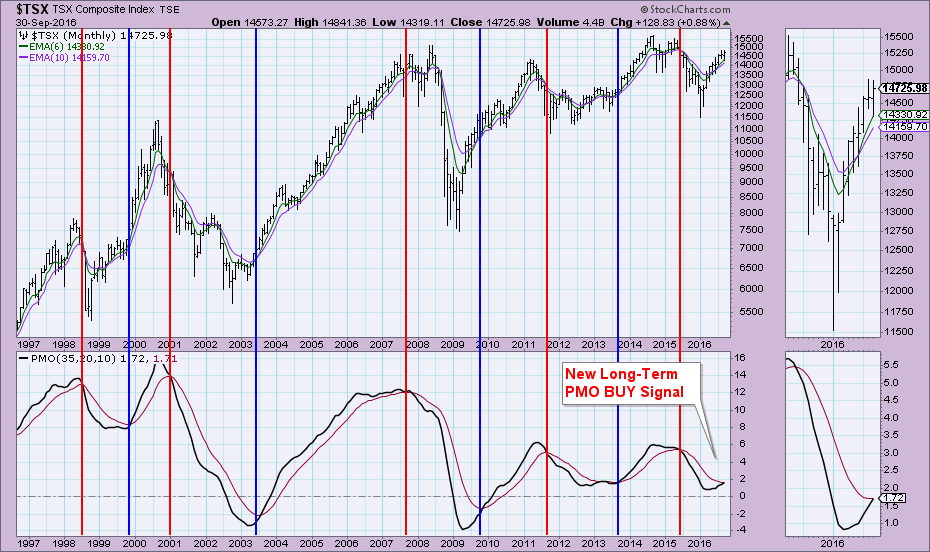
New Long-Term PMO BUY Signal for $TSX
by Erin Swenlin,
Vice President, DecisionPoint.com
Hopefully I won't be stepping on Greg Schnell's Canadian toes, but as I was going through charts from last Wednesday's webinar, I saw that $TSX just had a new LONG-TERM Price Momentum Oscillator (PMO) BUY Signal. These are incredibly infrequent; for the last twenty...
READ MORE
MEMBERS ONLY
TLT Illustrates the Profitable Marriage of the PMO and the SCTR
by Erin Swenlin,
Vice President, DecisionPoint.com
I loved ChartCon 2016 for many reasons, chief among them was education--the education of you and me. Our education is inevitable when you can network with or watch John Murphy, Martin Pring, Greg Morris, Arthur Hill...and so on! Greg Schnell is another "tech titan" who presented at...
READ MORE
MEMBERS ONLY
Thrust/Trend Model Chart Warns of More Decline
by Erin Swenlin,
Vice President, DecisionPoint.com
A comment on a recent DecisionPoint Alert blog article prompted me to review the Thrust/Trend Model indicator chart. During Friday's webinar I brushed over it as time was quickly disappearing. I promised to go over it in more detail in my ChartWatchers article. So here we go!...
READ MORE
MEMBERS ONLY
Why I'm a ChartWatcher
by Erin Swenlin,
Vice President, DecisionPoint.com
It happened all in the same day. I was talking to my dad, Carl Swenlin exclaiming how I think I'm "chart pattern crazy". Then, I received a chart via email from one of my "DecisionPoint Report" webinar viewers. He actually sent the chart to...
READ MORE
MEMBERS ONLY
Using DecisionPoint Timing Signals to Improve your Portfolio
by Erin Swenlin,
Vice President, DecisionPoint.com
If today's blog title is enticing, then you definitely should consider signing up for ChartCon 2016 - September 23/24. This is the title of my presentation. Obviously, I don't have the time or space to write about this in detail, but I did want to...
READ MORE
MEMBERS ONLY
A Trip to Financial Sense
by Erin Swenlin,
Vice President, DecisionPoint.com
I was recently interviewed on FinancialSense.com regarding the DecisionPoint outlook in the short, intermediate and long terms. What seemed to get the most notice was that I said that it wasn't out of the question that we could be preparing for a new bull market leg. Admittedly,...
READ MORE
MEMBERS ONLY
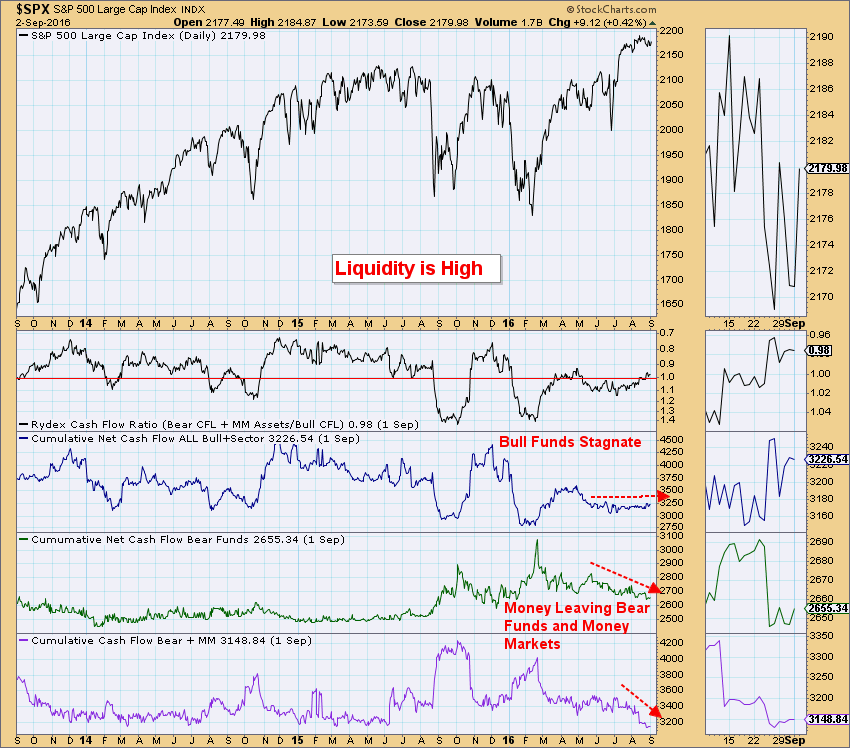
Rydex Cashflow and NAAIM Chart Suggest Market Liquidity
by Erin Swenlin,
Vice President, DecisionPoint.com
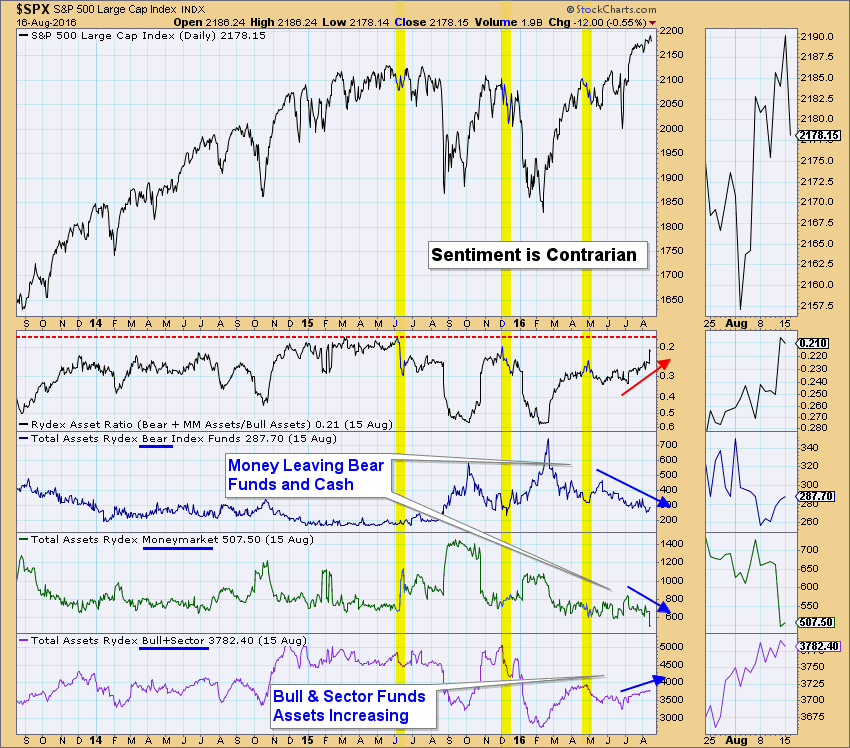
Liquidity can be equated to the availability of money. In terms of the market, when there is money on the sidelines, it is available for investing and could boost the market when/if it is invested. There are many measures, but I like using the Rydex Cashflow Ratio chart as...
READ MORE
MEMBERS ONLY
Natural Gas ETF (UNG) Lights Up and Triggers PMO BUY Signal
by Erin Swenlin,
Vice President, DecisionPoint.com
Oil has been enjoying a strong rally. I wrote about a possible bull flag forming on Oil in today's DecisionPoint Alert blog that you may want to review. Natural gas, on the other hand, has not had the advantages that Oil has had. However, it may be lighting...
READ MORE
MEMBERS ONLY
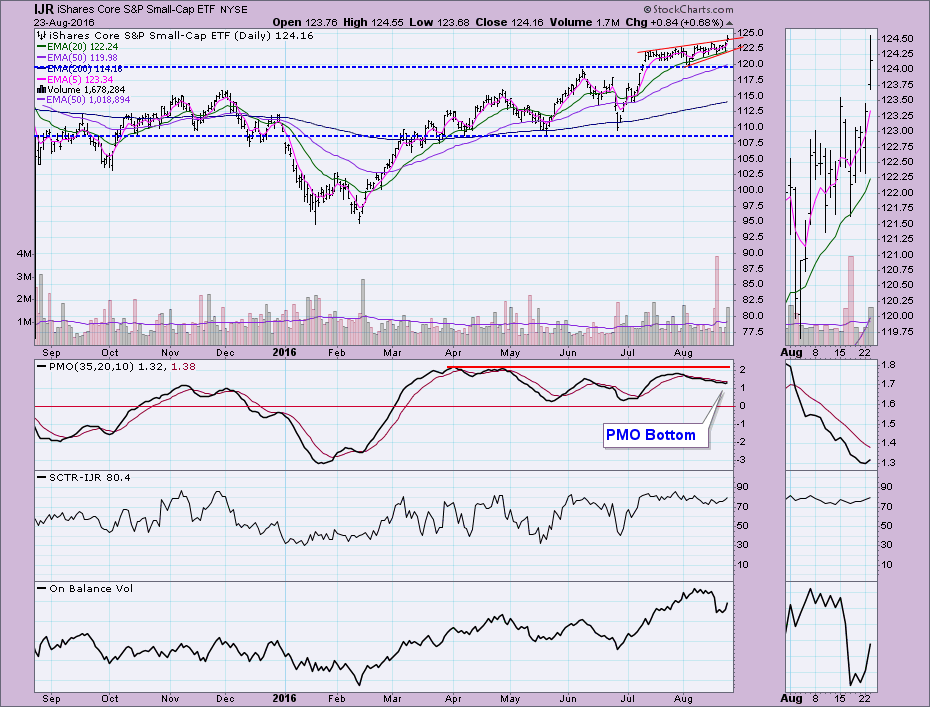
Small-Cap ETFs Reveal Bullish Bias
by Erin Swenlin,
Vice President, DecisionPoint.com
An increase in bullishness on small-cap stocks is needed to support a new bull market move. Small-cap participation or better yet, small-cap leadership can help determine the health of the market in general.
While reviewing the small-cap ETFs in the DecisionPoint LIVE public ChartList, I noticed some bullish characteristics, especially...
READ MORE
MEMBERS ONLY
NDX New PMO SELL Signal
by Erin Swenlin,
Vice President, DecisionPoint.com
The DecisionPoint Scoreboards have been quiet since the beginning of the month when we saw the OEX, SPX and Dow all switch to short-term Price Momentum Oscillator (PMO) SELL signals. The NDX which has been enjoying a steep rally, has stalled. In so doing, momentum switched negative and hence the...
READ MORE
MEMBERS ONLY
Technology ETF (XLK) Ready for a Pullback
by Erin Swenlin,
Vice President, DecisionPoint.com
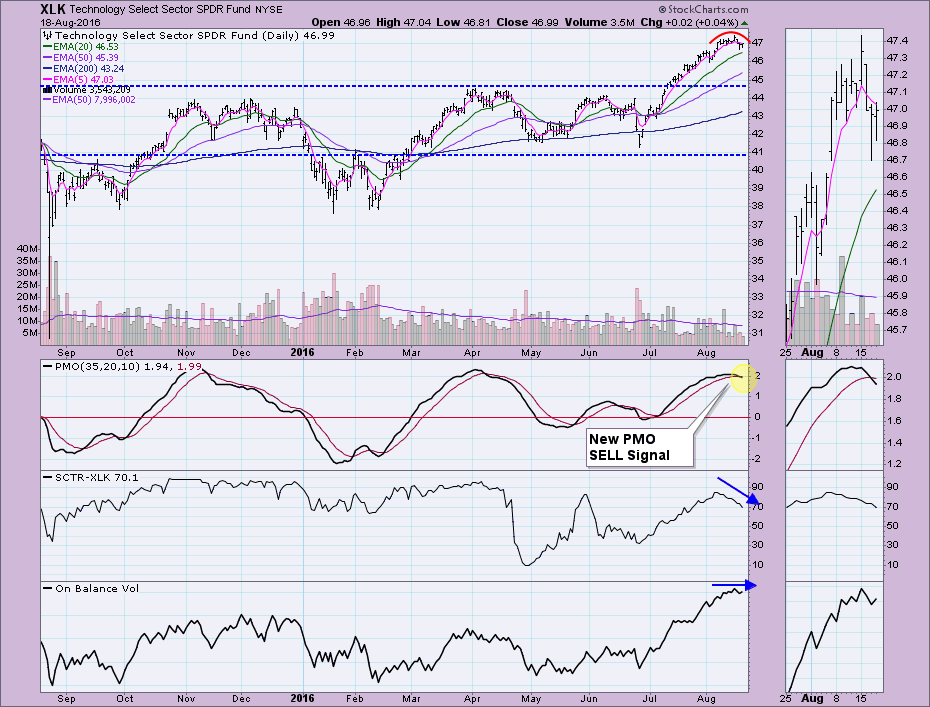
While reviewing the DecisionPoint Market/Sector Summary today, I noticed the Technology SPDR (XLK) triggered a new Price Momentum Oscillator (PMO) SELL signal. When I get these "attention flags", I immediately want to check out the chart.
XLK's daily chart shows a distinct rounded top formation...
READ MORE
MEMBERS ONLY
Rydex Assets Question - New DecisionPoint LIVE ChartList
by Erin Swenlin,
Vice President, DecisionPoint.com
StockCharts.com members got a sneak peek yesterday at the new DecisionPoint LIVE Public ChartList. There you will find all of the charts that I analyze during my webinars. They will be updated prior to my webinars on Wednesdays and Fridays. Additionally, I'll include a Chart Spotlight or...
READ MORE
MEMBERS ONLY
No Manure - Agribusiness ETF (MOO) Corralled Using DP ETF Tracker
by Erin Swenlin,
Vice President, DecisionPoint.com
DecisionPoint Reports are created everyday but not many know how to use them to quickly find investments. While reviewing the ETF Tracker spreadsheet, I realized there were some interesting attention flags. Let me enlighten you on a very underused investment tool available to members.
While Price Momentum Oscillator (PMO) scans...
READ MORE
MEMBERS ONLY
Three New DP Scoreboard PMO SELL Signals
by Erin Swenlin,
Vice President, DecisionPoint.com
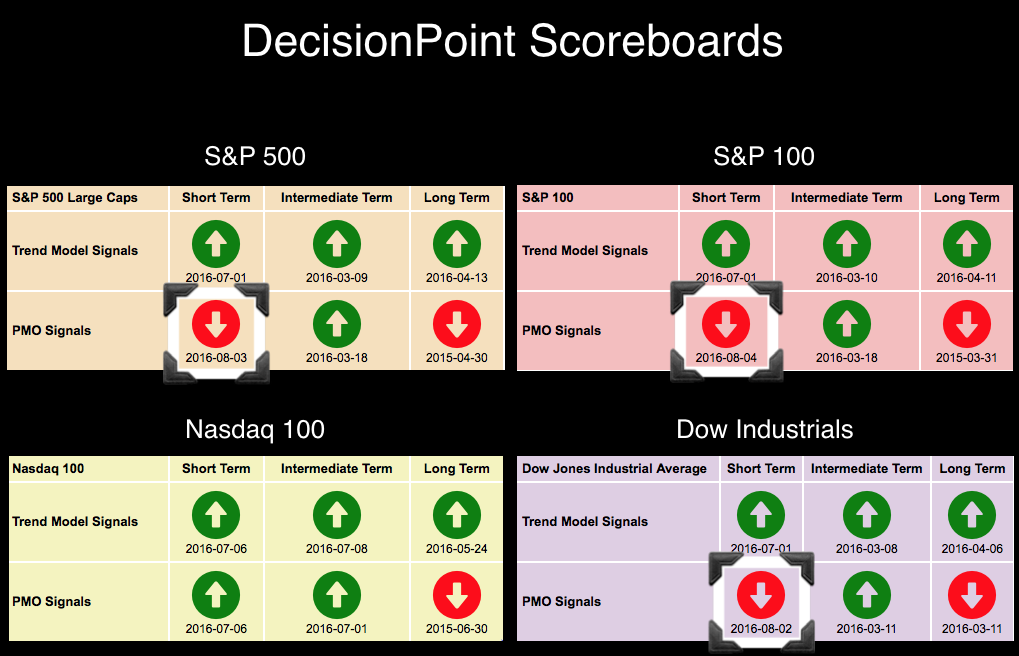
As you can see on the DP Scoreboards, this week has brought three new Price Momentum Oscillator (PMO) SELL signals to the Dow, SPX and today, OEX. The question is whether this spells DOOM for all.
"Doom" is likely too strong an adjective to describe what is being...
READ MORE
MEMBERS ONLY
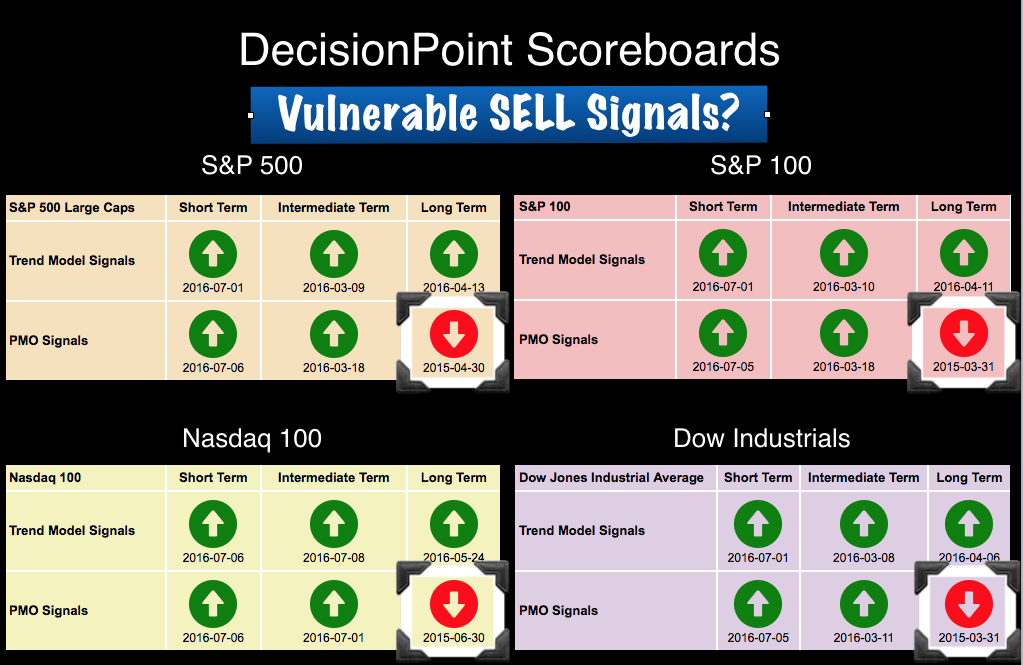
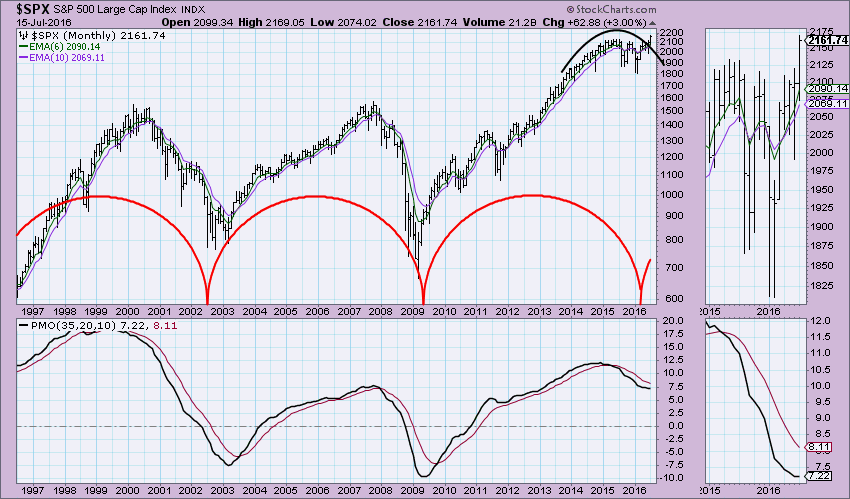
Monthly PMO SELL Signals Vulnerable?
by Erin Swenlin,
Vice President, DecisionPoint.com
The DecisionPoint Scoreboards stopped changing on July 8th as the final BUY signal was added to the Nasdaq 100's Scoreboard. The question is how much longer before the other four SELL signals are erased? The Long-Term Price Momentum Oscillator (PMO) Signal is generated on the monthly charts which...
READ MORE
MEMBERS ONLY
Topping or Pausing?
by Erin Swenlin,
Vice President, DecisionPoint.com
One look at the DecisionPoint Scoreboards and a review of the DP Market/Sector Summary and you'll see the plethora of BUY signals and green paint. Yet the market is traveling sideways and has been for 12 days. Should we expect an upside break or downside break? Read...
READ MORE
MEMBERS ONLY
Nasdaq 100 Catching Up to All-Time Highs - What Could This Mean for Market?
by Erin Swenlin,
Vice President, DecisionPoint.com
The Nasdaq 100 has been running toward its all-time highs while the S&P 500 already surpassed its all-time high a few weeks ago. The SPX has been consolidating sideways and rounding ever since the breakout; whereas, the NDX continued to stretch upward. It's visible more clearly...
READ MORE
MEMBERS ONLY
Halfway to Bond Timer of the Year
by Erin Swenlin,
Vice President, DecisionPoint.com
DecisionPoint timing models are tracked by Timer Digest, a professional journal for technical analysis timing. Per their website, "Timer Digest monitors over 100 of the nations leading market timing models, ranking the top stock, bond, and gold timers according to the performance of their recommendations over the previous 52...
READ MORE
MEMBERS ONLY
Long-Term Cycle Chart Suggests Higher Prices
by Erin Swenlin,
Vice President, DecisionPoint.com
Let me first profess that I am not an avid follower of cycle charts. They generally take too much tinkering for my taste as they never quite fit over the long haul. However, as I was flipping through some of my longer-term charts, I ran into a chart I created...
READ MORE
MEMBERS ONLY
Pay Attention to Price Momentum Oscillator Ranges!
by Erin Swenlin,
Vice President, DecisionPoint.com
The Price Momentum Oscillator (PMO) is mostly bounded oscillator. The PMO can be calculated for any stock, index, ETF, etc. Interestingly, each of them have their own "normal" ranges. The PMO is particularly useful in determining overbought and oversold conditions, but you can many times be fooled as...
READ MORE
MEMBERS ONLY
Market Looking Toppy - Short-Term Indicators Confirm
by Erin Swenlin,
Vice President, DecisionPoint.com
There is no denying it, the market experienced an amazing rally this past week after the waterfall correction initiated by Brexit. Now prices are where they were before the landmark vote. The question is whether this rally will persist now that price is reaching strong overhead resistance once again.
Looking...
READ MORE
MEMBERS ONLY
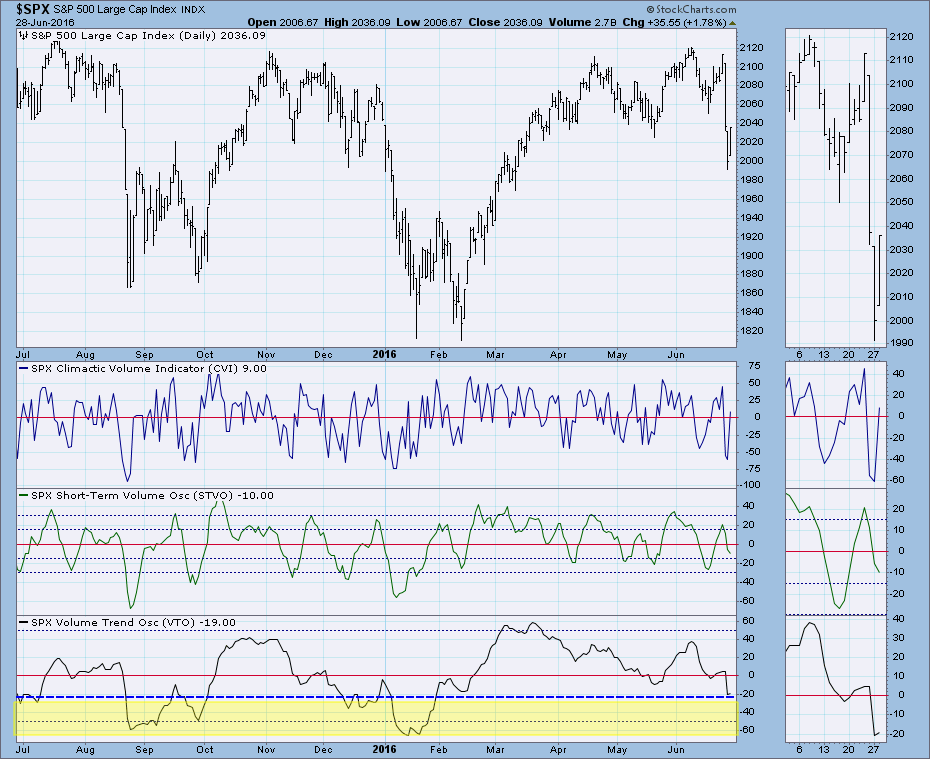
On Balance Volume Indicator Suite - SPY v. NDX
by Erin Swenlin,
Vice President, DecisionPoint.com
The free DecisionPoint Market Indicator (DPMI) ChartPack includes numerous indicator sets for major indexes and sectors. Today I'm concentrating on the On Balance Volume indicator set which is made up of the Climactic Volume Indicator (CVI), Short-Term Volume Oscillator (STVO) and the Volume Trend Oscillator (VTO). Generally, I...
READ MORE
MEMBERS ONLY
Buying Exhaustion Likely
by Erin Swenlin,
Vice President, DecisionPoint.com
Today's rally was impressive after three days of consolidation, but indicators suggest it won't last. Below I've annotated ultra-short-term and short-term indicator charts for the S&P 500. See if you agree with my conclusion.
Reading ultra-short-term indicator charts can be tricky. First,...
READ MORE
MEMBERS ONLY
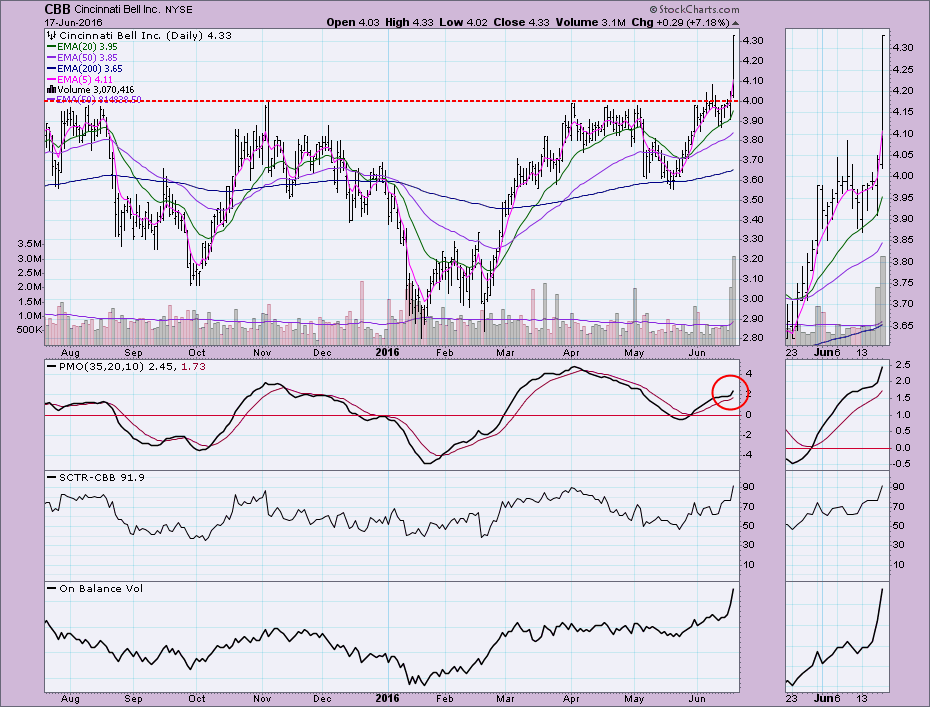
Cincinnati Bell (CBB) Revisited
by Erin Swenlin,
Vice President, DecisionPoint.com
I wrote an article on Cincinnati Bell (CBB) at the end of May. I stated back then that a move to $4.00 was likely. The Price Momentum Oscillator (PMO) had bottomed but had yet to deliver a BUY signal. Since then CBB has gone through a few changes. The...
READ MORE
MEMBERS ONLY
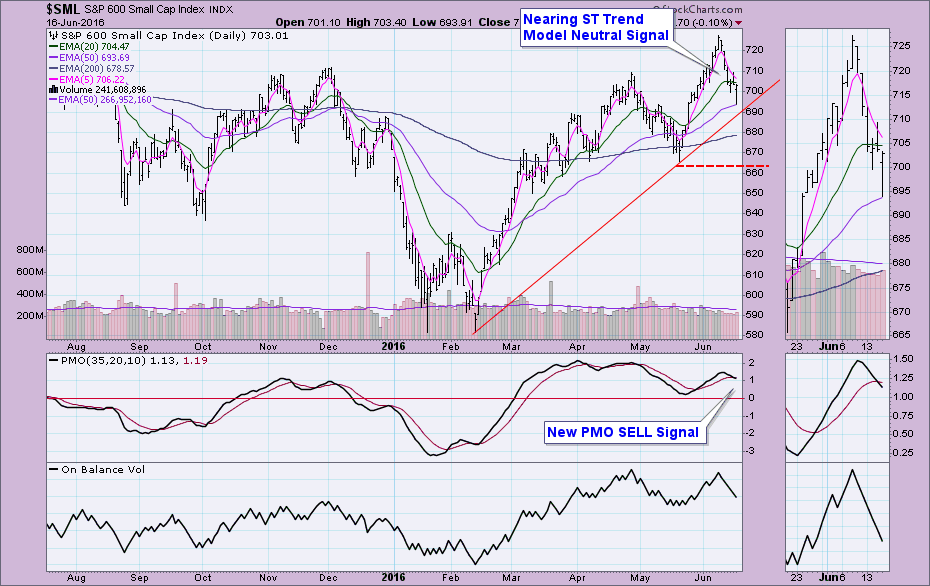
PMO SELL Signal Triggers on S&P 600 ($SML)
by Erin Swenlin,
Vice President, DecisionPoint.com
We saw on Tuesday four new Price Momentum Oscillator (PMO) SELL signals on the DecisionPoint Scoreboards which I wrote about in Tuesday's article. It isn't surprising to see Small Caps share a similar fate.
I've annotated the new PMO SELL signal on the daily...
READ MORE
MEMBERS ONLY
Decline Shakes Up the DP Scoreboards
by Erin Swenlin,
Vice President, DecisionPoint.com
Nearly all of the short-term BUY signals on the DecisionPoint Scoreboards (found in the DP Chart Gallery) were lost today. It is a result of the rather steep decline yanking 5-EMAs and Price Momentum Oscillators (PMOs) downward. However, they have arrived just as the indexes have landed close to support...
READ MORE
MEMBERS ONLY
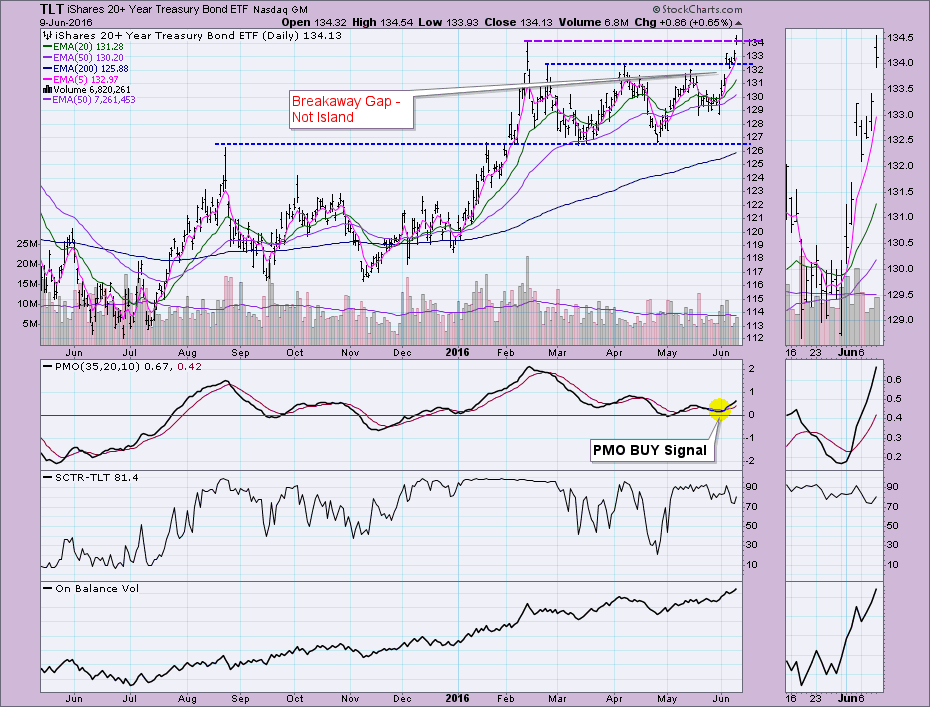
TLT Hits New All-Time High - More to Come?
by Erin Swenlin,
Vice President, DecisionPoint.com
Yesterday it appeared that TLT had formed a reverse island formation. However, with the Price Momentum Oscillator (PMO) on a BUY signal, the SCTR with a healthy 75+ reading and an OBV line trending higher, I knew it wasn't a good fit. I suggested it might be a...
READ MORE
MEMBERS ONLY
Only Sector with Declining Momentum is... the Financial (XLF, RYF) Sector
by Erin Swenlin,
Vice President, DecisionPoint.com
I have been watching the DecisionPoint Market/Sector Summary Daily Report (located in the "DP Reports" blog) closely, actually, one table in particular. The "PMO Crossover Signals" table identifies whether a particular sector is on a Price Momentum Oscillator (PMO) BUY or SELL Signal. You'...
READ MORE