MEMBERS ONLY
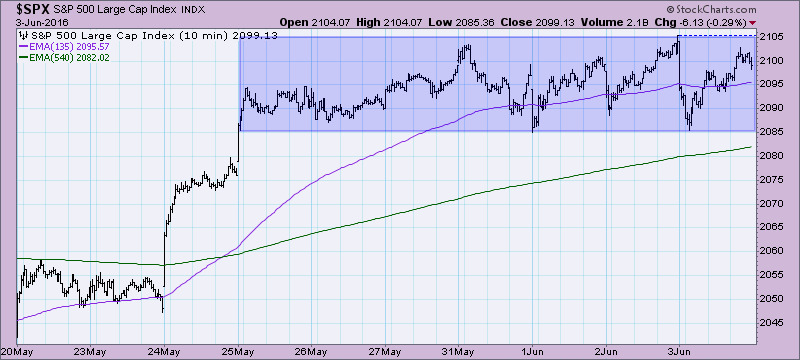
Short-Term Indicators Bearish But Intermediate-Term Indicators Bullish
by Erin Swenlin,
Vice President, DecisionPoint.com
The S&P 500 hit overhead resistance at the April high and has stalled. If you look at the 10-minute bar chart for the past 10 days, you can see that price has been consolidating for over a week and has failed to overcome resistance.
As this consolidation started,...
READ MORE
MEMBERS ONLY
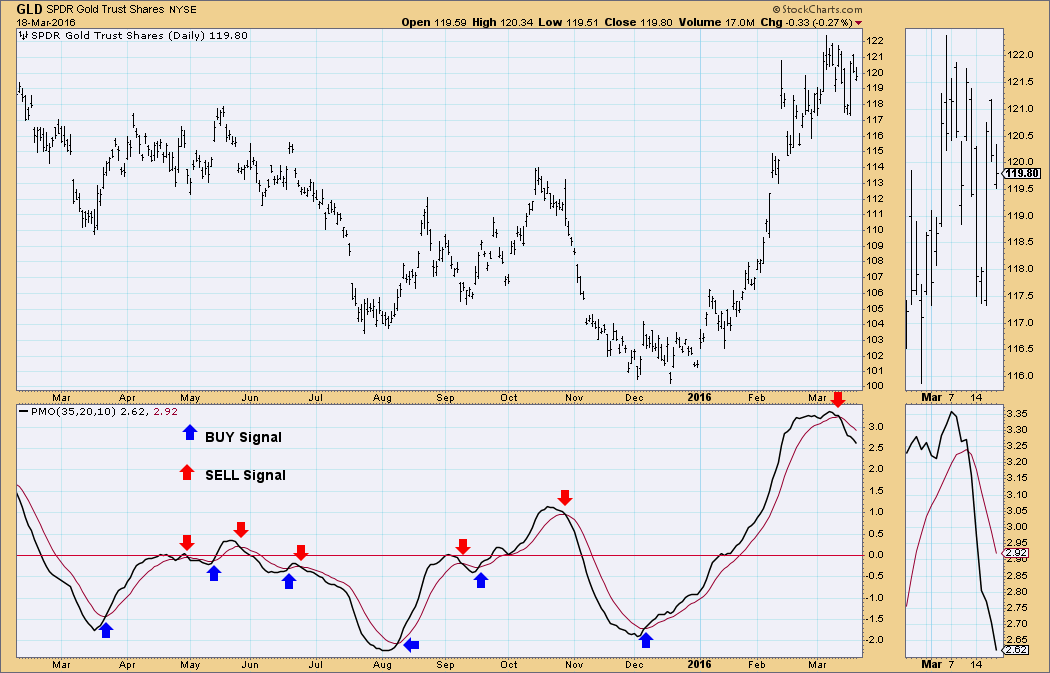
Gold Holds Support but Triggers an Intermediate-Term Trend Model Neutral Signal
by Erin Swenlin,
Vice President, DecisionPoint.com
Today's signal change probably isn't too surprising given the pesky correction that has been plaguing Gold. The question is whether it has arrived late to the party given that price seems to have found short-term support at the October 2015 high. A look at all three...
READ MORE
MEMBERS ONLY
Monthly Scoreboard Charts Reviewed - Long-Term Momentum Still Negative
by Erin Swenlin,
Vice President, DecisionPoint.com
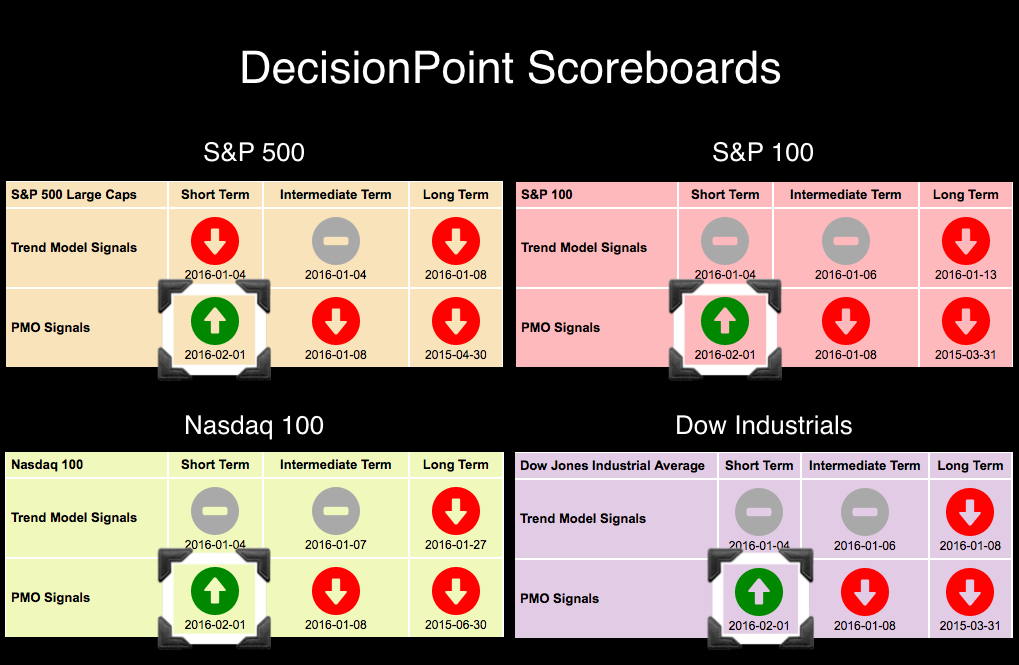
Below is the current status of the DecisionPoint Scoreboards. You'll note in the Scoreboard from April (purple) that there were only a few changes that occurred by month-end. The most interesting would be the two new BUY signals on the NDX. The Dow now has the most negative...
READ MORE
MEMBERS ONLY
One Ringy Dingy, Two Ringy Dingy... Cincinnati Bell (CBB) Calling
by Erin Swenlin,
Vice President, DecisionPoint.com
With the market rallying and new Price Momentum Oscillator (PMO) signals moving to BUY signals, I decided to do one of my PMO scans. This particular scan looks for stocks/ETFs with PMOs that have been rising for three days and have just had a 5/20-EMA positive crossover today....
READ MORE
MEMBERS ONLY
NDX Brushes Off Long-Term SELL Signal and Triggers New Short-Term BUY Signal
by Erin Swenlin,
Vice President, DecisionPoint.com
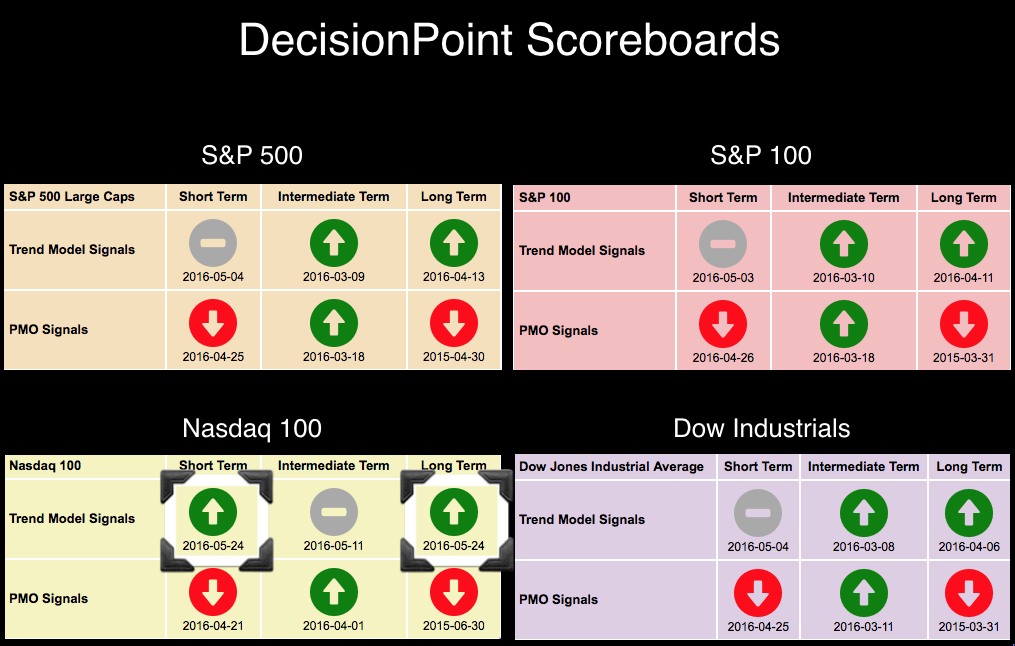
The Nasdaq 100 (NDX) has been very weak in comparison to most of the large cap indexes; however, it was reinvigorated with today's rally. You'll note on the DecisionPoint Scoreboard Summary below a highlight of the new BUY signals for the NDX. One important point to...
READ MORE
MEMBERS ONLY
PMO Analysis - SPX Not Ready to Bottom, But NDX Is?
by Erin Swenlin,
Vice President, DecisionPoint.com
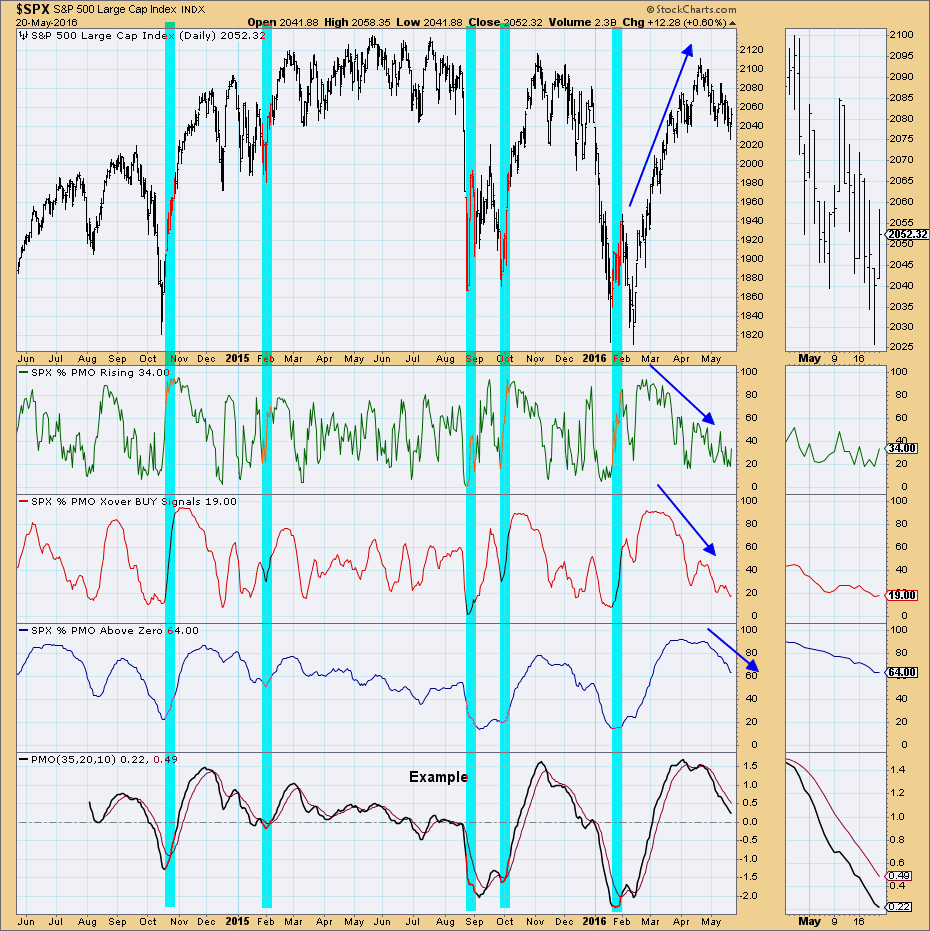
During today's webinar, my "Bonus Indicator Chart" was the Price Momentum Oscillator (PMO) Analysis chart for the SPX. It reveals that it doesn't have the internal strength necessary (yet) to rally out of the current declining trend. The NDX is beginning to show signs...
READ MORE
MEMBERS ONLY
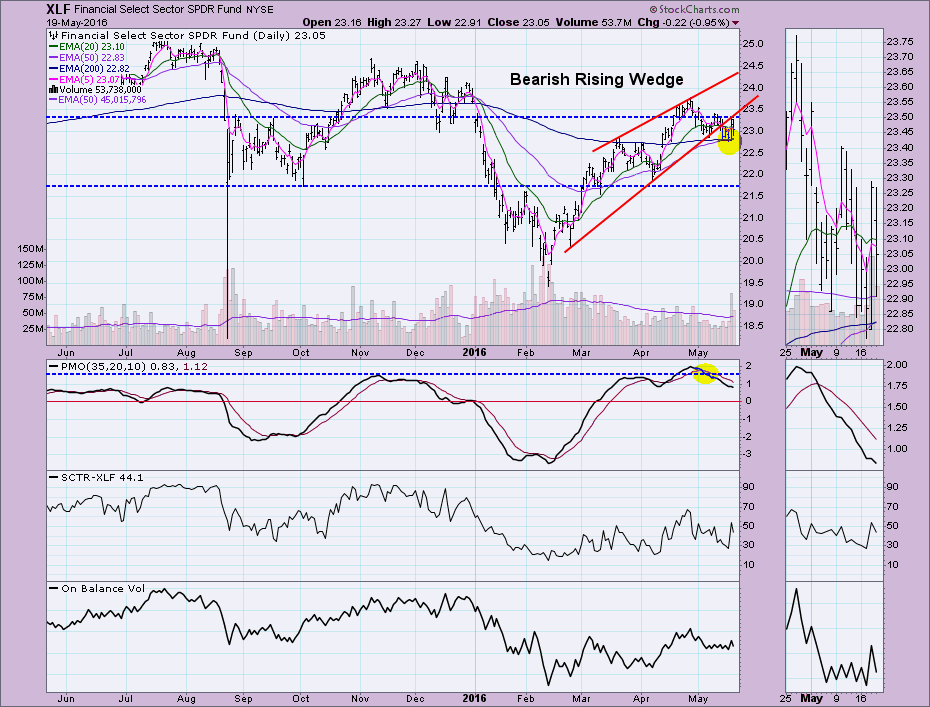
Financial SPDR (XLF) Garners a Long-Term Trend Model BUY Signal
by Erin Swenlin,
Vice President, DecisionPoint.com
What, what? A new Long-Term Trend Model (LTTM) BUY signal for XLF? Indeed. Yet, how bullish is the Financial sector in the short, medium and long terms? After reviewing the daily, weekly and monthly charts, the conclusion is that the Financial sector may not be as robust as this signal...
READ MORE
MEMBERS ONLY
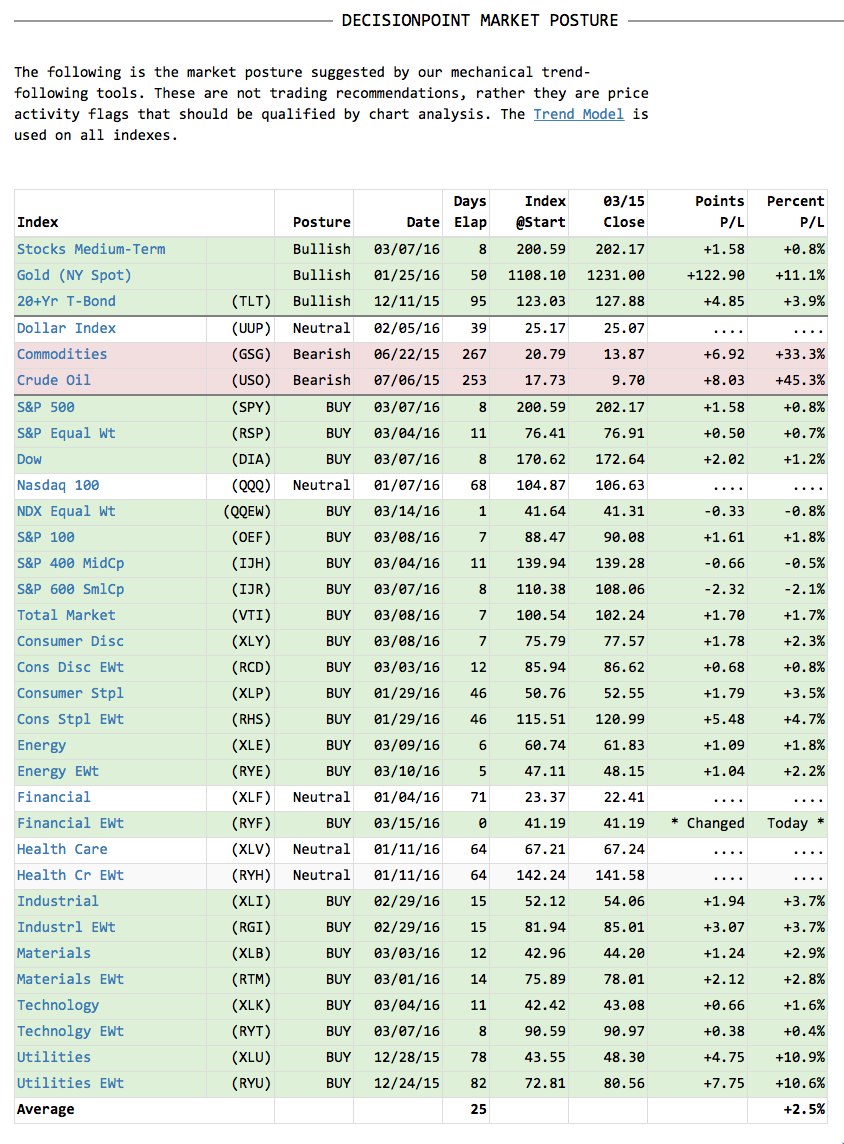
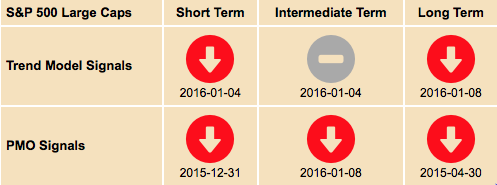
Intermediate-Term versus Short-Term Conditions
by Erin Swenlin,
Vice President, DecisionPoint.com
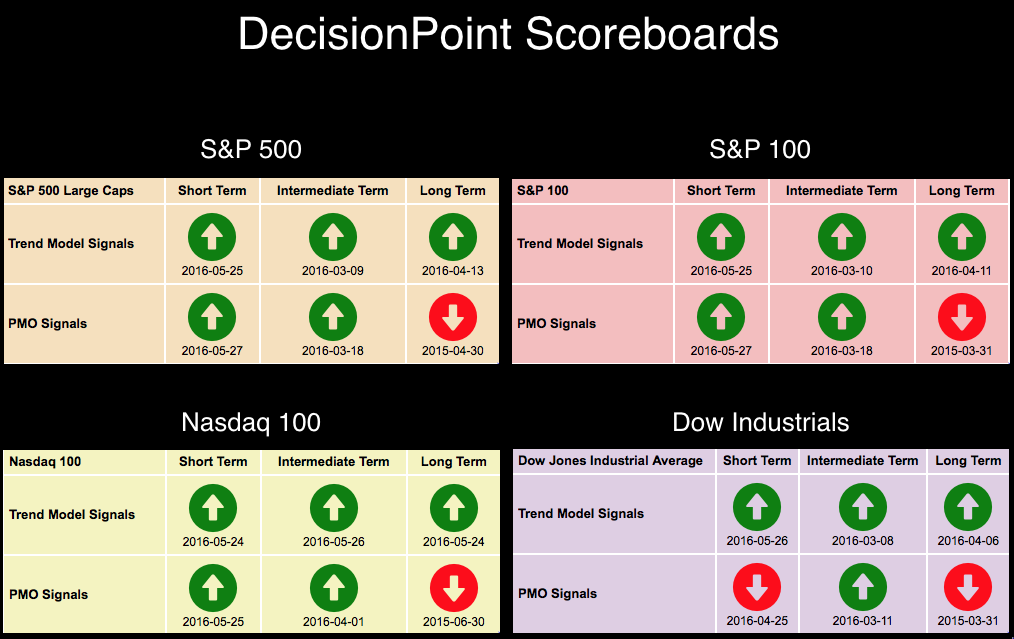
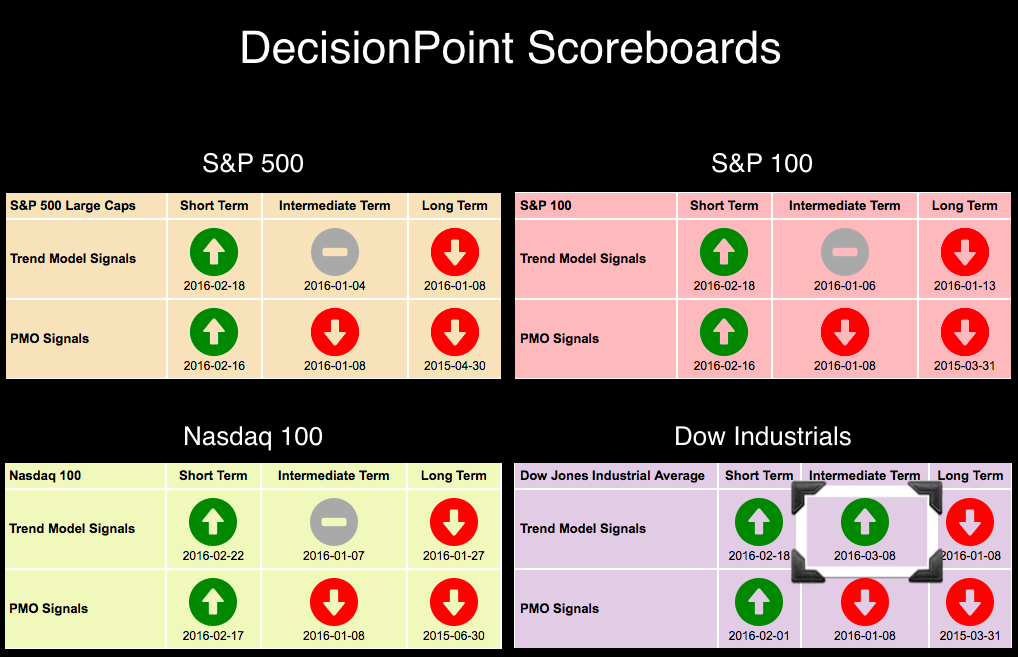
We haven't seen much change to the DecisionPoint Scoreboards and as they stand now (seen below), the intermediate term is clearly bullish versus the short term which is bearish.
One of the best ways to make a more detailed comparison by index and sector is to use the...
READ MORE
MEMBERS ONLY
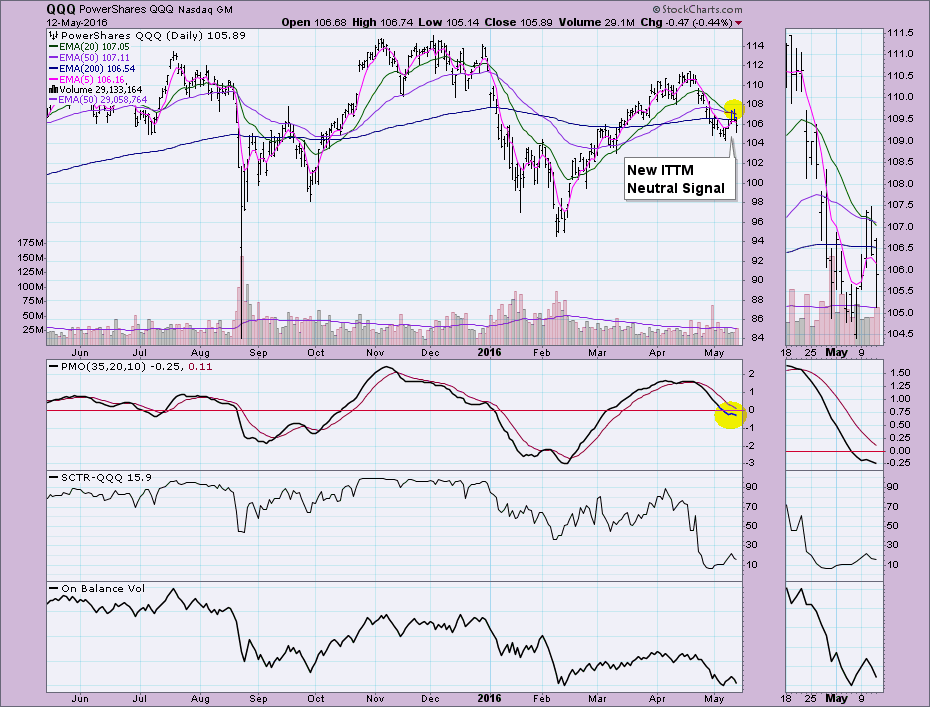
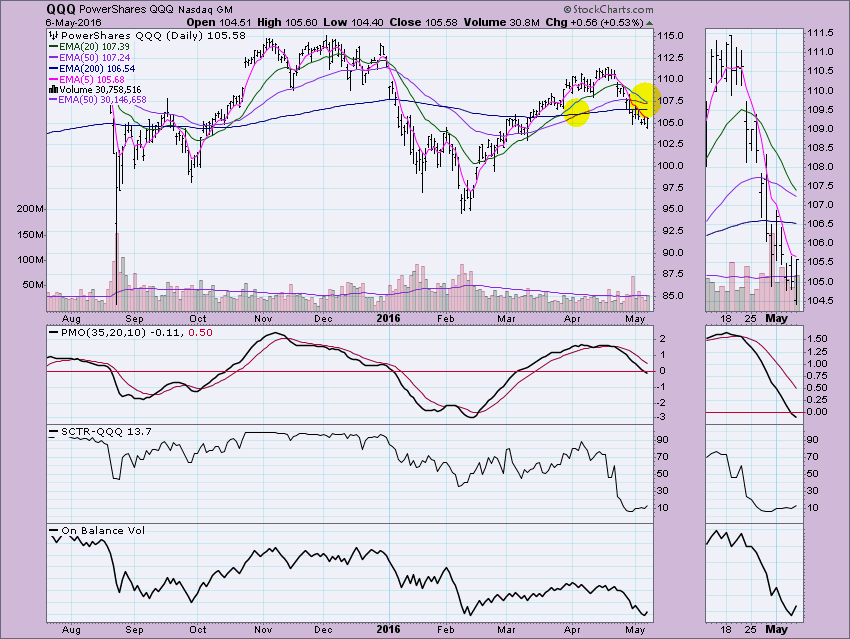
QQQ and QQEW Lose Intermediate-Term BUY Signals
by Erin Swenlin,
Vice President, DecisionPoint.com
The Nasdaq 100 lost its Intermediate-Term Trend Model (ITTM) BUY signal yesterday, so it wasn't a total surprise to see the QQQ and QQEW (equal-weight version of NDX) lose theirs today. What is interesting, is that QQEW moved to an ITTM SELL signal versus the NDX and QQQ...
READ MORE
MEMBERS ONLY
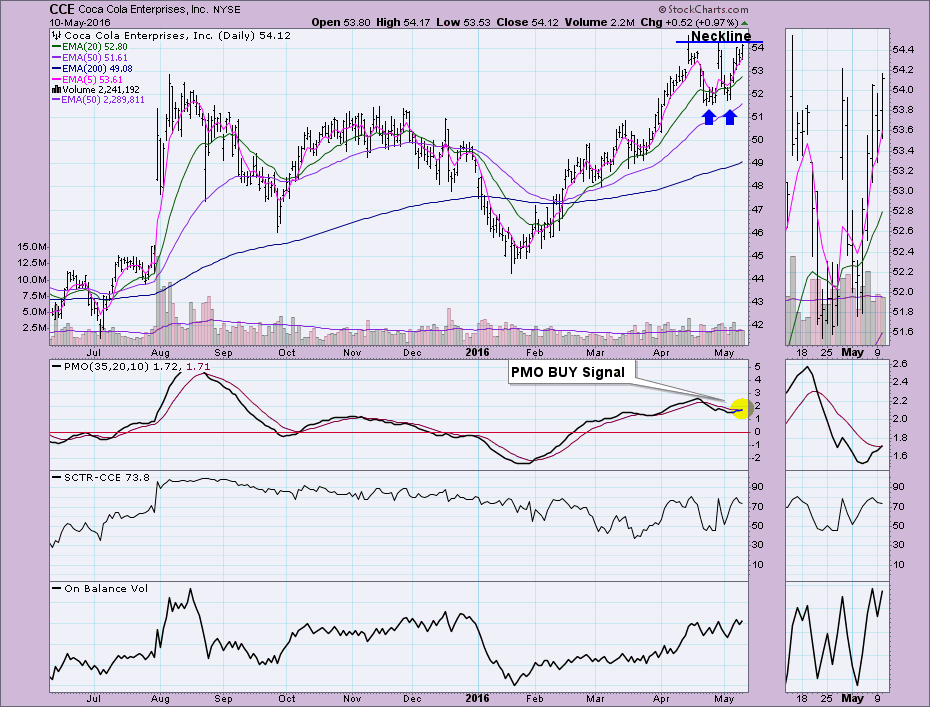
A Coke and a Smile
by Erin Swenlin,
Vice President, DecisionPoint.com
Coca-Cola (CCE) is lining up for a possible short-term breakout and rally. One of my many Price Momentum Oscillator (PMO) scans pulled up this stock. The scan looks for stocks with positive Trend Model configuration (5-EMA > 20-EMA > 50-EMA > 200-EMA) that have just had a PMO BUY signal...
READ MORE
MEMBERS ONLY
NDX Equal-Weight ETF (QQEW) Weak Against QQQ
by Erin Swenlin,
Vice President, DecisionPoint.com
As I reviewed the charts of the Nasdaq 100 with my viewers during webinar today, I started to wonder how the equal-weight version was stacking up against the NDX ETF (QQQ). Typically the equal-weight versions do better over time than their cap-weighted counterparts. (Carl wrote an excellent article on this...
READ MORE
MEMBERS ONLY
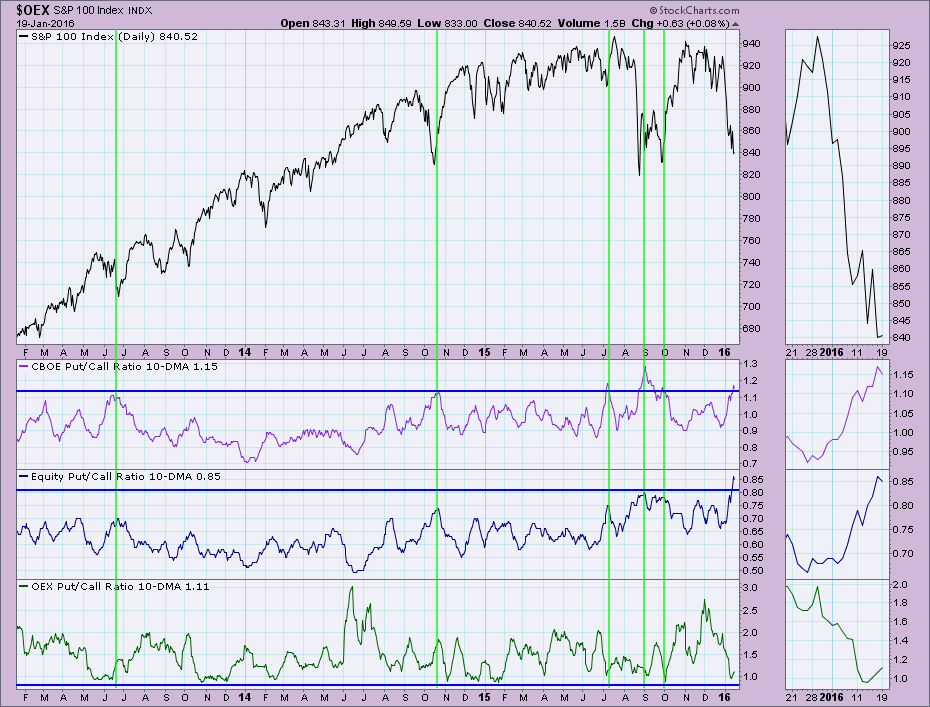
Put/Call Ratio Revisited
by Erin Swenlin,
Vice President, DecisionPoint.com
Back in January, I wrote an article about the bullishness of the Put/Call Ratio 10-DMA. As I was reviewing charts to determine what today's article would be about, I came upon this chart again. I think it would be interesting to look at the static version of...
READ MORE
MEMBERS ONLY
Percent Buy Index (PBI) - Excellent Compass in Volatile Times
by Erin Swenlin,
Vice President, DecisionPoint.com
I received an email from a reader "thanking" me for a lucrative trade that he based off of the Thrust/Trend Model. In actuality, it turned out he used the Percent Buy Index (PBI) negative crossover not the Thrust/Trend Model per se (see the series of articles...
READ MORE
MEMBERS ONLY
Four Signs that a Bull Market is Upon Us
by Erin Swenlin,
Vice President, DecisionPoint.com
During last Friday's webinar, I attempted to answer the "$64 Million Dollar Question" (For old-timers like me who know it was the $64,000 Question, I chose to use poetic license because $64,000 sounds lame by today's standards!) that readers and viewers have...
READ MORE
MEMBERS ONLY
Nasdaq 100 Loses February PMO BUY Signal
by Erin Swenlin,
Vice President, DecisionPoint.com
The Nasdaq 100 had managed to avoid a Price Momentum Oscillator (PMO) SELL signal while the other major indexes on the DecisionPoint Scoreboard did not. Of course, their PMO SELL signals only lasted a week as whipsaw PMO BUY signals arrived shortly thereafter. The NDX's previous BUY signal...
READ MORE
MEMBERS ONLY
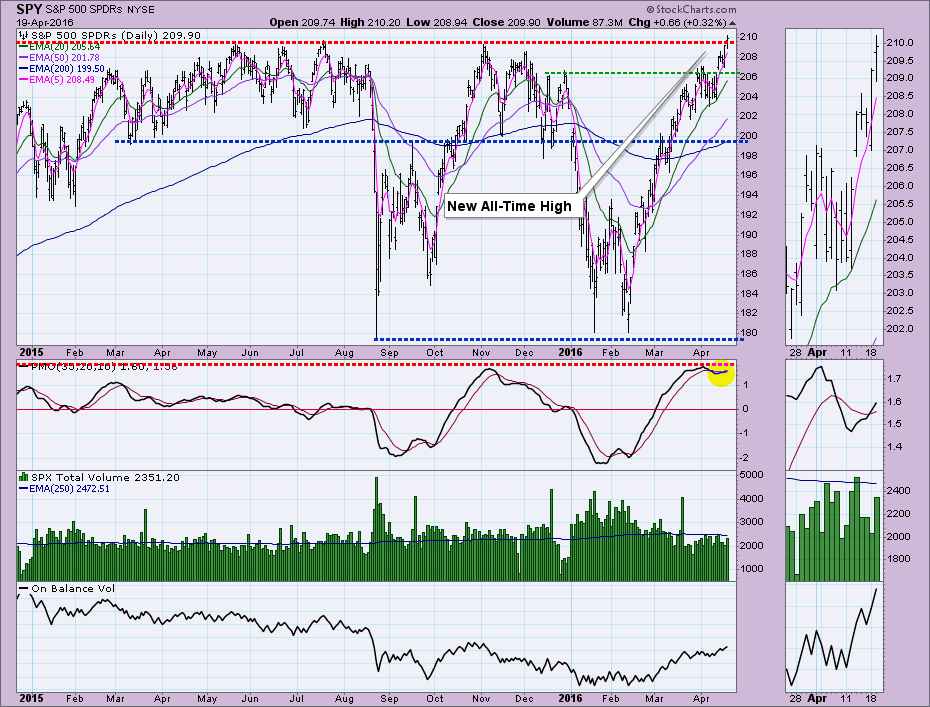
All-Time Highs Not Yet Being Tested on Scoreboard Indexes
by Erin Swenlin,
Vice President, DecisionPoint.com
The DecisionPoint Chart Galleries include not only the S&P 500, but for members, there are also the Nasdaq 100, S&P 100 and Dow Industrials Chart Galleries. Finding the Chart Galleries is easy, you'll find a link in the center line of the home page...
READ MORE
MEMBERS ONLY
S&P 100 Short-Term PMO BUY Signal - Too Late or Just in Time?
by Erin Swenlin,
Vice President, DecisionPoint.com
The Price Momentum Oscillator (PMO) is an excellent gauge of internal strength and of course, as the name implies, momentum. So a new PMO BUY signal should excite and motivate, right? Not quite. Looking at the daily chart and even better, the monthly chart will give you true long-term perspective....
READ MORE
MEMBERS ONLY
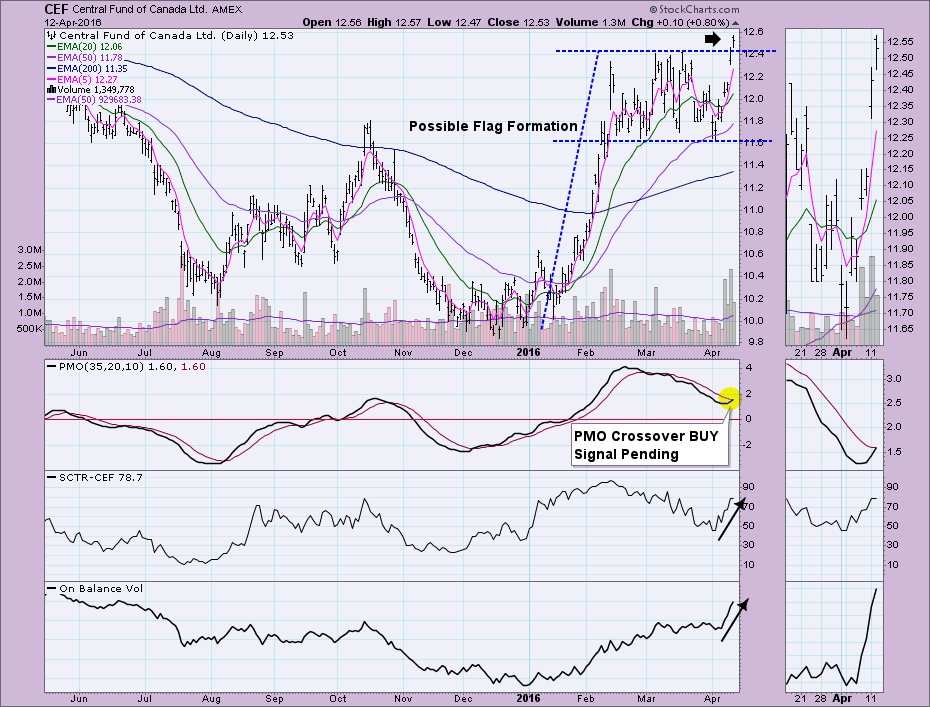
Beautiful Breakout on Central Fund of Canada (CEF)
by Erin Swenlin,
Vice President, DecisionPoint.com
Central Fund of Canada (CEF) is a closed-end fund that holds gold and silver bullion. I have been bullish on Gold (see the DecisionPoint Alert) so it wasn't a complete surprise when this ETF landed in the middle of my last Price Momentum Oscillator (PMO) scan. The bullishness...
READ MORE
MEMBERS ONLY
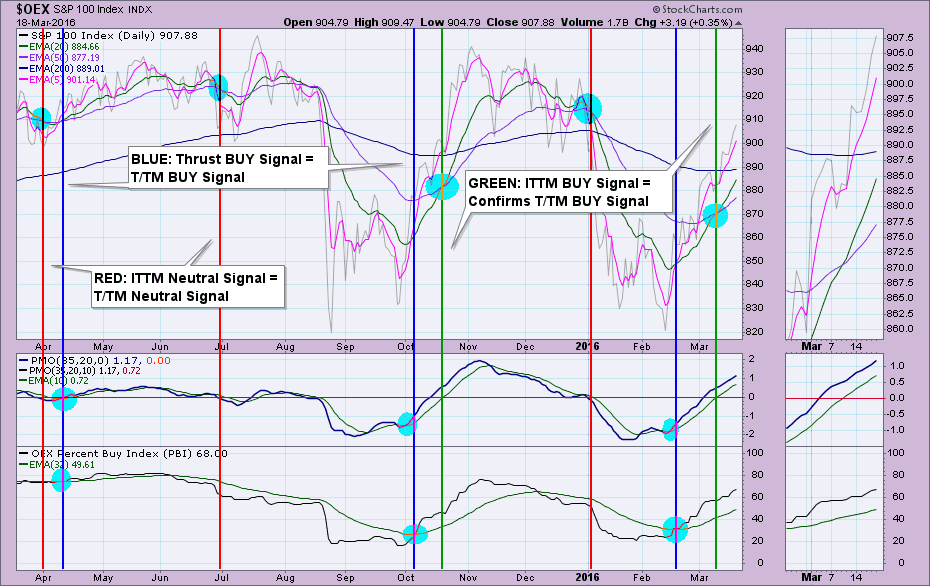
The DecisionPoint Thrust/Trend Model - Part III
by Erin Swenlin,
Vice President, DecisionPoint.com
In my previous two articles, I defined the components that make up the Thrust/Trend Model (T/TM). Now it is time to show you how those components generate the T/TM timing signals and how you can apply the T/TM to your analysis. If you haven't...
READ MORE
MEMBERS ONLY
The DecisionPoint Thrust/Trend Model - Part II
by Erin Swenlin,
Vice President, DecisionPoint.com
Welcome to Part II of Thrust/Trend Model (T/TM) education. In Part I, I discussed how the Intermediate-Term Trend Model (ITTM) and Long-Term Trend Model (LTTM) generate BUY/SELL and Neutral signals. The ITTM and LTTM make up the "Trend component" of the Thrust/Trend Model. The...
READ MORE
MEMBERS ONLY
The DecisionPoint Thrust/Trend Model - Part I
by Erin Swenlin,
Vice President, DecisionPoint.com
I'm going to give you jump on a ChartSchool article in the making on the DecisionPoint Thrust/Trend Model. Although Carl and I retired it from the DecisionPoint Market/Sector Summary, it is still available in the DecisionPoint Market Indicator ChartPack (free download!).
The Thrust/Trend Model is...
READ MORE
MEMBERS ONLY
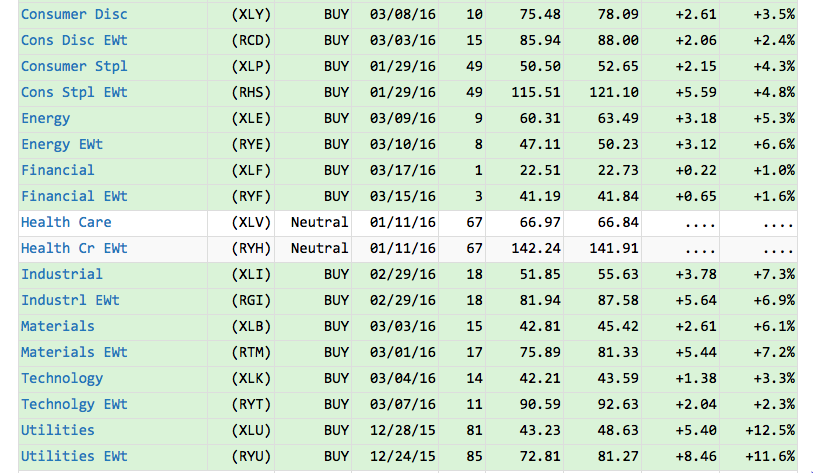
Healthcare Sector Not so Healthy
by Erin Swenlin,
Vice President, DecisionPoint.com
All of the sectors on the DecisionPoint Market Sector Summary are green with Intermediate-Term Trend Model BUY signals...except for Healthcare. As you can see from the excerpt of the report below, the current Neutral signal has been in effect for over two months. I decided it was time to...
READ MORE
MEMBERS ONLY
Bear Market PMO Scan Screens a Few "Dogs"
by Erin Swenlin,
Vice President, DecisionPoint.com
With the market overbought and ready for at least a pullback, I decided to run one of my bear market Price Momentum Oscillator (PMO) scans to see if I could find a few "dogs" out there. The scan produced a handful for review but the two below stood...
READ MORE
MEMBERS ONLY
Financial Sector Lagging - Review of Deutsche Bank (DB), Equal-Weight ETF (RYF) and SPDR (XLF)
by Erin Swenlin,
Vice President, DecisionPoint.com
A reader and viewer emailed me and asked me to take a look at Deutsche Bank (DB). While I normally don't do specific chart reviews as part of my blogs or webinars, today we received a new Intermediate-Term Trend Model (ITTM) BUY signal on the equal-weight Financial ETF...
READ MORE
MEMBERS ONLY
Dow Leads the Way with First Intermediate-Term PMO BUY Signal on DP Scoreboards
by Erin Swenlin,
Vice President, DecisionPoint.com
Short-term and Intermediate-Term Trend Model BUY signals began appearing on the DecisionPoint Scoreboards this week. I suggested in a previous ChartWatchers article that these signals would be the first indication that the bear market may be coming to a close. I also wrote that the next step would be to...
READ MORE
MEMBERS ONLY
New! Intermediate-Term Trend Model BUY Signal on Dow
by Erin Swenlin,
Vice President, DecisionPoint.com
The DecisionPoint Scoreboards had a big change today, probably the first of a few more. The new Intermediate-Term Trend Model BUY signal for the Dow Industrials isn't necessarily a buying opportunity. With the recent rally, price has been trading well above the 50-EMA so consequently, the 20-EMA was...
READ MORE
MEMBERS ONLY
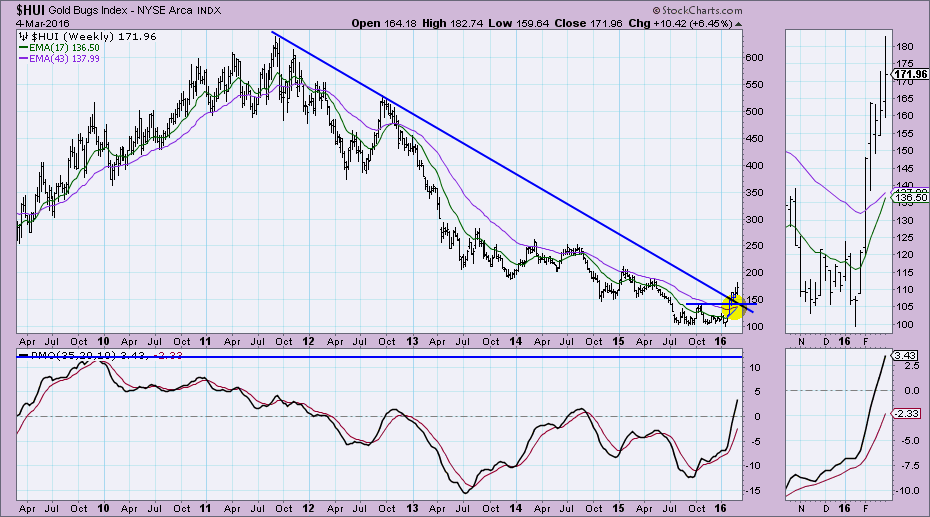
Gold Bugs ($HUI) Support Levels
by Erin Swenlin,
Vice President, DecisionPoint.com
I don't want to steal Carl's thunder as I happen to know he will be writing a follow-up article to his previous article on Gold. However, I did receive an email question to look at possible support levels on the Gold Bugs Index ($HUI). I'...
READ MORE
MEMBERS ONLY
What Do You Mean... "Fierce Overhead Resistance"?
by Erin Swenlin,
Vice President, DecisionPoint.com
I suspect a few eyebrows were raised when they saw the title to my DecisionPoint Alert blog article today, "Fierce Overhead Resistance Looming". Resistance lines, support lines and trend lines are usually considered stronger based on how many times price "touches" them. Intuitively this makes sense....
READ MORE
MEMBERS ONLY
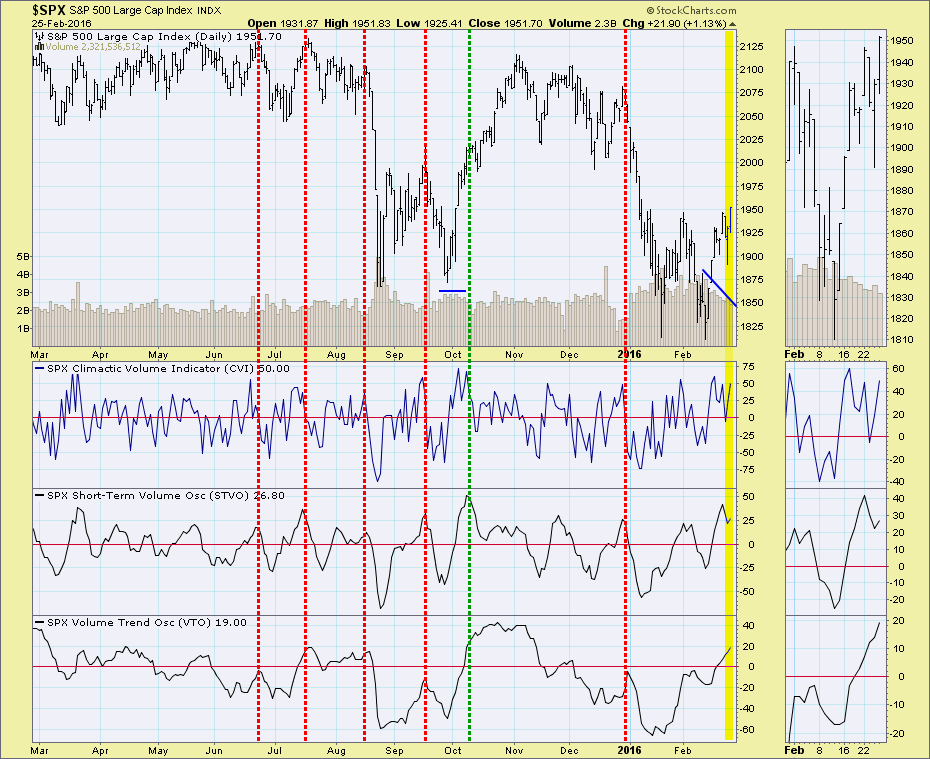
Are Indicators Lining Up for the Perfect Storm?
by Erin Swenlin,
Vice President, DecisionPoint.com
Indicators in all timeframes don't always coordinate with each other, but I believe they are beginning to meld right now. In the member's only DecisionPoint Alert blog, I cover all of these oscillators on separate charts based on the timeframe (i.e. short-term chart, intermediate-term chart,...
READ MORE
MEMBERS ONLY
Pain, No Gain
by Erin Swenlin,
Vice President, DecisionPoint.com
I recently was reading John Murphy's book, Technical Analysis of the Financial Markets (A MUST read and available in the StockCharts.com Store) and I found a VERY timely quote that I'd like to share:
Until 2000, we had a lot of people who were day-trading....
READ MORE
MEMBERS ONLY
Three Indications that a Bear Market is Ending
by Erin Swenlin,
Vice President, DecisionPoint.com
Many of my readers' and viewers' questions remind me of the Whitney Houston song, "How Will I Know?". With the DecisionPoint Scoreboards starting to move "green", it begs the question, "Is the market on its way back up?" I believe I answered...
READ MORE
MEMBERS ONLY
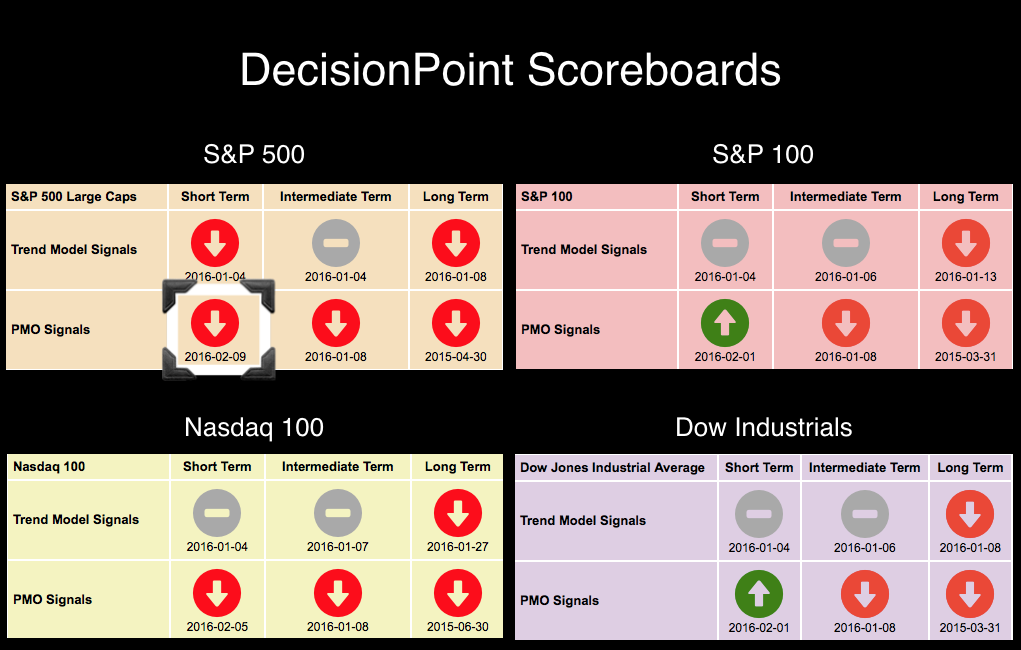
DecisionPoint Scoreboards are Turning Green--What Does it Mean?
by Erin Swenlin,
Vice President, DecisionPoint.com
Green means "go", right? Well in terms of the DecisionPoint Scoreboards, not necessarily. The DecisionPoint Scoreboards act as a "finger in the wind" or as we like to say, "windsock", to see which direction and speed markets are moving in right now. It'...
READ MORE
MEMBERS ONLY
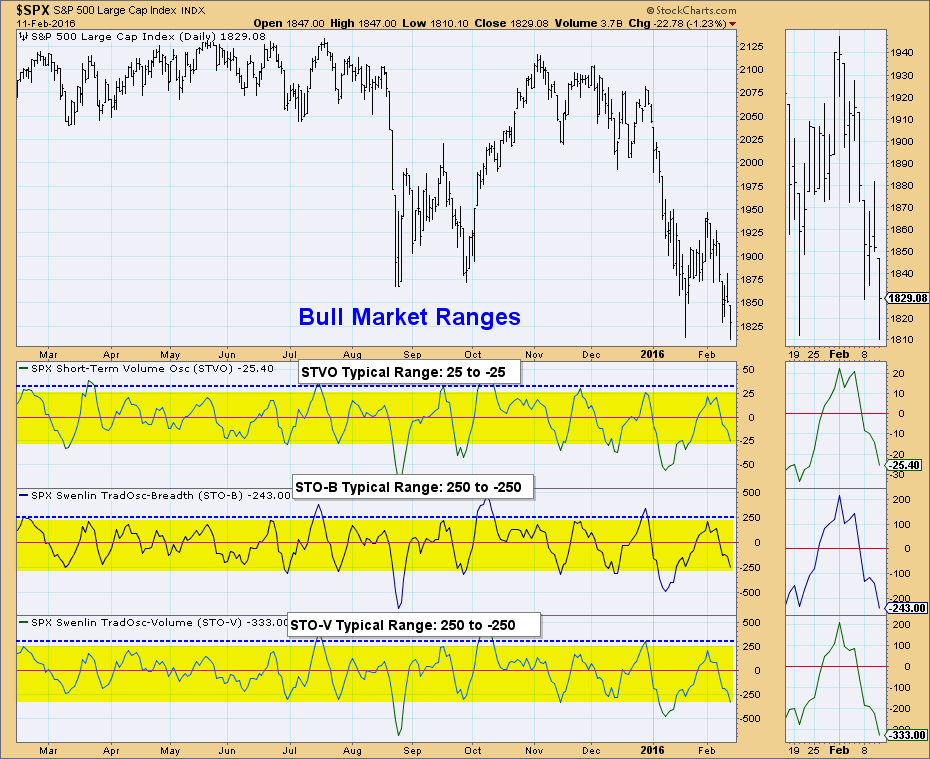
Bear Market Oscillator Ranges - Oversold Territory Expands
by Erin Swenlin,
Vice President, DecisionPoint.com
I think we can all agree that we are currently consumed in a bear market. If you remember the Bear Market Rules article I wrote last year, I discussed how our bullish expectations need to be tempered. Part of that is realizing that "oversold" in a bear market...
READ MORE
MEMBERS ONLY
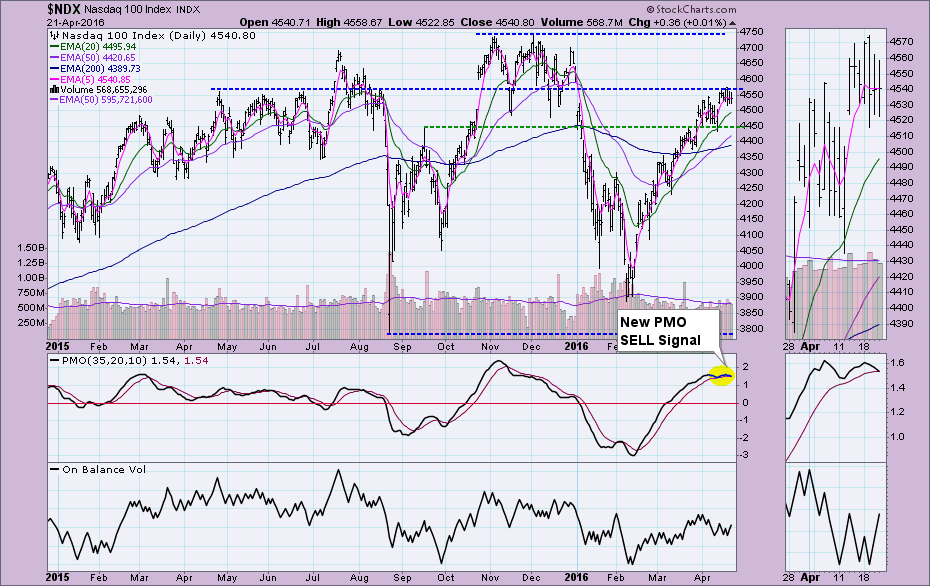
NDX Price Performance Comparisons - S&P 500 New PMO SELL Signal
by Erin Swenlin,
Vice President, DecisionPoint.com
The first hint that the bear market rally was exhausted was when the Nasdaq 100, which had been strongest during the bear market, switched before the other indexes to a PMO SELL signal. Today, the SPX lost its BUY signal and joined the NDX with a new Price Momentum Oscillator...
READ MORE
MEMBERS ONLY
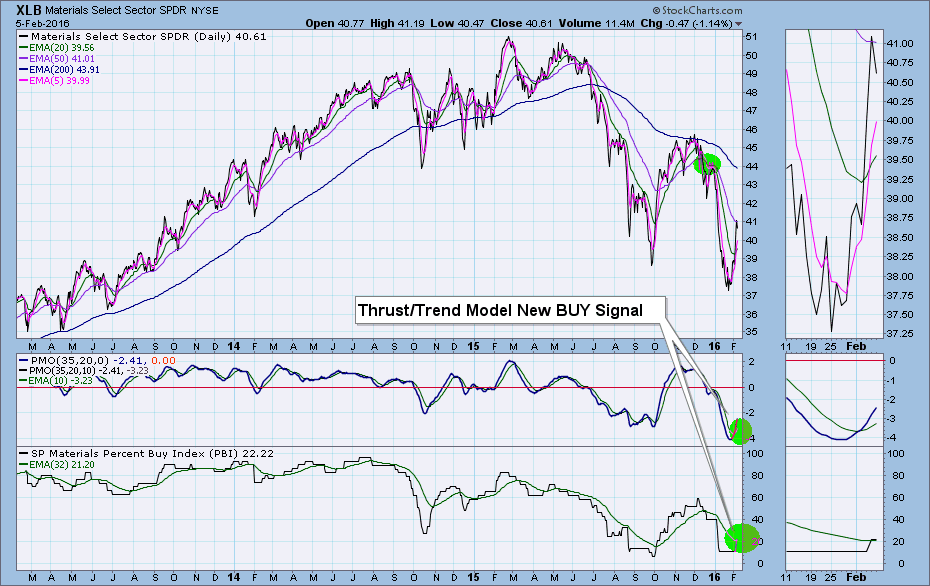
Materials SPDR (XLB) "Thrust" into BUY Signal
by Erin Swenlin,
Vice President, DecisionPoint.com
There has been renewed interest in the Percent Buy Index (PBI) ever since I spotlighted it during one of my webinars. The PBI is not related at all to the Bullish Percent Index (BPI). The PBI is Carl's creation, and it tracks the percentage of Price Momentum Model...
READ MORE
MEMBERS ONLY
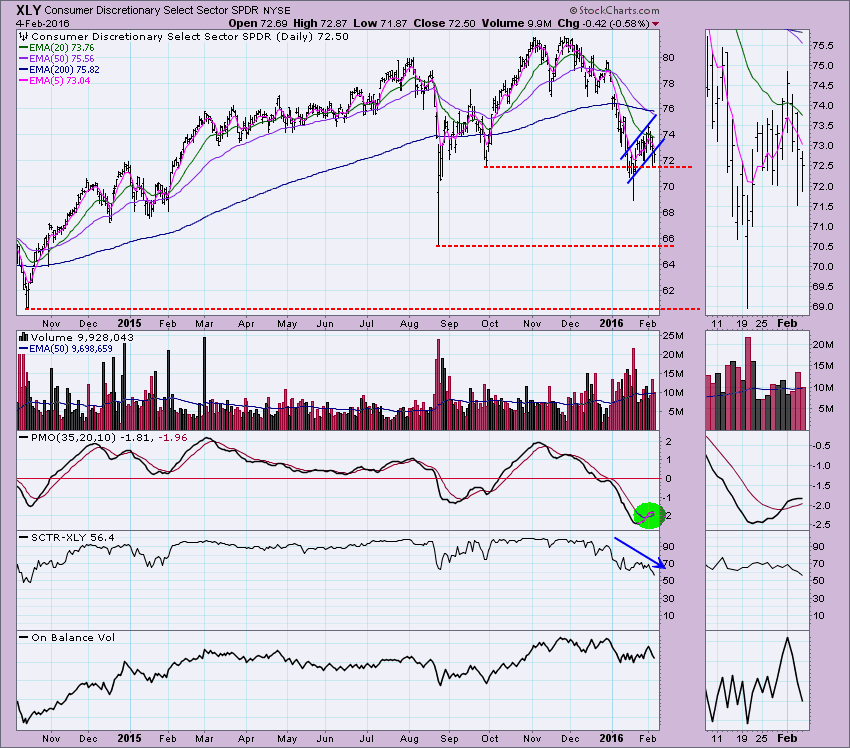
Kohls and Ralph Lauren Take Out Support
by Erin Swenlin,
Vice President, DecisionPoint.com
I generally do not review stocks in the DecisionPoint blog, but the Consumer Discretionary sector took a hit today, most notably Kohls Department Stores (KSS) and Ralph Lauren Polo brand (RL). These two stocks had the misfortune to miss their revenues by a great deal today. However, even had this...
READ MORE
MEMBERS ONLY
PMO BUY Signals Arrive on All Four Scoreboards
by Erin Swenlin,
Vice President, DecisionPoint.com
If you haven't reviewed the DecisionPoint Chart Gallery Scoreboards, you may want to. Yesterday, the short-term Price Momentum Oscillator (PMO) signals on all four Scoreboards for OEX, SPX, INDU and NDX switched to BUY signals.
These signals trigger on the daily chart when the PMO crosses above its...
READ MORE
MEMBERS ONLY
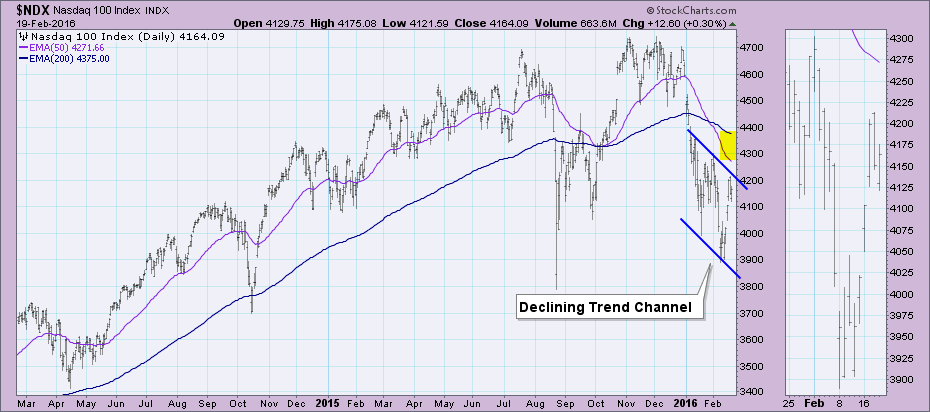
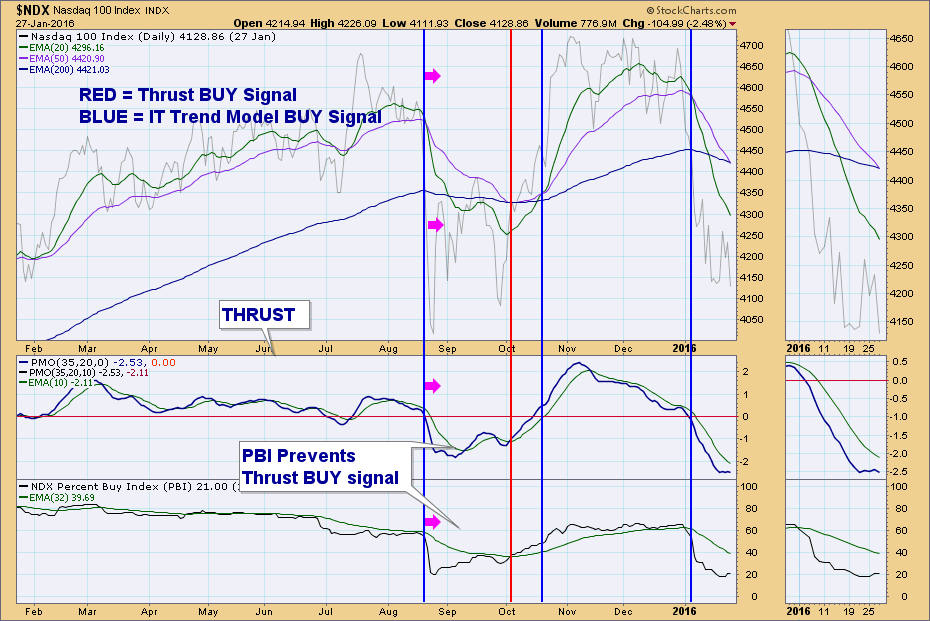
NDX Thrust/Trend Model Chart from 1-27-2016 Webinar
by Erin Swenlin,
Vice President, DecisionPoint.com
During yesterday's webinar, I stirred up some renewed interest in the DecisionPoint Thrust/Trend Model with a reader request for the model analyzed on the Nasdaq 100. I explained that using a "thrust" component with the DP Trend Model will often times get you an early...
READ MORE
MEMBERS ONLY
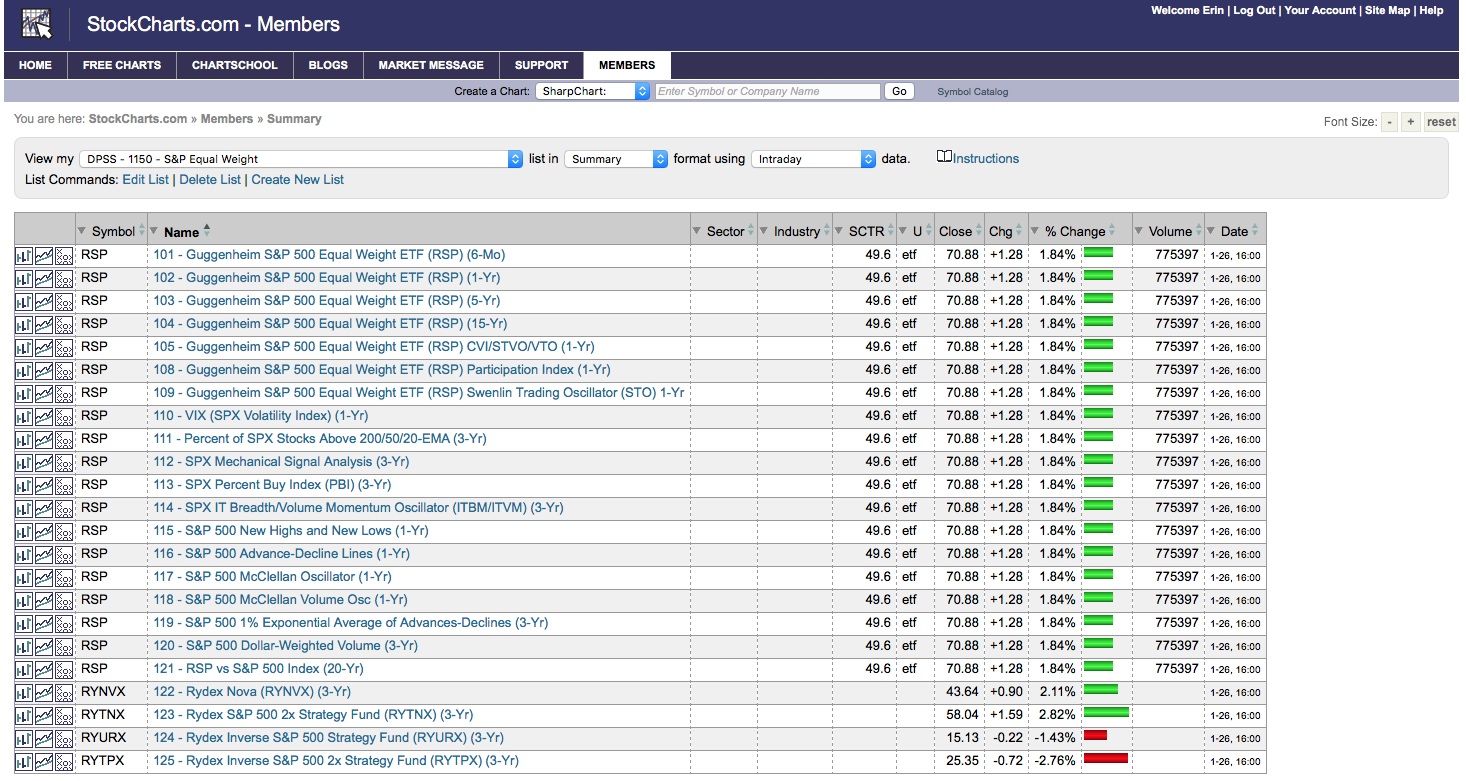
Reader Question on RSP (SPX Equal-Weight ETF)
by Erin Swenlin,
Vice President, DecisionPoint.com
I received a comment on one of my blog articles from a long-time follower, John Latta. Here's what he asked:
"Did you read Arthur's Monday blog? It would be very interesting if you would do an analysis of RSP, especially in view of the divergence...
READ MORE
MEMBERS ONLY
What Does a Neutral Signal Really Mean?
by Erin Swenlin,
Vice President, DecisionPoint.com
I'm asked frequently, especially now that we use the DecisionPoint Scoreboards, "What is a Neutral signal?" You'll see on the DecisionPoint Scoreboard for the S&P 500 (found in the DP Chart Gallery) that all sections are red except for the Intermediate-Term Trend...
READ MORE