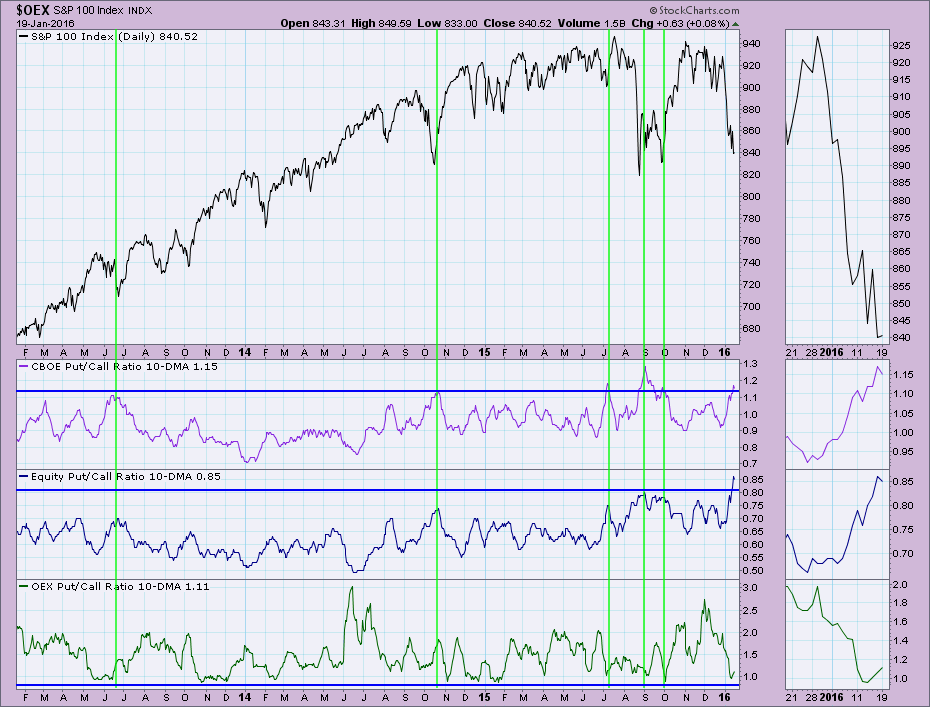
MEMBERS ONLY
Put/Call Ratio 10-DMA Bullish
by Erin Swenlin,
Vice President, DecisionPoint.com
DecisionPoint with StockCharts.com offer numerous ready-to-go indicators and charts. The easiest way to observe them is by downloading the DecisionPoint Market Indicators ChartPack. One of the ChartLists that I hadn't visited in some time was the DPMI - 1300 Put/Call Ratio, particularly the 10-DMA of the...
READ MORE
MEMBERS ONLY
Last Sectors Standing
by Erin Swenlin,
Vice President, DecisionPoint.com
If you go to our DP Reports blog and take a gander at the DecisionPoint Market/Sector Summary, you'll find there are only two sectors left with BUY signals. I'll give you a moment to guess which ones. Those of you familiar with John Murphy'...
READ MORE
MEMBERS ONLY
Evaluating Bullish Scan Results in a Bear Market
by Erin Swenlin,
Vice President, DecisionPoint.com
First, I am not encouraging anyone to buy stocks in a bear market. If you are evaluating investments in a bear market, you do need to keep a few things in mind. In a bear market the majority of stocks are in decline (hence it being a bear market). Check...
READ MORE
MEMBERS ONLY
Oversold Indicators in a Bear Market
by Erin Swenlin,
Vice President, DecisionPoint.com
The S&P 500 entered a Long-Term Trend Model SELL signal last Friday. This occurred when the 50-EMA crossed below the 200-EMA. One issue that I noticed while preparing for one of my webinars is that not only are short-term indicators very oversold, but intermediate-term indicators are very oversold...
READ MORE
MEMBERS ONLY
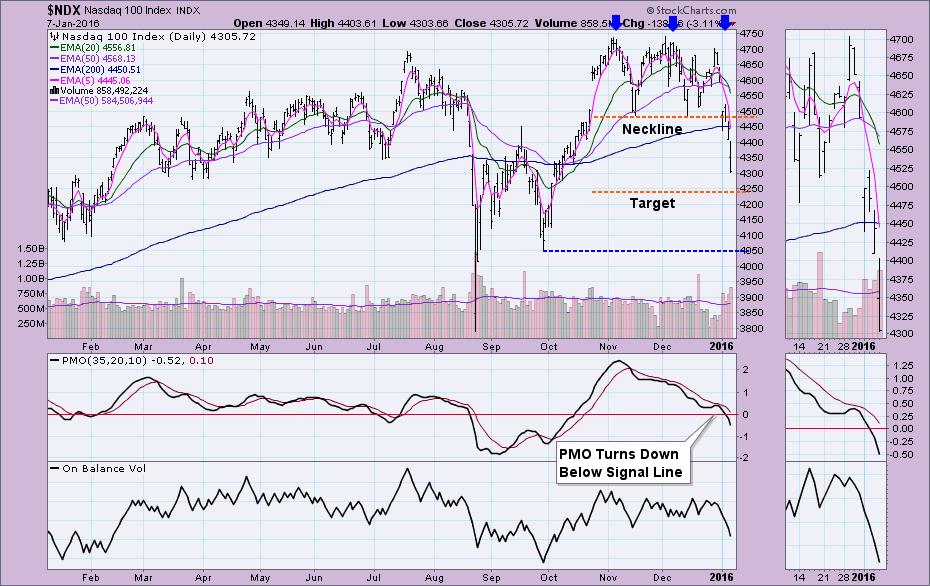
Nasdaq 100 and Techs Capitulate
by Erin Swenlin,
Vice President, DecisionPoint.com
The Nasdaq 100 (NDX) and technology stocks in general have avoided serious damage through the past year. The corrective move on the NDX in August never caused a 50/200-EMA negative crossover, meaning it avoided the DecisionPoint "bear market" label. This last corrective move, however, was very damaging....
READ MORE
MEMBERS ONLY
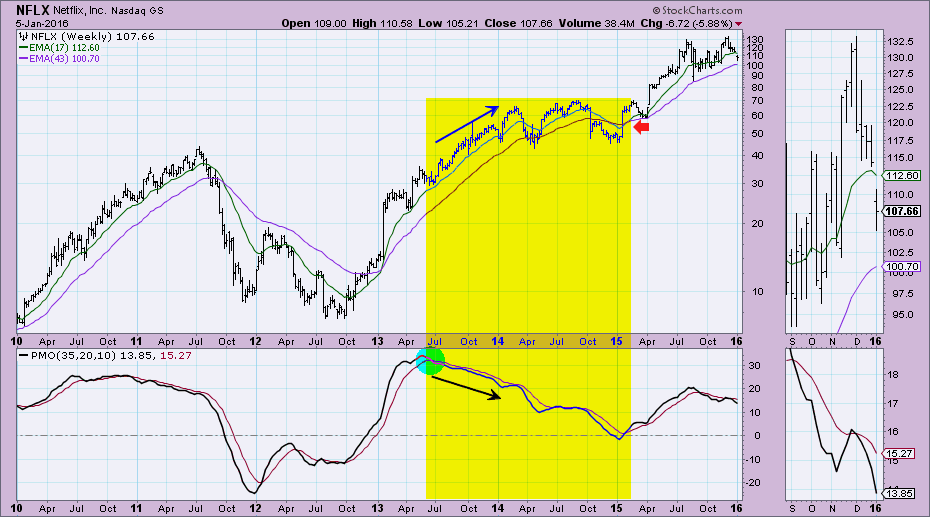
Weekly PMO Question on Netflix (NFLX)
by Erin Swenlin,
Vice President, DecisionPoint.com
My favorite part of my webinars is the "Question of the Day". I welcome emails and comments from my readers as you challenge me to think outside of the box or clarify my analysis. So here is today's question from Bryant regarding the weekly Price Momentum...
READ MORE
MEMBERS ONLY
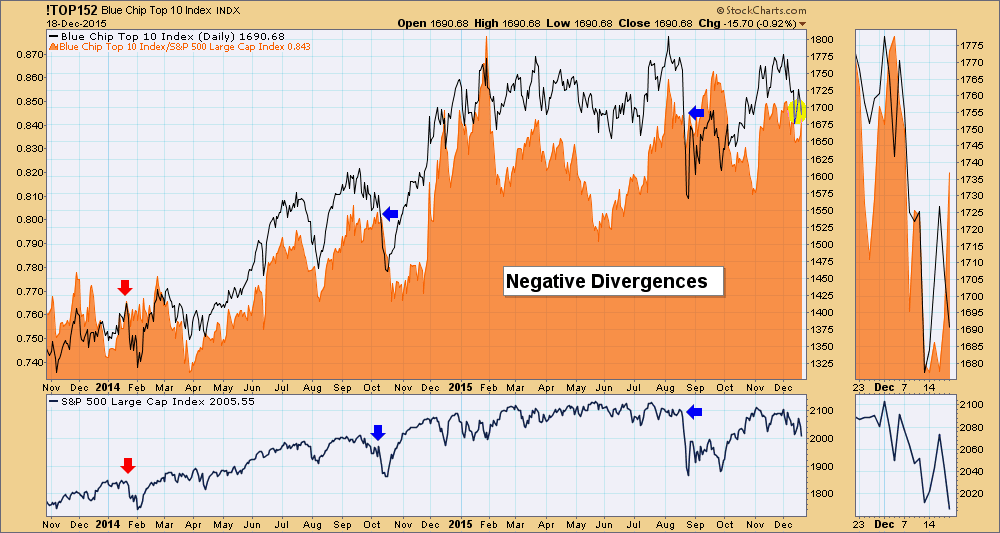
"Blue Chip Top 10" Negative Divergence
by Erin Swenlin,
Vice President, DecisionPoint.com
In the late-1990s Carl developed the Blue Chip Top 10 Index (!TOP152), which tracked the top ten ranked stocks (by PMO value) from our Blue Chip list of 152 stocks that DecisionPoint covers in its reports in the DecisionPoint Reports blog. The Top 10 Index is calculated daily based upon...
READ MORE
MEMBERS ONLY
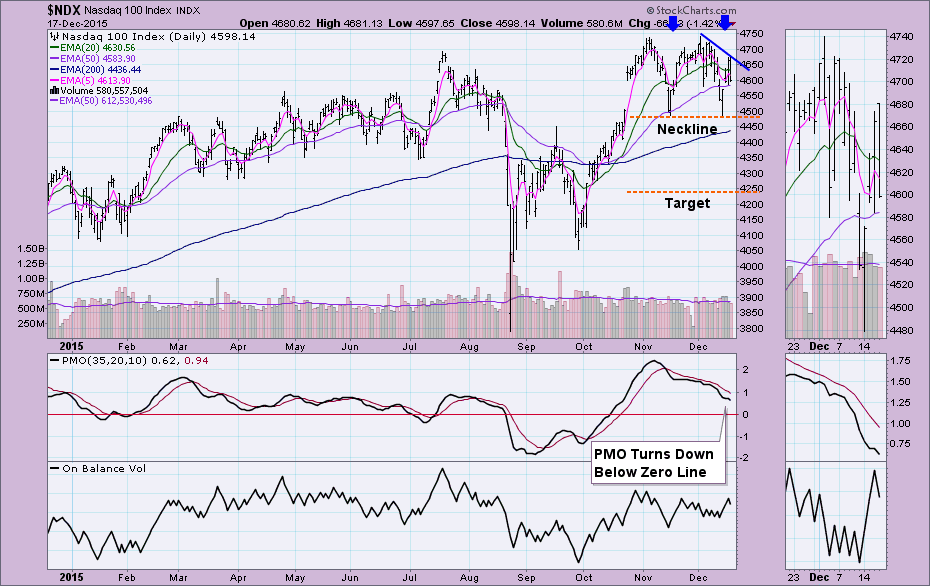
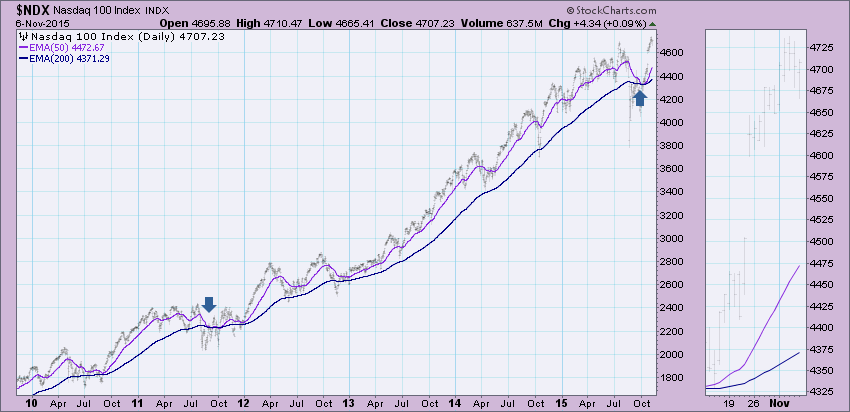
Nasdaq 100 Losing Potency
by Erin Swenlin,
Vice President, DecisionPoint.com
The Nasdaq 100 has been a superstar since the August low; price even managed to reach new all-time intraday highs. The saying goes the bigger they are, the harder they fall. Well, let's review the price chart and indicators specifically for the NDX. You can find these in...
READ MORE
MEMBERS ONLY
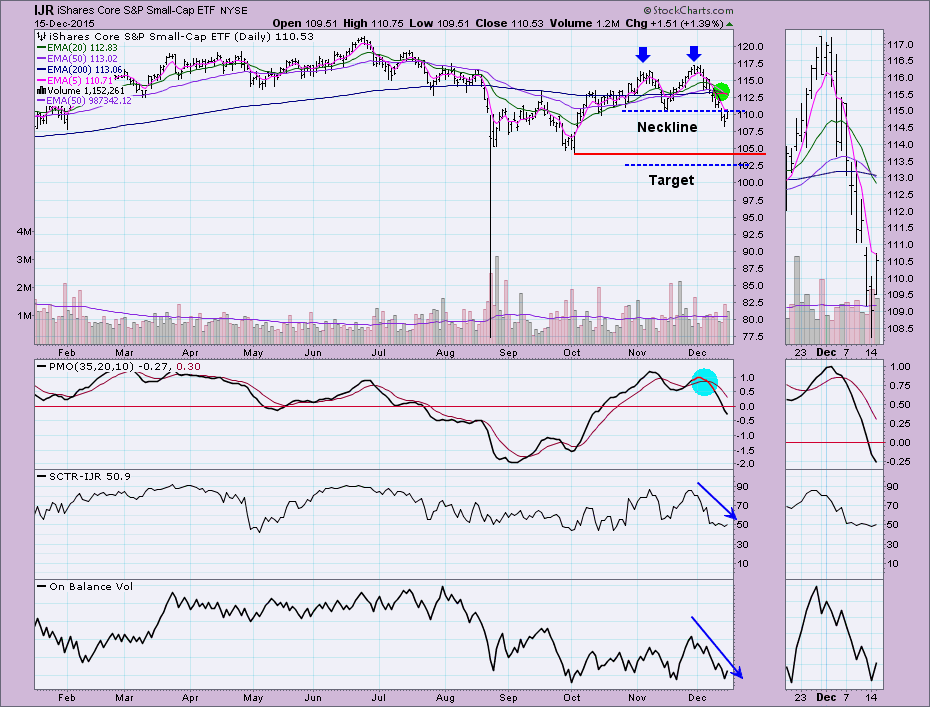
S&P 600 ETF (IJR) Moves to Official Bear Market
by Erin Swenlin,
Vice President, DecisionPoint.com
Despite today's rally, the S&P 600 ETF (IJR) logged a new Long-Term Trend Model SELL signal. This moves IJR officially into a bear market. The Long-Term Trend Model generates a SELL signal when the 50-EMA crosses below the 200-EMA. DecisionPoint Analysis considers any stock, index, ETF,...
READ MORE
MEMBERS ONLY
My Early Holiday Gift to You!
by Erin Swenlin,
Vice President, DecisionPoint.com
If you don't think you have time to read blogs, I issue you a challenge: Read the members-only DecisionPoint Alert blog each day for one week. You can do this for free even if you aren't currently a paid member using the free 10-day trial or...
READ MORE
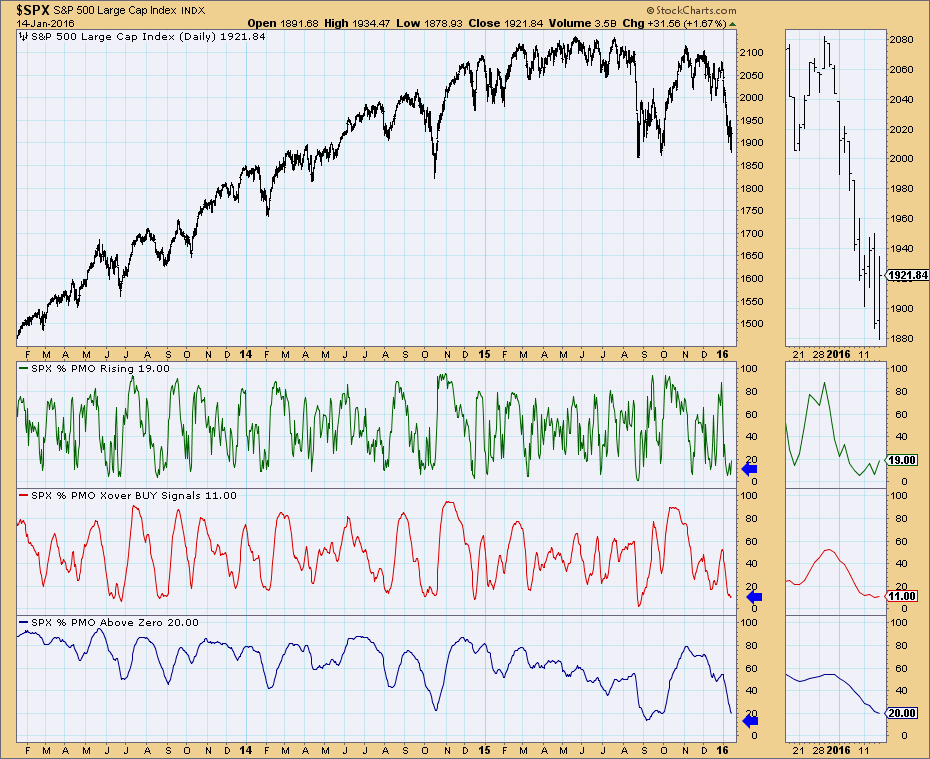
MEMBERS ONLY
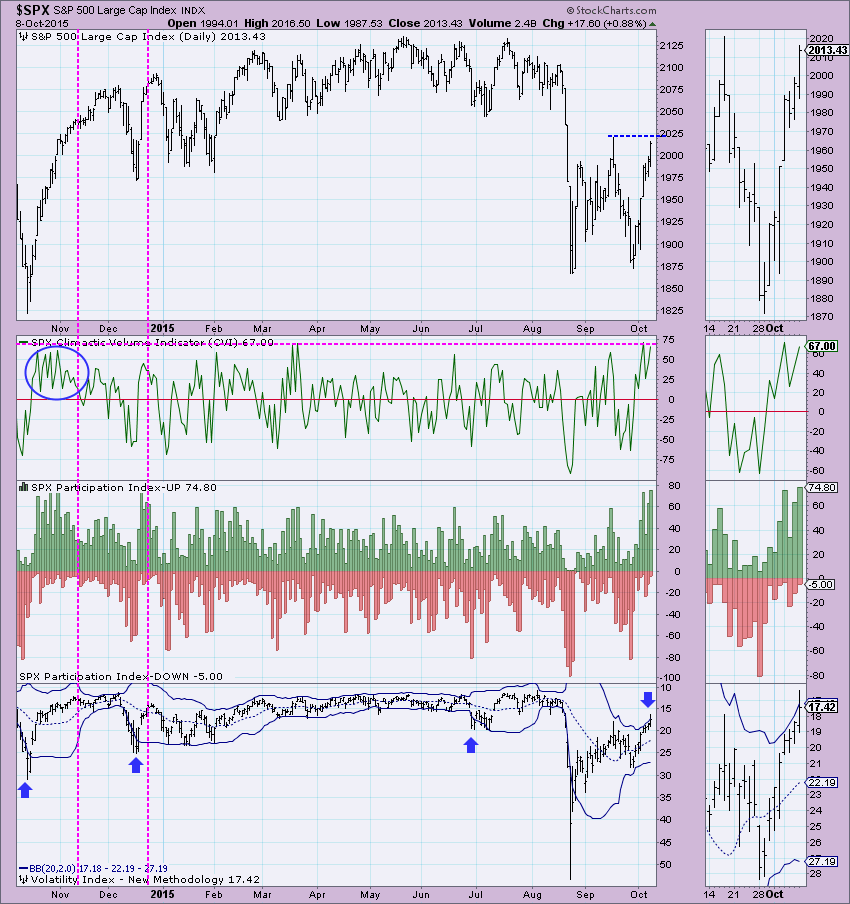
Price Momentum Oscillator (PMO) Analysis Reveals Market Weakness
by Erin Swenlin,
Vice President, DecisionPoint.com
On October 29th this year, I wrote a similar article to today's about the significance of lack of market participation in the rally out of lows. I decided it was a great time to revisit these charts based on the current decline and to trace what happened after...
READ MORE
MEMBERS ONLY
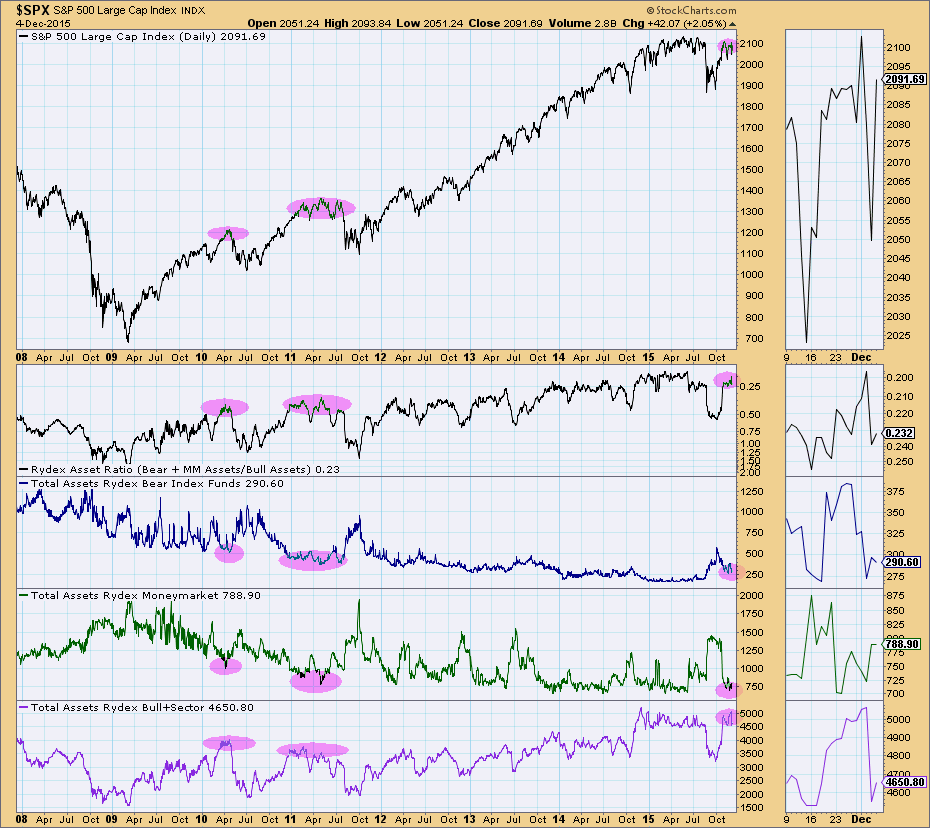
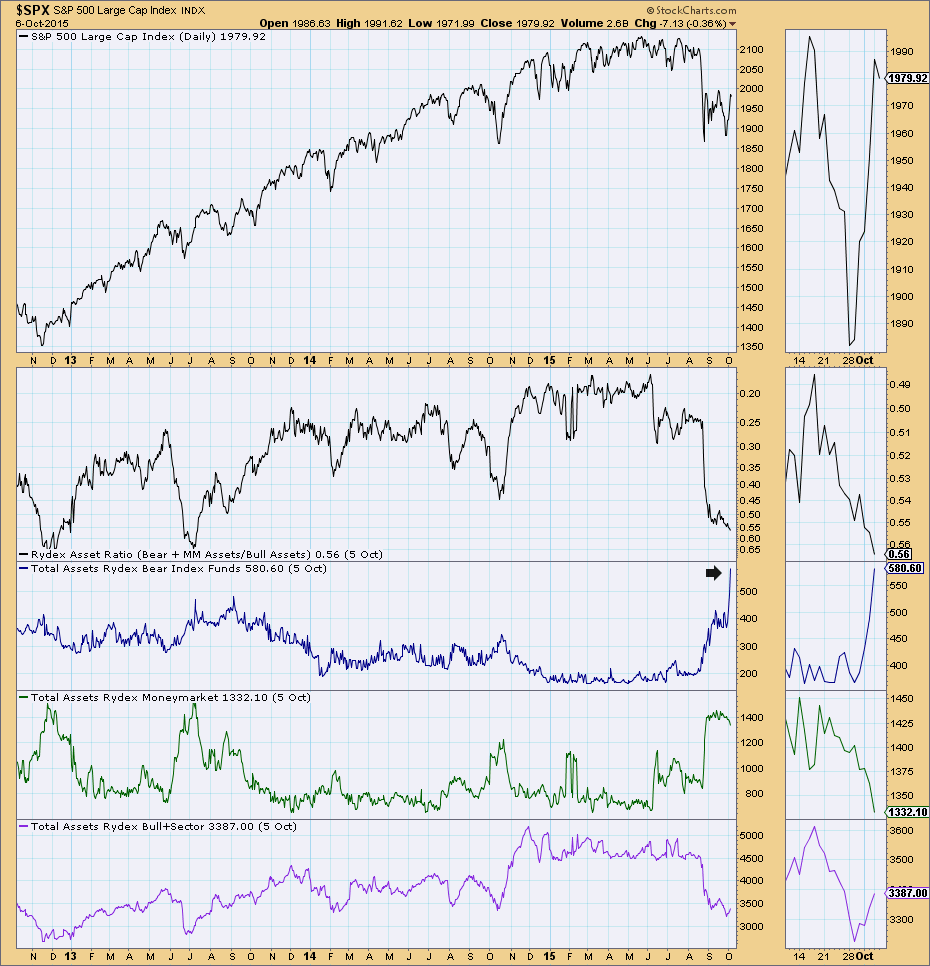
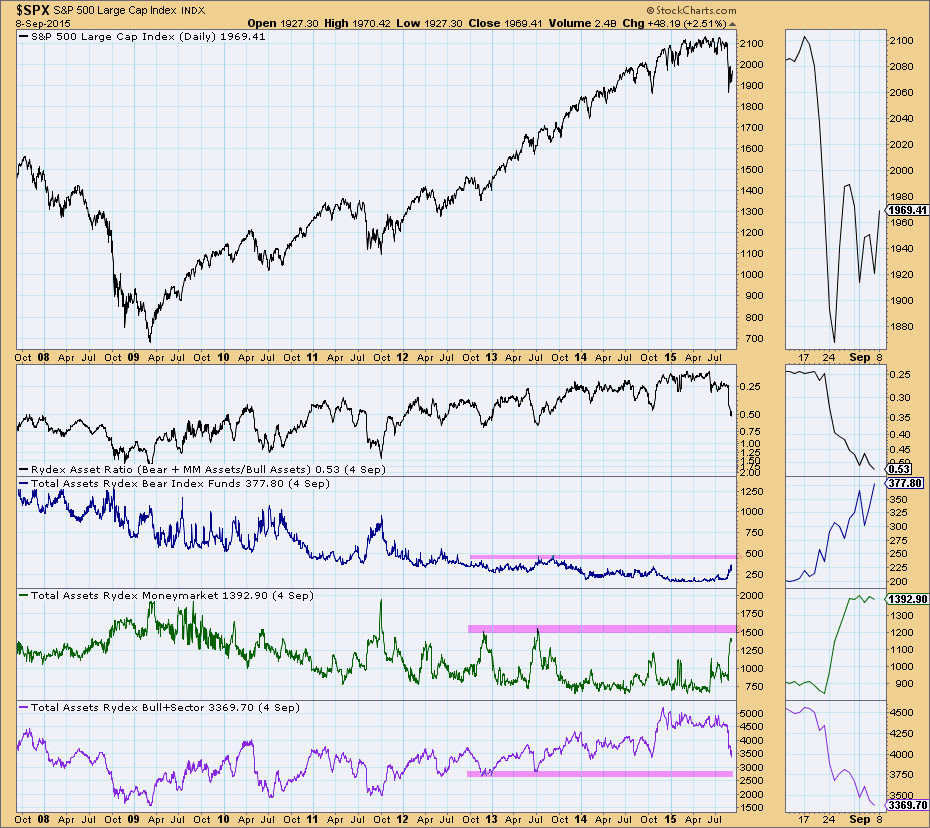
Rydex Assets Sentiment Suggests Topping Market
by Erin Swenlin,
Vice President, DecisionPoint.com
After the tug-o-war of the last two trading days, I decided it was time to look at sentiment based on the DecisionPoint Rydex Assets Analysis charts. There are two to look at and they are both available in the free DecisionPoint Rydex Funds ChartPack. You'll also find cashflow...
READ MORE
MEMBERS ONLY
Double-Tops Abound - Will They Pan Out?
by Erin Swenlin,
Vice President, DecisionPoint.com
I purposely have not mentioned the possible double-top formation on the SPY in the DecisionPoint Alert and in my webinars on Wednesdays and Fridays. I felt it was too early and indicators weren't looking bearish enough to discuss not only a drop to the "neckline" but...
READ MORE
MEMBERS ONLY
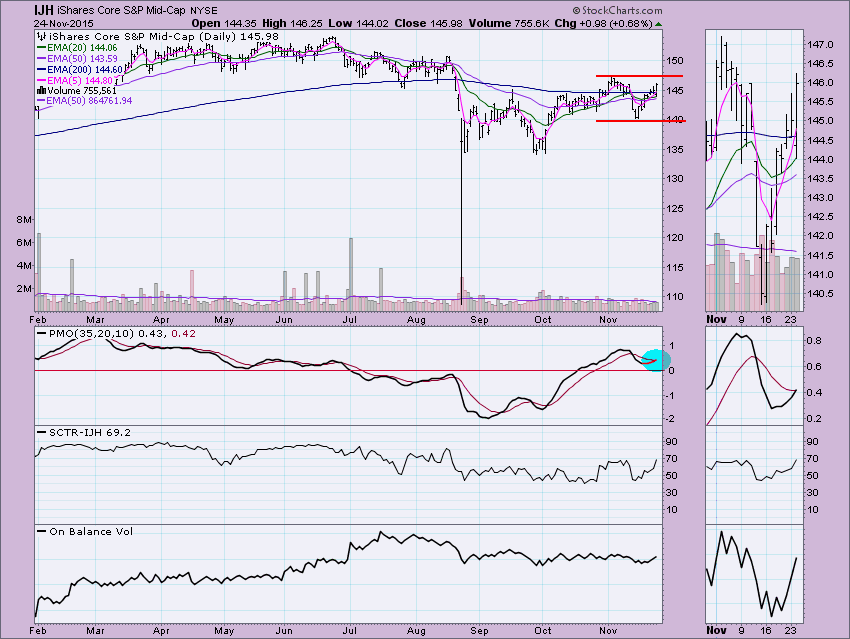
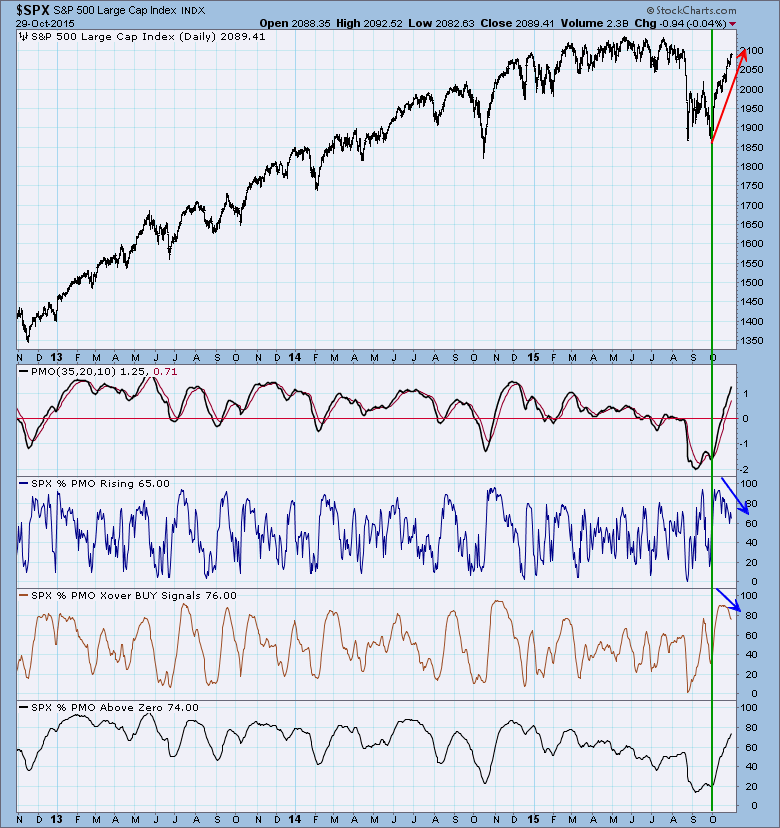
Mid-Caps and Small-Caps Trigger PMO Crossover BUY Signals
by Erin Swenlin,
Vice President, DecisionPoint.com
Interestingly, small- and mid caps received Price Momentum Oscillator (PMO) crossover BUY signals before the large cap indexes. In last weekend's ChartWatchers article I pointed out how all of the major indexes had little to no momentum during this rally. The PMO readings had been flat throughout the...
READ MORE
MEMBERS ONLY
Where Did Momentum Go? Nowhere.
by Erin Swenlin,
Vice President, DecisionPoint.com
The most recent bounce/rally was impressive, pushing prices toward overhead resistance at the November high or even to all-time highs. The problem is that during that rally, the Price Momentum Oscillator (PMO) didn't react. It did turn negative momentum to "positive" but barely. Take a...
READ MORE
MEMBERS ONLY
Waiting on the Short-Term Indicators
by Erin Swenlin,
Vice President, DecisionPoint.com
After the recent bounce off of the September high for the SPY, its short-term indicators finally began to move out of oversold territory. They are only neutral now. I'm looking for these indicators to move into overbought territory. Somewhat overbought territory is fine as this rally appears to...
READ MORE
MEMBERS ONLY
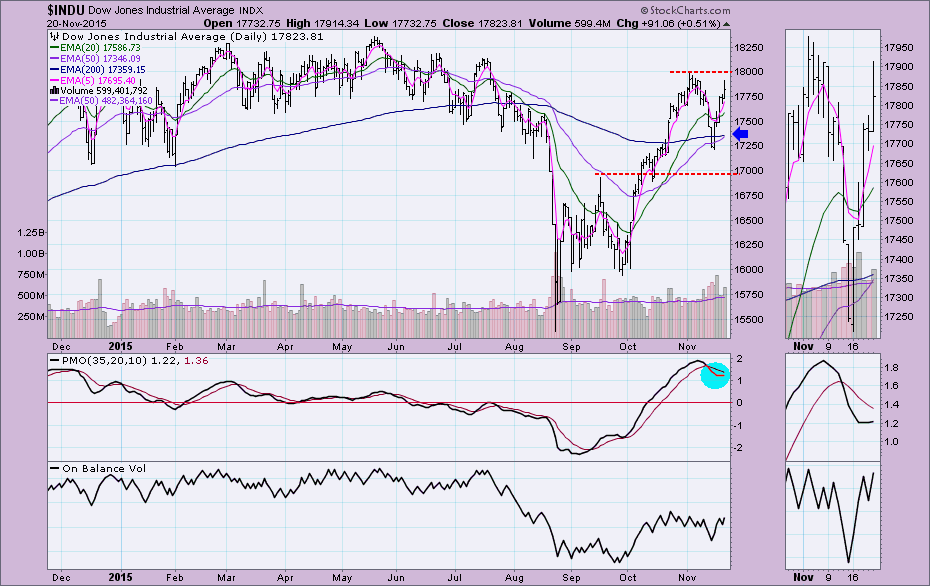
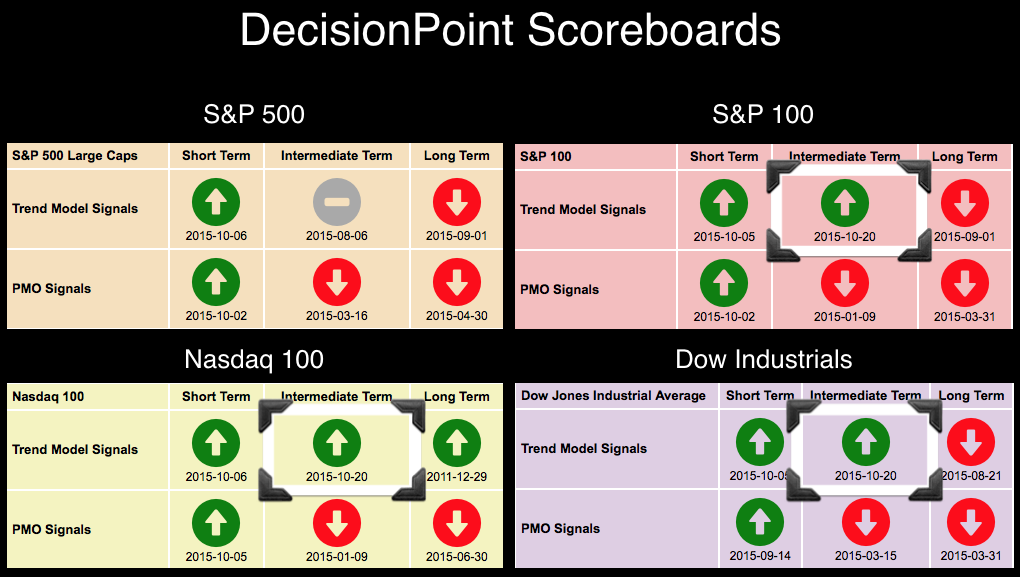
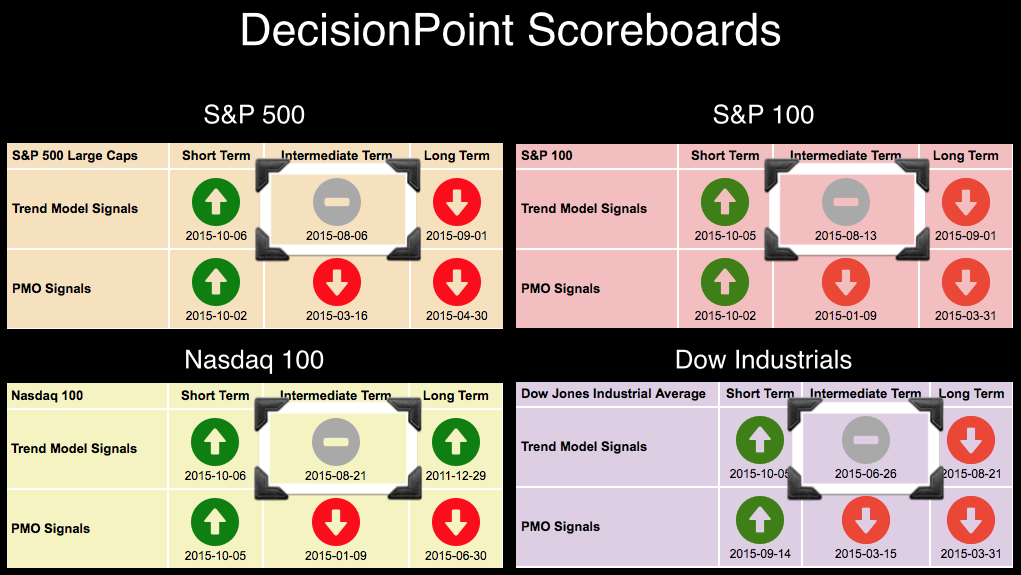
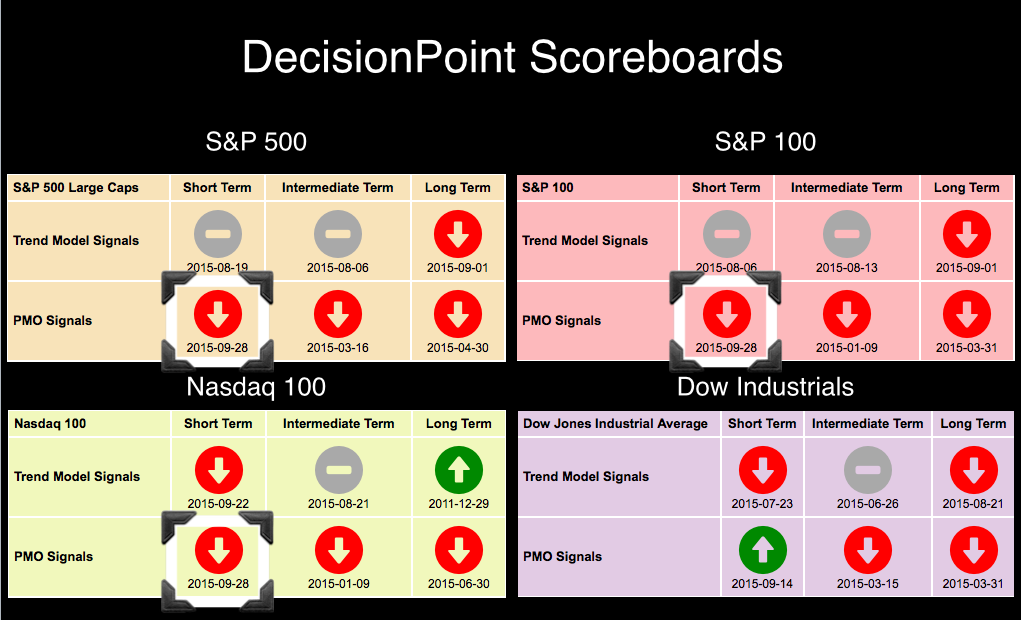
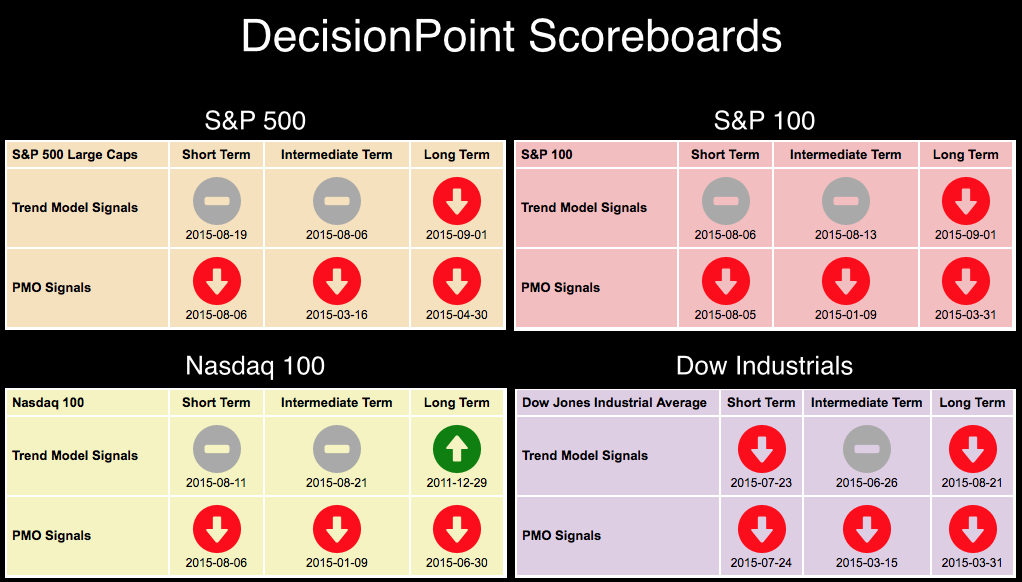
FOUR NEW Short-Term PMO SELL Signals on DP Scoreboards!
by Erin Swenlin,
Vice President, DecisionPoint.com
Today the DecisionPoint Scoreboards from our DecisionPoint Chart Gallery lit up with four new Short-Term Price Momentum Oscillator (PMO) SELL signals. I don't think any of us are too surprised (especially those who attended my webinar yesterday!) that so many PMO crossovers occurred on the major indexes. The...
READ MORE
MEMBERS ONLY
Top Four DecisionPoint Charts to Watch
by Erin Swenlin,
Vice President, DecisionPoint.com
I am repeatedly asked what are the most important DecisionPoint charts to watch for determining trend reversals or how to use the DecisionPoint indicators for confirmations. I'll preface this article by reminding everyone that all indicators and trend following models have limitations, but the charts below are the...
READ MORE
MEMBERS ONLY
Bear Markets Turning Into Bull Markets
by Erin Swenlin,
Vice President, DecisionPoint.com
Let me preface this article by defining bull and bear markets according to DecisionPoint. DecisionPoint considers 50/200-EMA crossovers the distinguishing factor between a bull market and bear market. These crossovers are what determine the Long-Term Trend Model signals. We have two of the major indexes covered in the DP...
READ MORE
MEMBERS ONLY
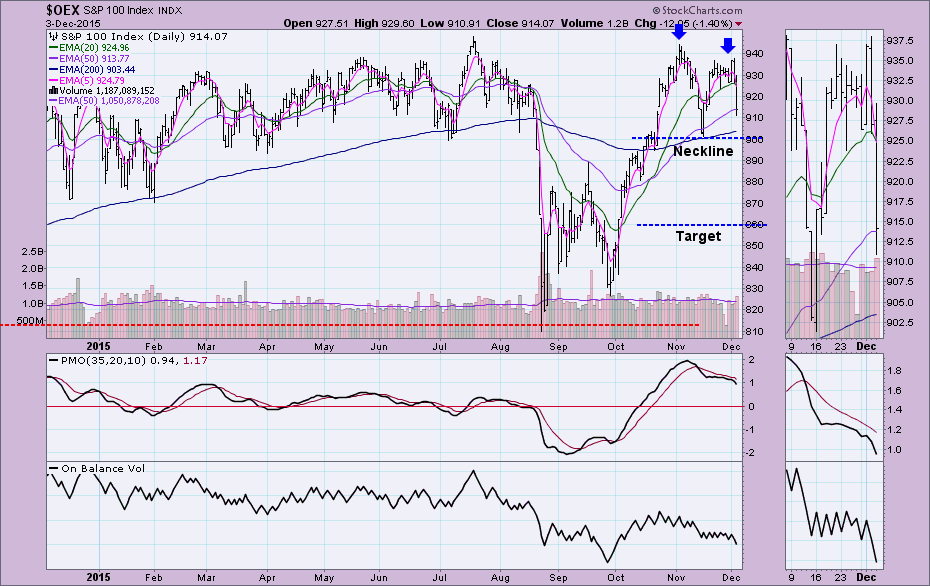
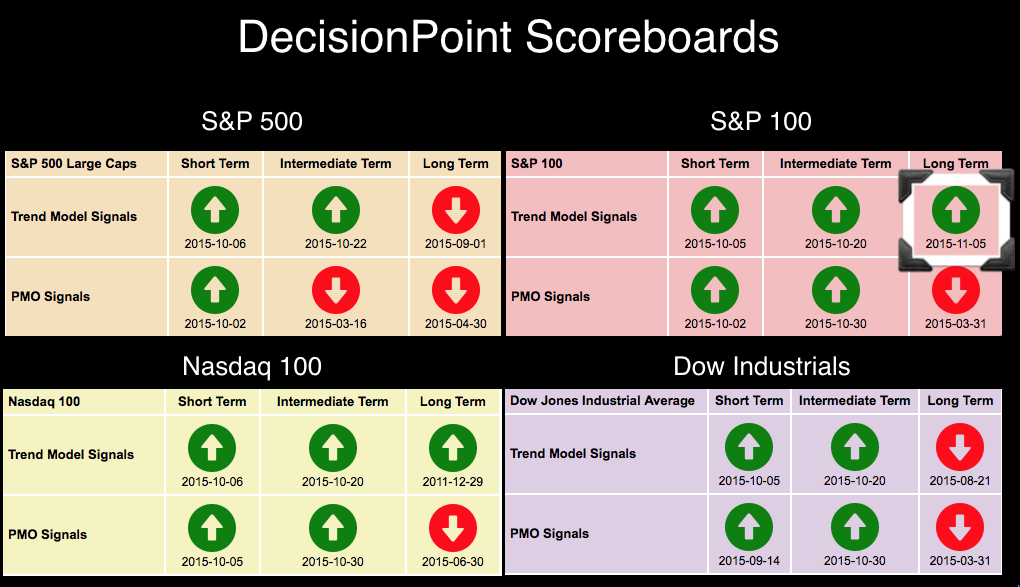
S&P 100 Produces New Long-Term BUY Signal
by Erin Swenlin,
Vice President, DecisionPoint.com
The DecisionPoint Scoreboard Summary below had an important change today. The S&P 100 (OEX) just received a new Long-Term Trend Model BUY signal. This signal generated when the 50-EMA crossed back above the 200-EMA.
This signal is very important as it moves the OEX from a "bear...
READ MORE
MEMBERS ONLY
SPY Shifts Gears - LTTM BUY Implies New Bull Market Phase
by Erin Swenlin,
Vice President, DecisionPoint.com
Many of you have been watching the DP Scoreboards in the DecisionPoint Chart Gallery (SPX, OEX, NDX and Dow). Today, the Long-Term Trend Model moved to a BUY signal on the SPY. The 50-EMA crossed above the 200-EMA, moving it from a bear market environment back into a bull market...
READ MORE
MEMBERS ONLY
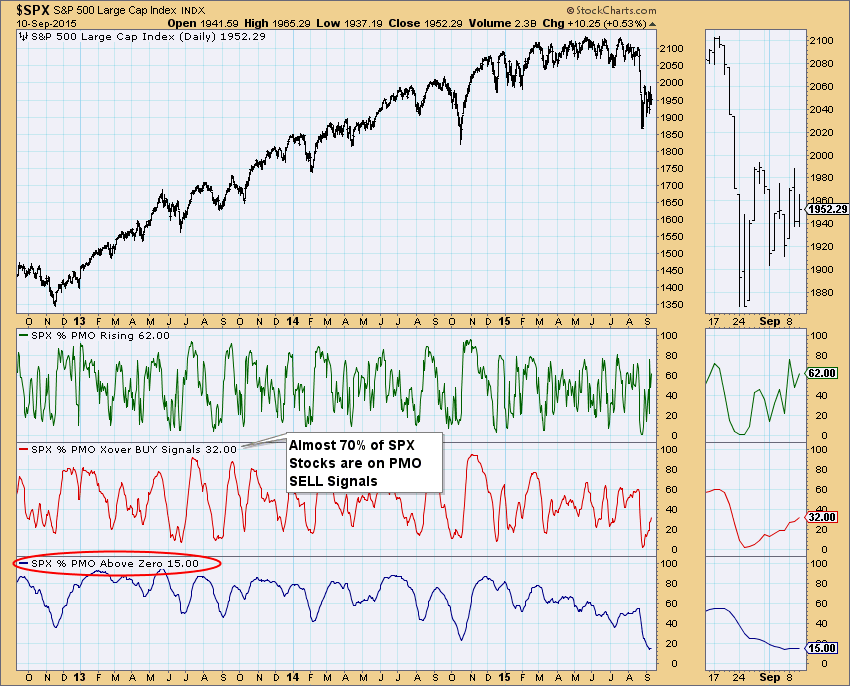
PMO Analysis Charts Reveal Interesting Divergences
by Erin Swenlin,
Vice President, DecisionPoint.com
While scanning my charts for my DecisionPoint Alert daily market review, I happened on the S&P 500 Price Momentum Oscillator (PMO) Analysis chart. It didn't look as I would've expected. This prompted me to review the same PMO Analysis charts for other indexes to...
READ MORE
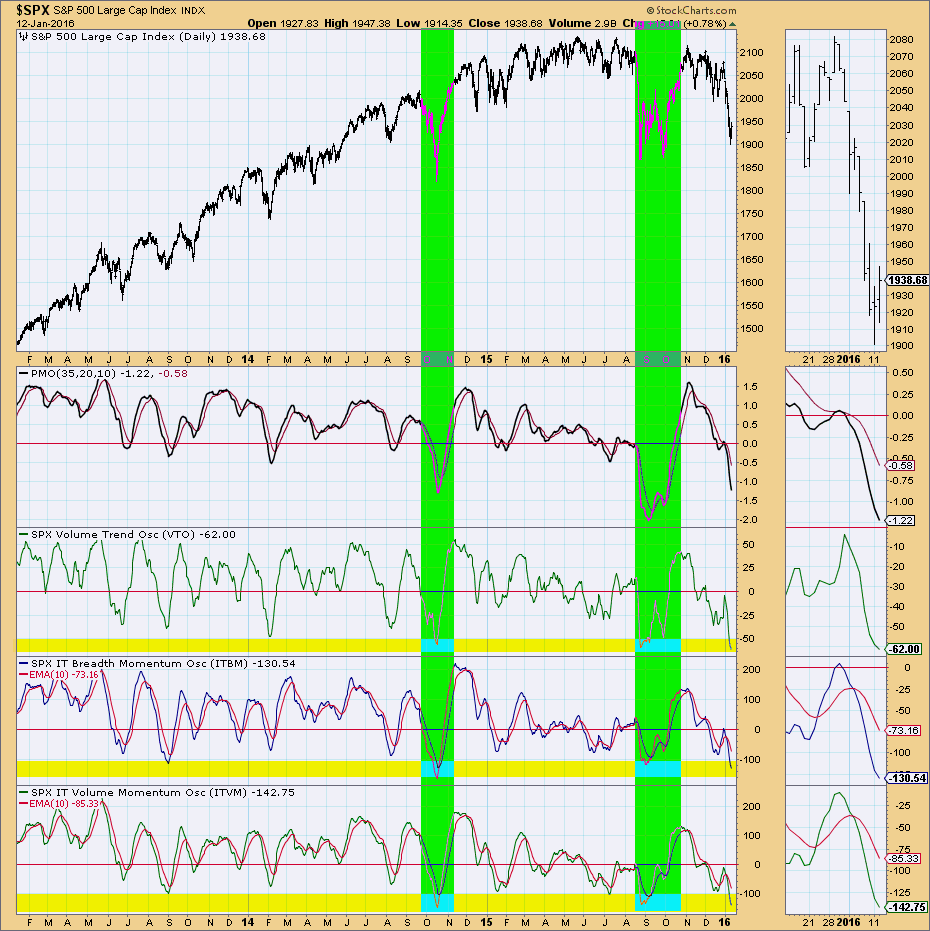
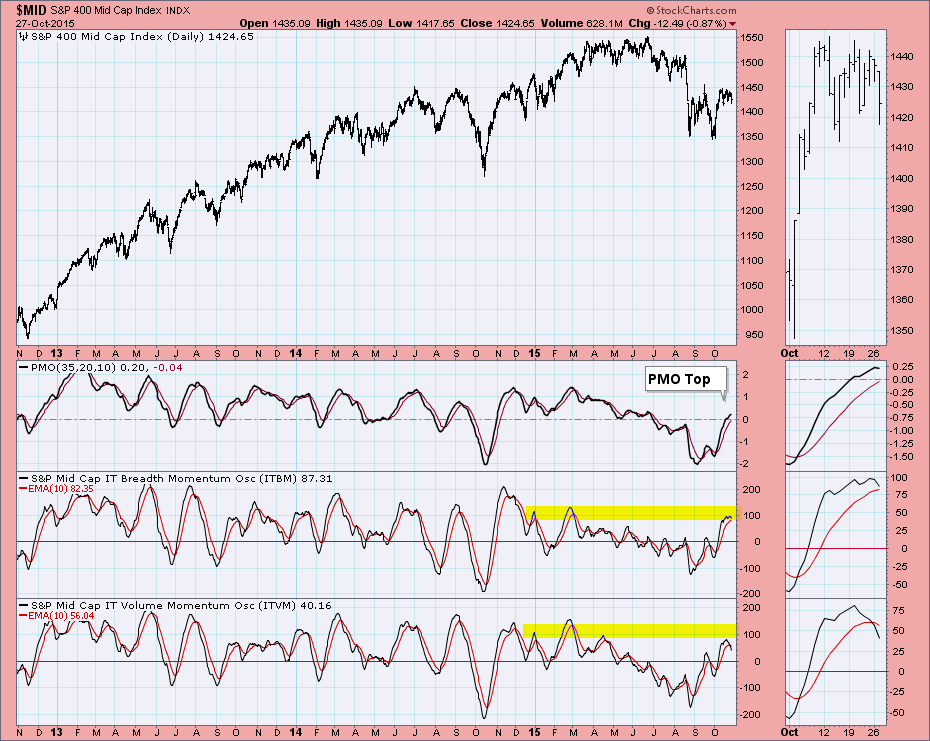
MEMBERS ONLY
IT Indicators on Small and Mid Caps Not Pretty
by Erin Swenlin,
Vice President, DecisionPoint.com
Last week I wrote my blog article about small and mid cap stocks not participating in the recent rally which is a sign of instability in the market as a whole. A review of the daily price charts in that blog article for the S&P 400, S&...
READ MORE
MEMBERS ONLY
Small Caps and Mid Caps Not on Board
by Erin Swenlin,
Vice President, DecisionPoint.com
It was pointed out to me that small- and mid-cap stocks were not participating in the recent rally in comparison to the major indexes on our DP Scoreboards that I've recently covered in previous blogs. I called up three charts, the S&P 400, S&P...
READ MORE
MEMBERS ONLY
New! $NDX, $OEX and $INDU Intermediate-Term Trend Model BUY Signals
by Erin Swenlin,
Vice President, DecisionPoint.com
The bear market rally has now extended to Intermediate-Term Trend Model BUY signals. You'll see in the DP Scoreboards below that the Nasdaq 100, S&P 100 and Dow flipped to BUYs. Don't belittle the S&P 500 for staying Neutral, it is hundredths...
READ MORE
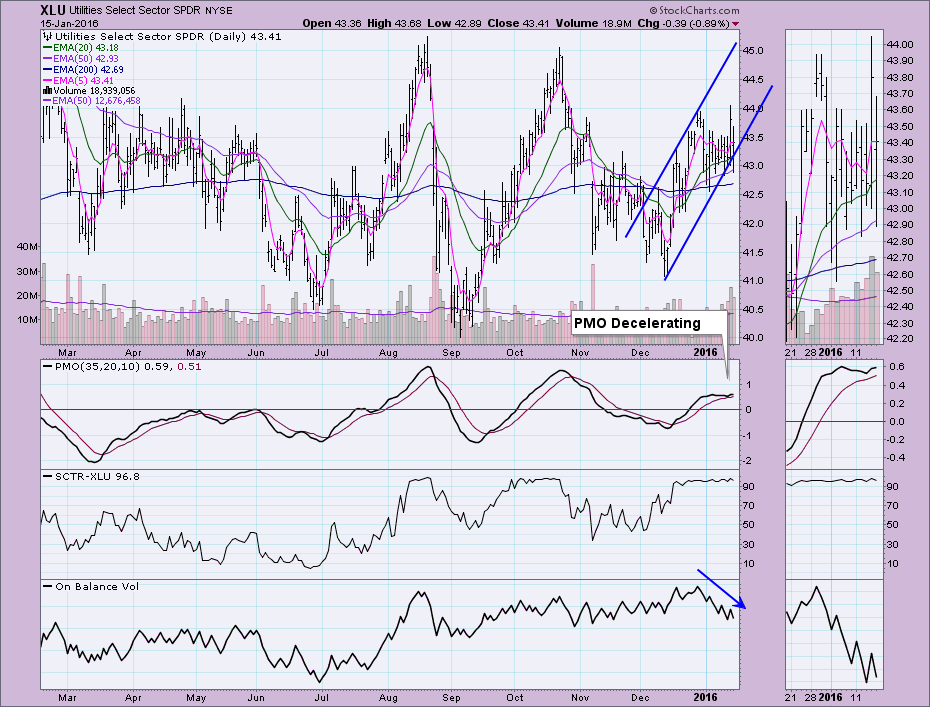
MEMBERS ONLY
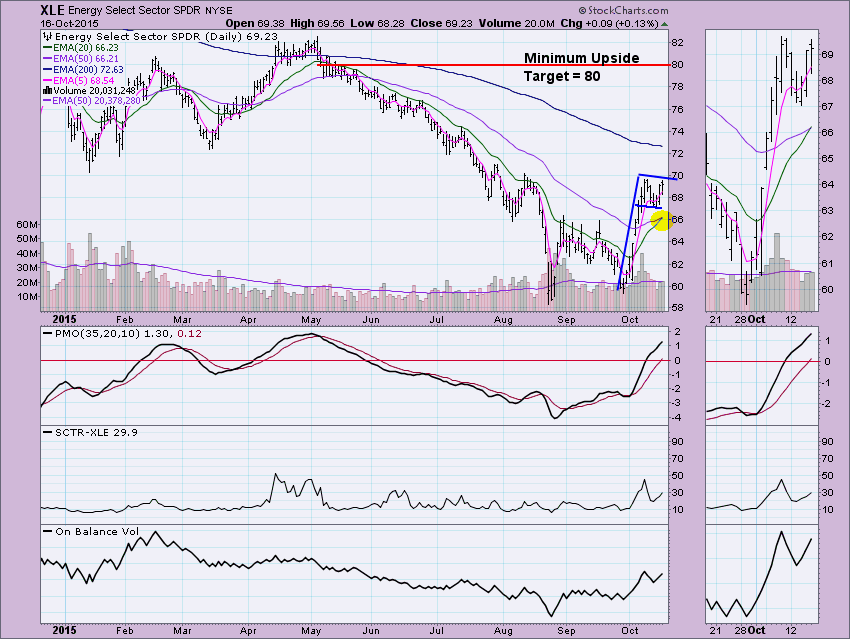
Energy and Utilities Spark Interest
by Erin Swenlin,
Vice President, DecisionPoint.com
Energy and Utilities have both recently sparked my curiosity. It started with the Energy sector on our DecisionPoint Daily/Market Summary which flipped from Intermediate-Term Trend Model SELL signals to BUY signals. After that, I received a Technical Alert from a scan I have that notifies me when the 50/...
READ MORE
MEMBERS ONLY
Why Are Neutral Signals Not Turning Into Sell Signals?
by Erin Swenlin,
Vice President, DecisionPoint.com
I recently received an email from a reader who asked me why the neutral signals on the had not turned to red Sell signals. First there is the technical reason and then there are the charts. The technical reason is that our DecisionPoint Trend Model only changes on crossovers. Once...
READ MORE
MEMBERS ONLY
Short-Term Oscillators Overbought...Like in October Past?
by Erin Swenlin,
Vice President, DecisionPoint.com
I really appreciate receiving your questions, emails and webinar comments. They so often will spur an article and it likely is of interest to many others if someone took the time to send it to me. So here is today's question:
"As for short term indicators, e....
READ MORE
MEMBERS ONLY
Rydex Assets Charts Spike
by Erin Swenlin,
Vice President, DecisionPoint.com
I received a question from a reader that I thought would make a great article:
"Can you explain if there is any significance to spike on the Total Assets Rydex Bear Index Funds chart?"
First, a quick refresher on the Rydex Asset Ratio. The Rydex Asset Ratio makes...
READ MORE
MEMBERS ONLY
Nasdaq 100: Hero to Zero
by Erin Swenlin,
Vice President, DecisionPoint.com
For many weeks, the DP Scoreboard for the Nasdaq 100 was the most positive in comparison to the S&P 500, S&P 100 and Dow Industrials. In fact, back when the NDX was in the lead with the most bullish signals, the others were grappling with more...
READ MORE
MEMBERS ONLY
Swenlin Trading Oscillators Suggest More Upside But Beware Making a Bear into a Bull
by Erin Swenlin,
Vice President, DecisionPoint.com
The title "suggest more upside" refers to the short term, not the intermediate or long terms. We are still in a bear market, a genuine bear market, so we shouldn't expect bullish results. However, even within a bear market, there are rallies. The important thing to...
READ MORE
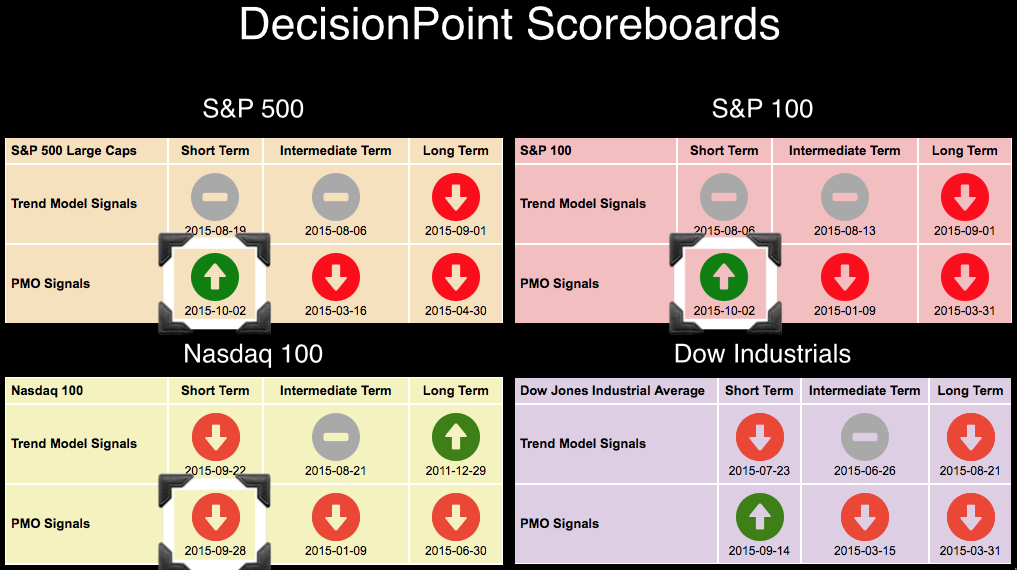
MEMBERS ONLY
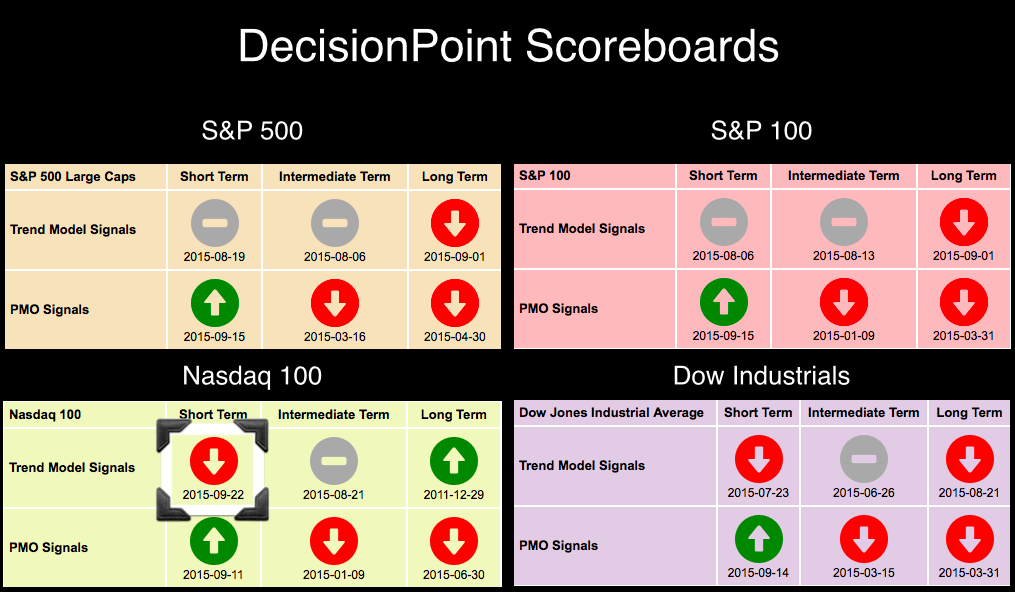
New SELL Signals on the DP Scoreboards - Only Two Bullish Signals Remain
by Erin Swenlin,
Vice President, DecisionPoint.com
I noted yesterday that the NDX, SPX and OEX all had Short-Term Price Momentum Oscillator (PMO) crossover SELL signals. The DecisionPoint Scoreboard is below. Let's look at the crossovers and then we will discuss the NDX Long-Term Trend Model BUY signal and INDU Short-Term PMO BUY signal. Just...
READ MORE
MEMBERS ONLY
Nasdaq 100 Short-Term SELL Signal
by Erin Swenlin,
Vice President, DecisionPoint.com
The Nasdaq 100 (NDX) has been the leading index for the recent rally. It was the first to move from short-term Neutral and SELL signals to BUY signals on the DecisionPoint Scoreboards. However, the rally has lost its legs and the NDX is the first show this, whipsawing from a...
READ MORE
MEMBERS ONLY
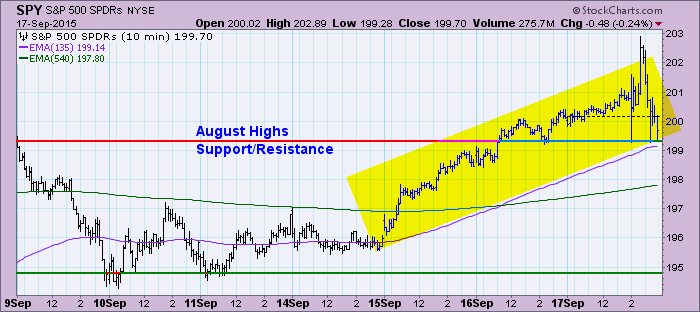
Short-Term Indicators Worrisome
by Erin Swenlin,
Vice President, DecisionPoint.com
The SPY in the last three days has been trending higher, so expectation would be that short-term indicators would reflect that strength. They are currently deteriorating or pointing to internal weakness. In today's DecisionPoint Alert blog, I reviewed the short-term charts below (as well as intermediate-term charts not...
READ MORE
MEMBERS ONLY
Beware of Bull Traps
by Erin Swenlin,
Vice President, DecisionPoint.com
According to the glossary in ChartSchool, the definition of a Bull Trap: A situation that occurs when prices break above a significant level and generate a buy signal, but suddenly reverse course and negate the buy signal, thus “trapping” the bulls that acted on the signal with losses. I'...
READ MORE
MEMBERS ONLY
Scanning for Opportunities in a Bear Market
by Erin Swenlin,
Vice President, DecisionPoint.com
I think most are in agreement that we are now in a bear market. As far as DecisionPoint models are concerned, we definitely are. When the 50-EMA crosses below the 200-EMA, we consider that ETF/Stock/Index/MF to be in a "bear market". To be successful, we...
READ MORE
MEMBERS ONLY
Rydex Assets and Sentiment Offer Insight
by Erin Swenlin,
Vice President, DecisionPoint.com
As part of a comment on Friday's DecisionPoint Alert, I was asked to review the DecisionPoint sentiment charts. Significant market tops and bottoms are normally accompanied by extremes of sentiment in one direction, and that is a strong indication that the market is about to head in the...
READ MORE
MEMBERS ONLY
Dollar and Commodities Only Issues in DP Market/Sector Summary with Rising 20-EMAs
by Erin Swenlin,
Vice President, DecisionPoint.com
Take a look at the DecisionPoint Scoreboard for last week. (You'll find the Scoreboards in the DecisionPoint Chart Gallery. The link is on the homepage). If you've read any of my articles this week, you'll know that the new Long-Term Trend Model (LTTM) 50/...
READ MORE
MEMBERS ONLY
TLT is the Only (Somewhat) Bright Spot on the Market/Sector Summary
by Erin Swenlin,
Vice President, DecisionPoint.com
Every day, we publish a complete Market/Sector Summary in the DP Reports Blog. Not many are aware of its usefulness or even its existence! I publish an excerpt from that report every day in the DecisionPoint Alert day's analysis blog. Something very interesting has been happening on...
READ MORE
MEMBERS ONLY
Why is this Different from October? - OEX and SPX NEW Long-Term SELL Signals
by Erin Swenlin,
Vice President, DecisionPoint.com
We had two VERY important signal changes today! Both the S&P 500 and S&P 100 generated Long-Term Trend Model SELL signals. This is very serious, especially given that the Dow Industrials already received a LT SELL signal on August 21st. I've gotten many emails...
READ MORE