MEMBERS ONLY
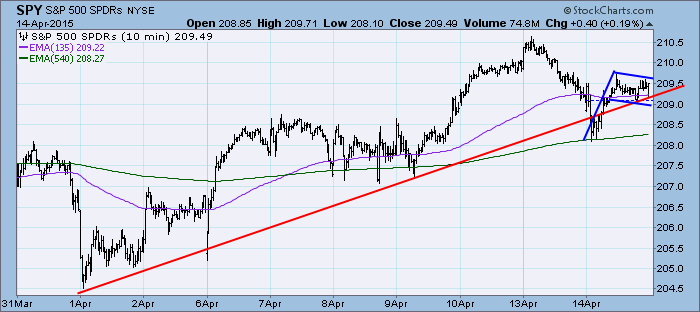
DP Market Update: Triple-Top? Deja Vu All Over Again - April 13, 2015
by Erin Swenlin,
Vice President, DecisionPoint.com
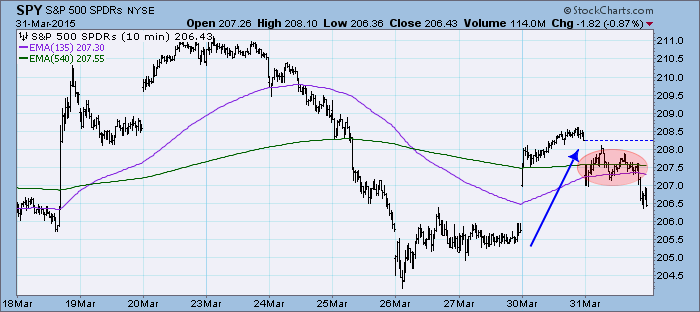
Prices continued to fall, carrying yesterday's decline slightly further. However, losses were recouped early as price bounced right off of the slow moving EMA. This price movement formed an ultra-short-term bull flag that if executed would bring price above yesterday's high.
The purpose of the DecisionPoint...
READ MORE
MEMBERS ONLY
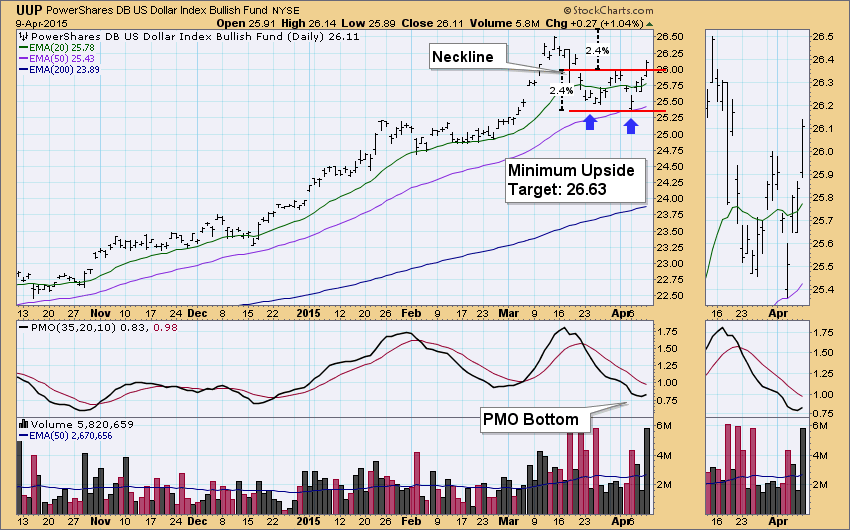
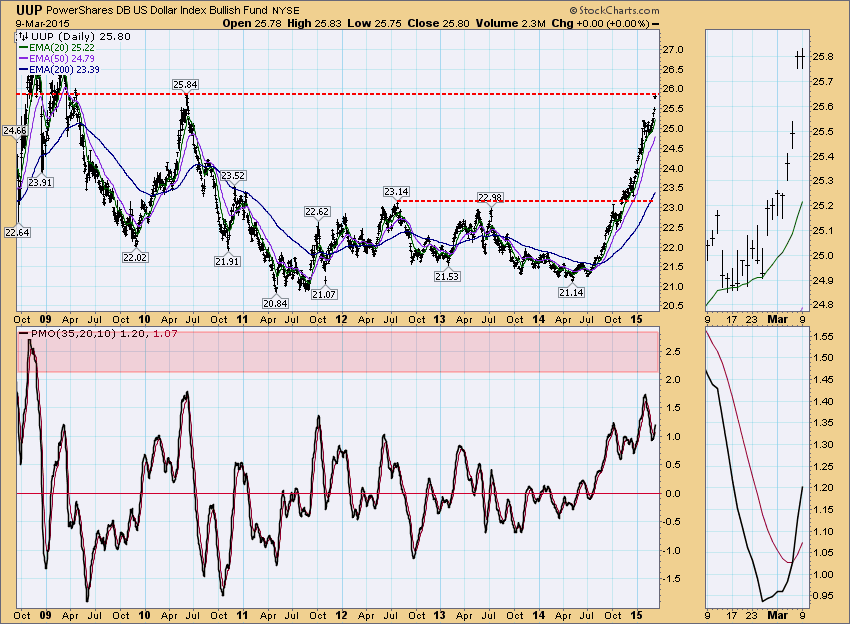
UUP Executes Short-Term Double-Bottom
by Erin Swenlin,
Vice President, DecisionPoint.com
I've been watching the dollar, UUP (PowerShares US Dollar Index ETF) in particular. A short-term double-bottom has been forming and today price penetrated the neckline, executing this bullish chart pattern.
Looking at a six-month daily chart the pattern is easy to see. When a double-bottom pattern executes, the...
READ MORE
MEMBERS ONLY
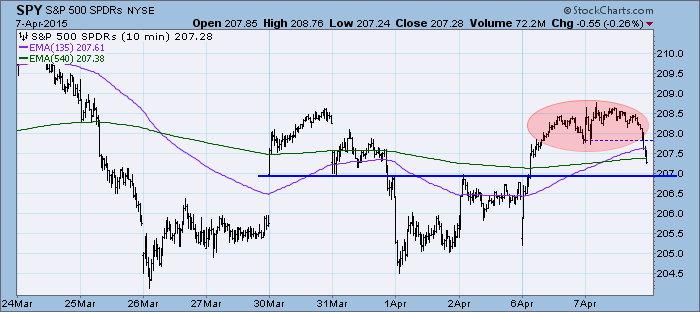
DP Market Update: Double-Top Aborted - April 7, 2015
by Erin Swenlin,
Vice President, DecisionPoint.com
The market was mostly in a holding pattern today until the final 20 minutes when price broke down to close in the red. Ultra-short-term support is lurking, while a second area of support is waiting at the March 26th low.
The purpose of the DecisionPoint Daily Update is to quickly...
READ MORE
MEMBERS ONLY
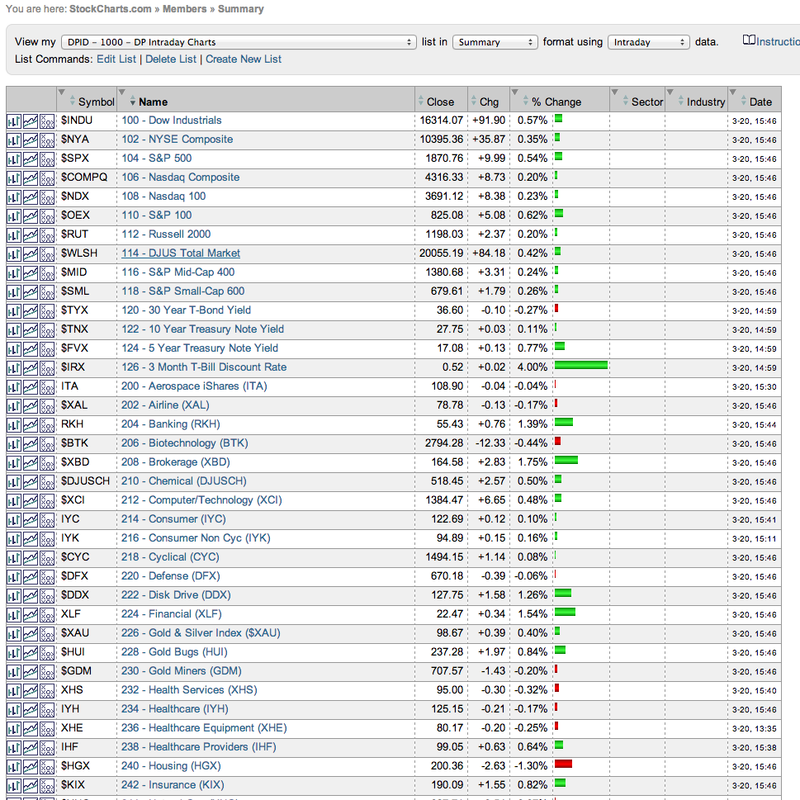
DecisionPoint Intraday ChartPack - A Must Have
by Erin Swenlin,
Vice President, DecisionPoint.com
I use this ChartPack during every trading day. It is absolutely invaluable and a "must-have" for any of you who tend to find yourself glued to StockCharts when the market is open. The beauty of this ChartPack, it is only one ChartList, so for any of you that...
READ MORE
MEMBERS ONLY
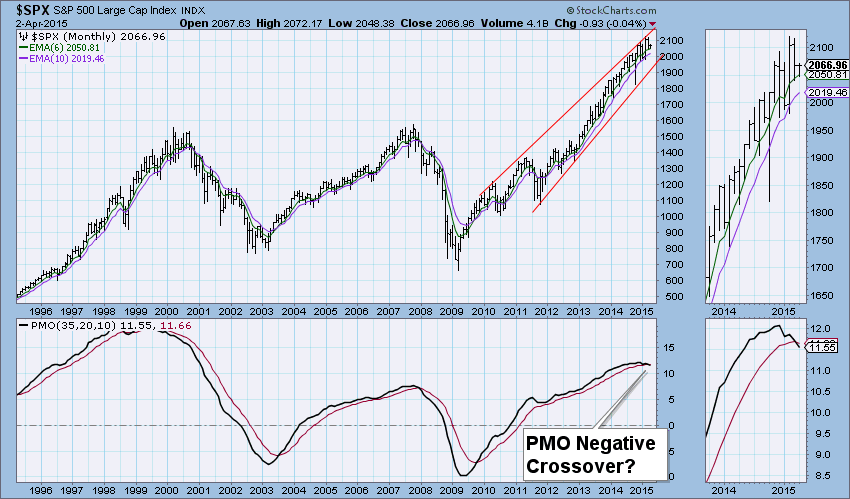
Is that your Final Answer? A Monthly PMO Negative Crossover?
by Erin Swenlin,
Vice President, DecisionPoint.com
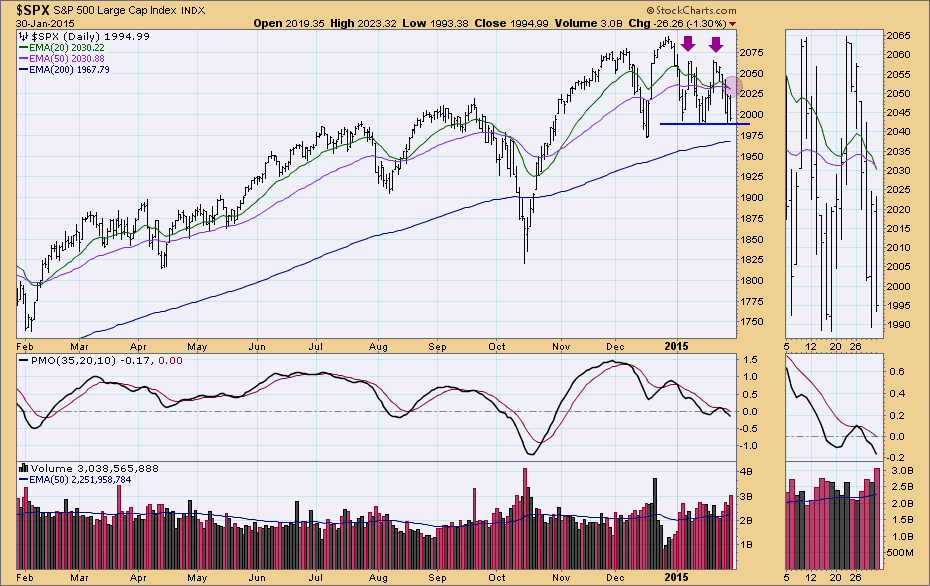
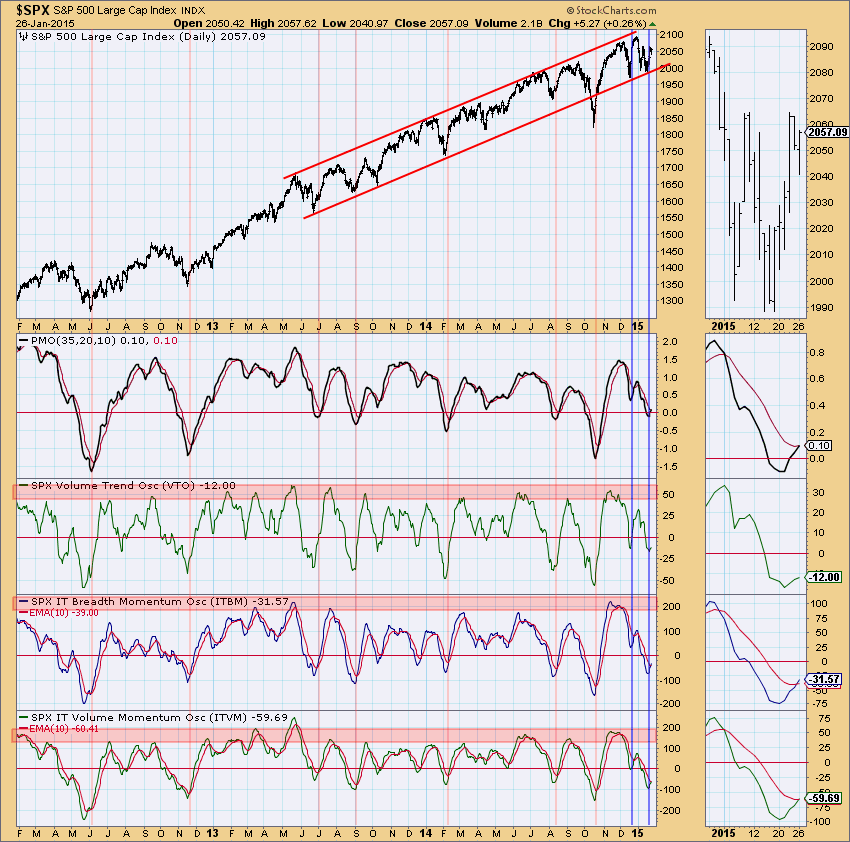
Since about mid-March I've gotten quite a few questions from subscribers asking me to look at the $SPX monthly chart because it shows a monthly Price Momentum Oscillator (PMO) negative crossover. We haven't seen a monthly PMO crossover since the positive crossover occurred at the end...
READ MORE
MEMBERS ONLY
DP Market Update: Rebound Over - March 31, 2015
by Erin Swenlin,
Vice President, DecisionPoint.com
After consolidating the correction last week, price rebounded on Monday, but it was over today as price stayed in the red all day. It consolidated in negative territory, but the end of the day price saw price fall back down and out of that area of congestion. Interestingly, you can...
READ MORE
MEMBERS ONLY
Music to Your Portfolio: Using the PMO & Trend Model in Harmony
by Erin Swenlin,
Vice President, DecisionPoint.com
I was asked a question recently about how we can use the Price Momentum Oscillator (PMO) in conjunction with the Trend Model or which do I rely on most when making investment decisions. In a general sense, I prefer to use the PMO with Trend Model confirmations or positive Trend...
READ MORE
MEMBERS ONLY
DP Market Update: Resistance Holds - March 24, 2015
by Erin Swenlin,
Vice President, DecisionPoint.com
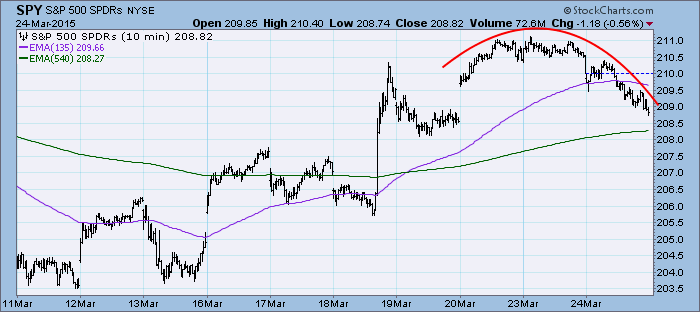
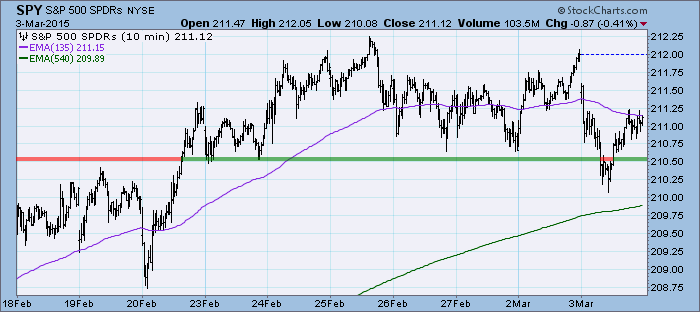
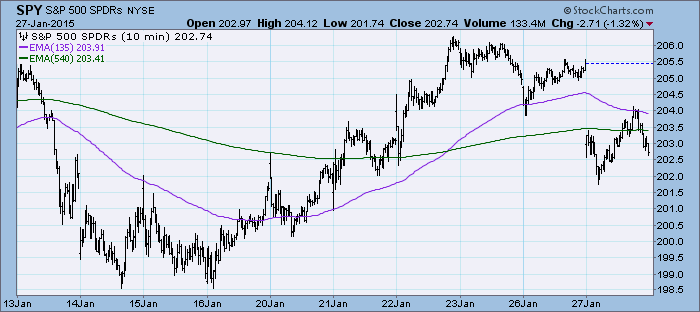
Since reaching and nearly capturing all-time highs, price has been declining. The rounded top on the 10-minute bar chart is clear and implies price will continue lower. There is an area of support nearby at the 3/19 low, but I believe that will be taken out quickly.
The purpose...
READ MORE
MEMBERS ONLY
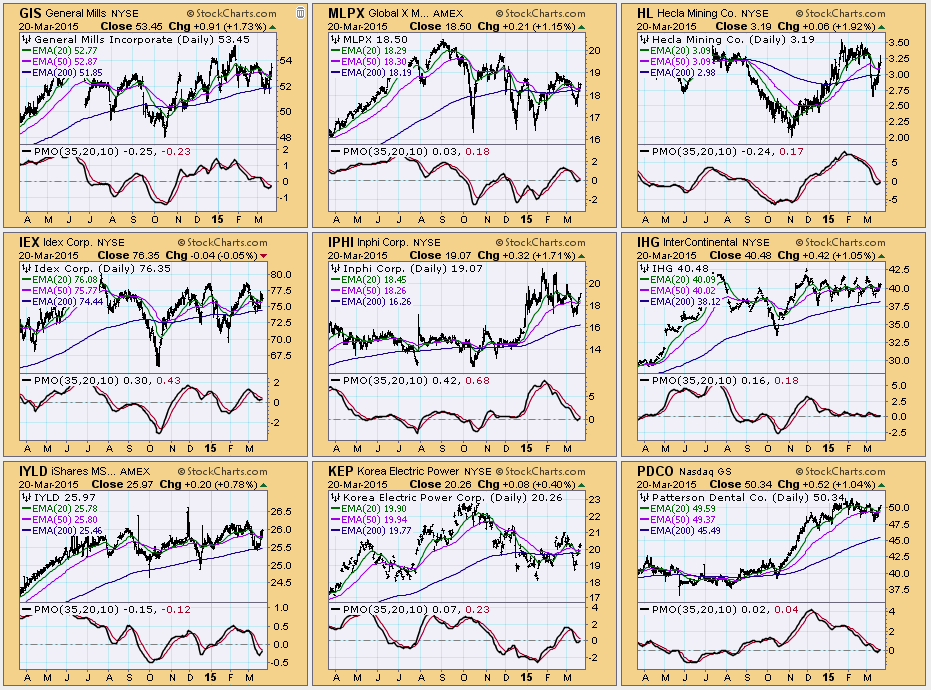
5-EMA/PMO Scan Produces Interesting Short-Term Opportunities
by Erin Swenlin,
Vice President, DecisionPoint.com
With the market bottoming and taking a positive turn, I decided it might be a good time to review the results of one of my favorite and nicely discriminating short-term scans. It looks for stocks that are in a positive configuration of the 50/200-EMAs; meaning 50-EMA > 200-EMA which...
READ MORE
MEMBERS ONLY
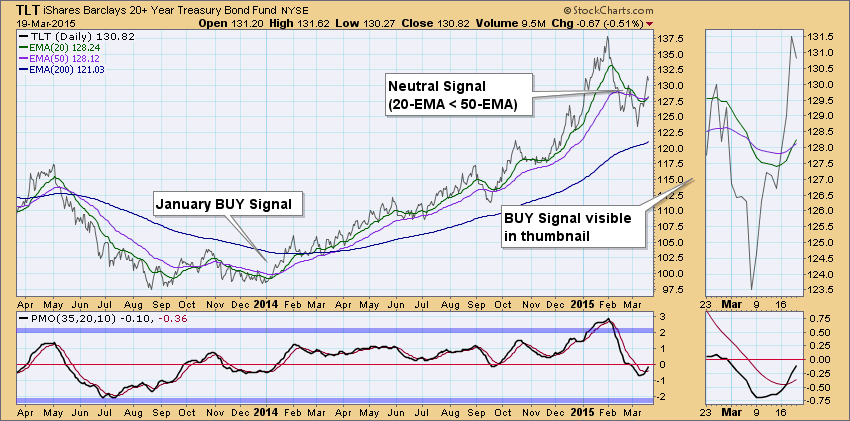
Don't Look Now, Bonds are Back on a BUY
by Erin Swenlin,
Vice President, DecisionPoint.com
I wrote in the last issue of ChartWatchers that the DecisionPoint Intermediate-Term Trend Model went on a Neutral signal. The first signal change since the BUY signal had originally generated on January 17, 2014! Well, it was a short-lived signal as today, 2 weeks later, the Trend Model generated a...
READ MORE
MEMBERS ONLY
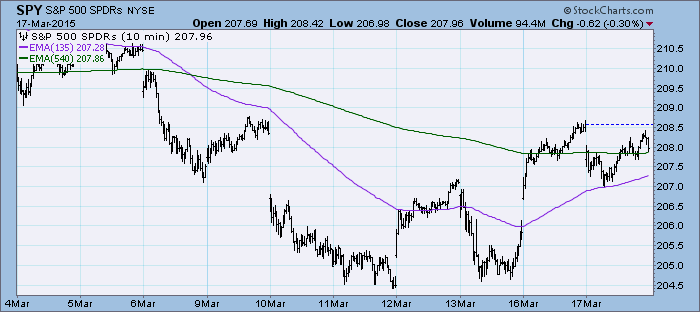
DP Market Update: Holding Pattern Before FOMC Meeting - March 17, 2015
by Erin Swenlin,
Vice President, DecisionPoint.com
Price didn't do much today, spending the majority nearly all day in the red. After hitting the intraday low, it trended up and managed to recoup about half of the day's losses.
The purpose of the DecisionPoint Daily Update is to quickly review the day'...
READ MORE
MEMBERS ONLY
PMO Crossover SELL Signals on $WTIC, $BRENT and USO
by Erin Swenlin,
Vice President, DecisionPoint.com
DecisionPoint covers United States Oil Fund (USO) regularly in the DP Market Update on Tuesdays, during the webinar on Wednesdays and in the DP Weekly Update on Fridays (found in DP Reports Blog). It appeared USO would make a turnaround as we got a prescient PMO Crossover BUY signal in...
READ MORE
MEMBERS ONLY
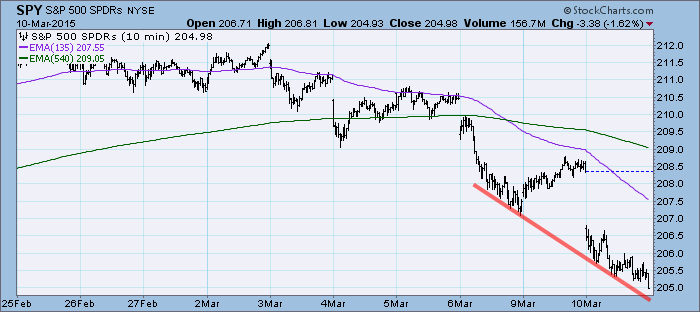
DP Market Update: Correction Picks Up Steam - March 10, 2015
by Erin Swenlin,
Vice President, DecisionPoint.com
Yesterday, price managed to turn up and scalp some losses, but today prices gapped down and continued lower, basically taking over where it left off on Friday.
The purpose of the DecisionPoint Daily Update is to quickly review the day's action, internal condition, and Trend Model status of...
READ MORE
MEMBERS ONLY
Dollar Struggles at Long-Term Resistance
by Erin Swenlin,
Vice President, DecisionPoint.com
Last Friday the dollar gapped up to reach overhead resistance at the 2010 high. Looking at UUP, the dollar ETF, we see that today, resistance held. The question now is whether it will be able to break out and set a new multi-year high. Looking at the Price Momentum Oscillator...
READ MORE
MEMBERS ONLY
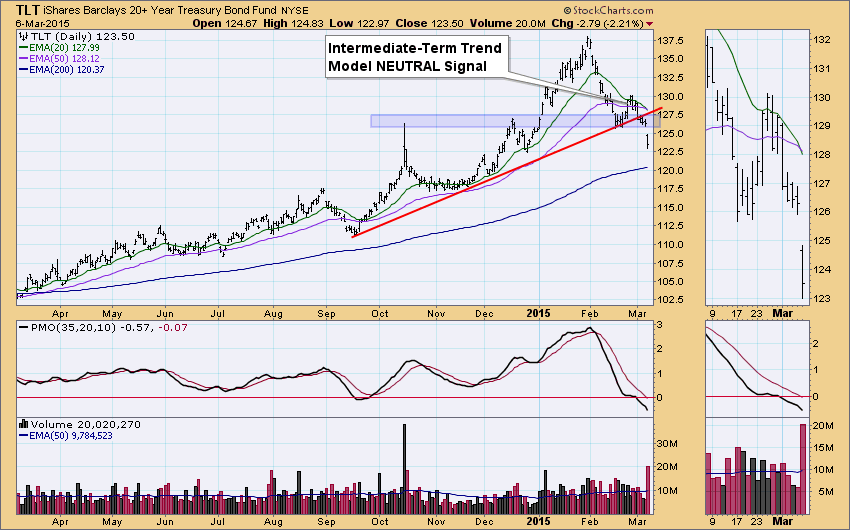
DecisionPoint Trend Model Generates NEUTRAL Signal on TLT
by Erin Swenlin,
Vice President, DecisionPoint.com
DecisionPoint has been on an Intermediate-Term Trend Model BUY signal since January 17, 2014, so a Neutral signal is a big deal as far as our timing models are concerned. The signal was generated when the 20-EMA crossed below 50-EMA. It was not a SELL signal because the 50-EMA was...
READ MORE
MEMBERS ONLY
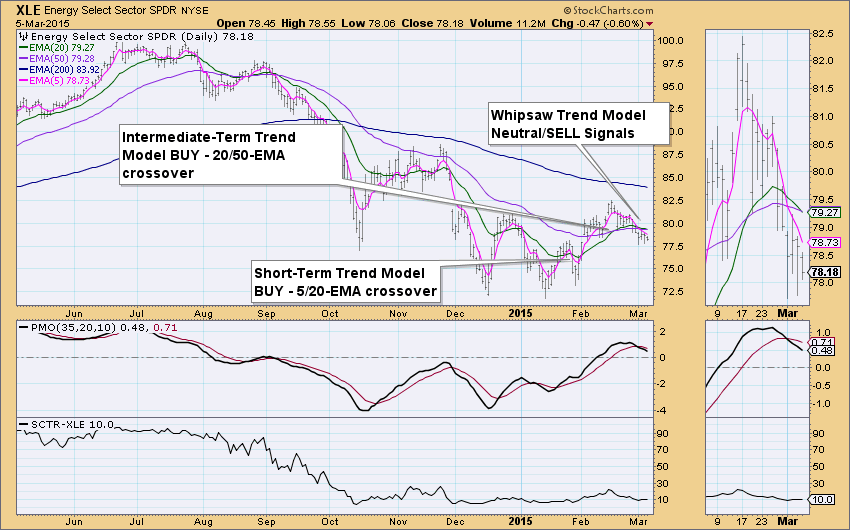
Lights Out for Energy Sector
by Erin Swenlin,
Vice President, DecisionPoint.com
On February 19th I wrote a blog article on the Energy Sector and its possible resurgence as both the Energy SPDR (XLE) and the equal-weighted sister Rydex Energy ETF (RYE) had gone on Intermediate-Term Trend Model BUY signals following Short-Term Trend Model BUY signals. Well, it's lights out...
READ MORE
MEMBERS ONLY
DP Market Update: Short- and Intermediate-Term Indicators Bearish - March 3, 2015
by Erin Swenlin,
Vice President, DecisionPoint.com
Prices corrected through mid-day but managed to pare down some of the losses with a late-day rally. You can see that price has been in a continuation pattern for over a week. Today it appeared horizontal support would not hold, but the prices pulled themselves back up into the consolidation...
READ MORE
MEMBERS ONLY
PMO + CandleGlance = Smart Money
by Erin Swenlin,
Vice President, DecisionPoint.com
The definition of "Smart Money": Money bet or invested by people with expert knowledge. I won't claim expert knowledge, but the pursuit of getting as close to that as possible is what we are doing here on StockCharts.com. In many of my previous DecisionPoint blog...
READ MORE
MEMBERS ONLY
DP Market Update: Price and Volume Disconnect - February 24, 2015
by Erin Swenlin,
Vice President, DecisionPoint.com
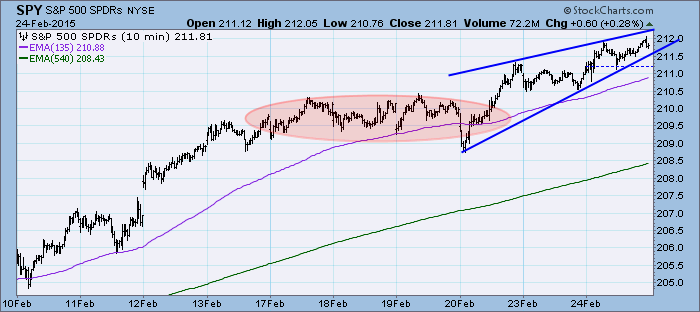
The market began trending higher after taking time to digest the this month's rally but it appears that there is downward pressure that has helped form a bearish ascending wedge. Expectation is a breakdown out of the wedge, but this is very short-term and the pattern only tells...
READ MORE
MEMBERS ONLY
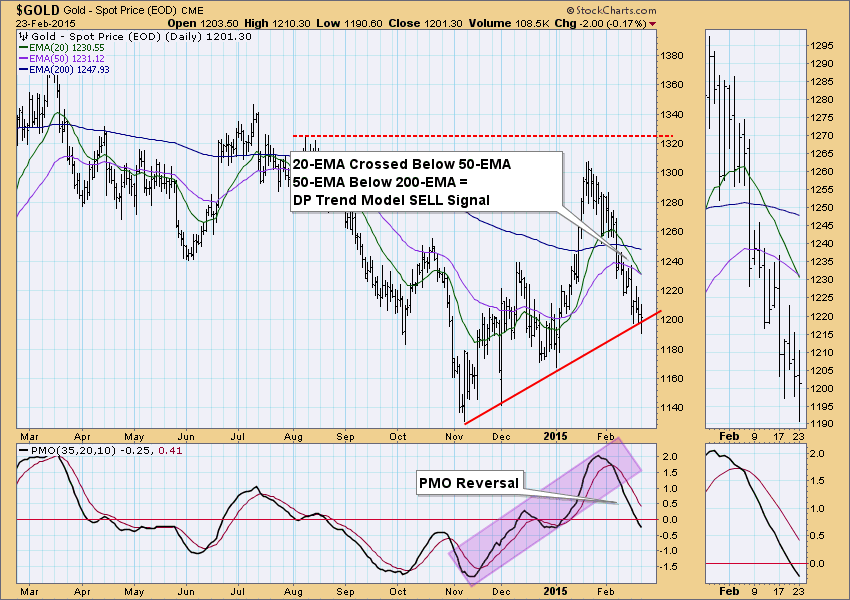
Gold Gets a DP Trend Model SELL Signal
by Erin Swenlin,
Vice President, DecisionPoint.com
It was bound to happen. Gold has been struggling with a correction that began when price failed to reach the August 2014 high. The intermediate-term DP Trend Model generated a SELL signal today when the 20-EMA crossed below the 50-EMA. Since the 50-EMA was below the 200-EMA, it created a...
READ MORE
MEMBERS ONLY
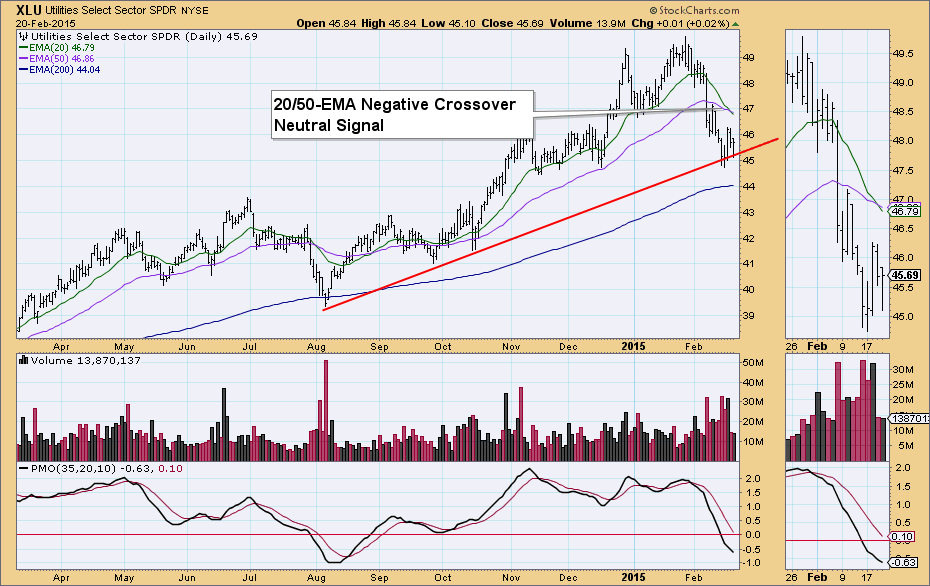
Utilities Sector Failing
by Erin Swenlin,
Vice President, DecisionPoint.com
On Friday's DecisionPoint Alert Report, the Utilities SPDR (XLU) went on a Neutral signal. It's sister, the equal-weight Rydex version (RYU) remains on a BUY signal. It appears that it will flip next week to a Neutral signal as well.
We see that Intermediate-Term Trend Model...
READ MORE
MEMBERS ONLY
Energy Sector Lights Up
by Erin Swenlin,
Vice President, DecisionPoint.com
Yesterday, we had a BUY signal light up on our DP Alert Daily Report for XLE, the cap-weighted Energy SPDR and today, a BUY signal was also generated on RYE, the equal-weighted Energy ETF. These were the only two sectors that had been sitting on Neutral signals on the entire...
READ MORE
MEMBERS ONLY
DP Market Update: All-Time Highs...Again - February 17, 2015
by Erin Swenlin,
Vice President, DecisionPoint.com
The market hit all-time highs today in less than impressive fashion, but they are all-time highs nonetheless. The ultra-short-term rising bottoms line is still intact and hasn't been tested since its inception, but it appears it will be forced to tomorrow.
The purpose of the DecisionPoint Daily Update...
READ MORE
MEMBERS ONLY
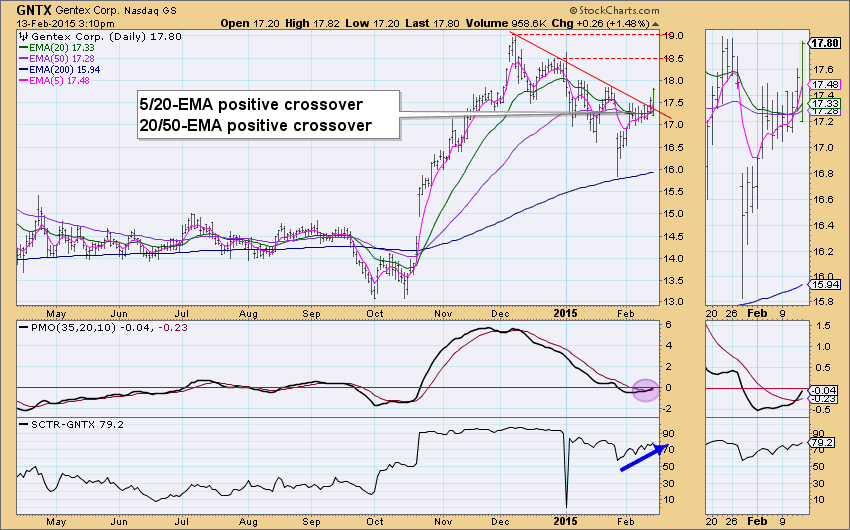
Don't Put Gentex in your Rearview Mirror
by Erin Swenlin,
Vice President, DecisionPoint.com
I did one of my favorite scans today and it produced a little known company (among others) called Gentex Corp (GNTX). I actually had to look up what their business was about. Interestingly, they manufacture auto-dimming rearview mirrors. I wanted you to see this chart regardless of its obscurity because...
READ MORE
MEMBERS ONLY
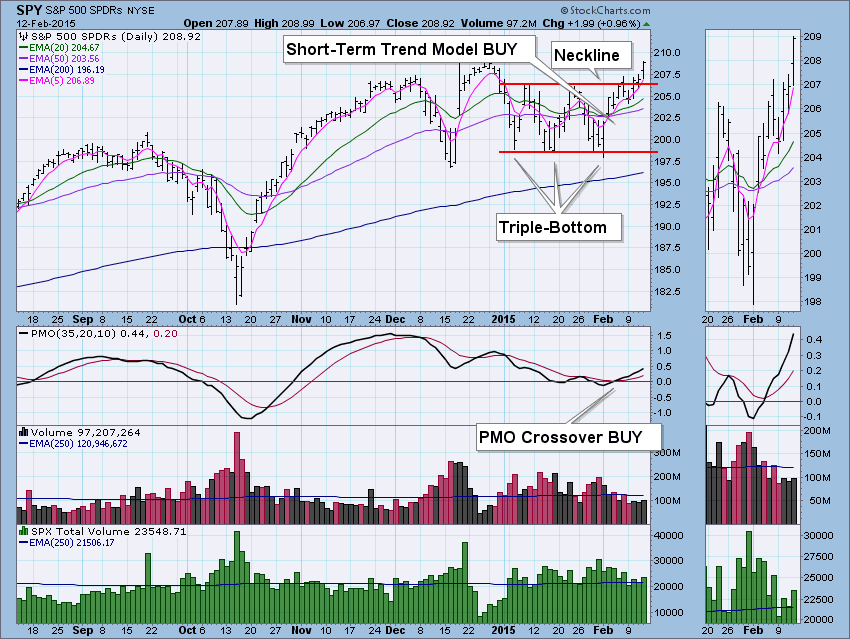
Initiation Impulse Confirms Triple Bottom Breakout
by Erin Swenlin,
Vice President, DecisionPoint.com
I've been skeptical but cautiously optimistic that the market was forming a triple-bottom within the trading range it has been bounded by since the beginning of January. Today, the market broke out of its doldrums and made a significant breakout, though not yet "decisive" which would...
READ MORE
MEMBERS ONLY
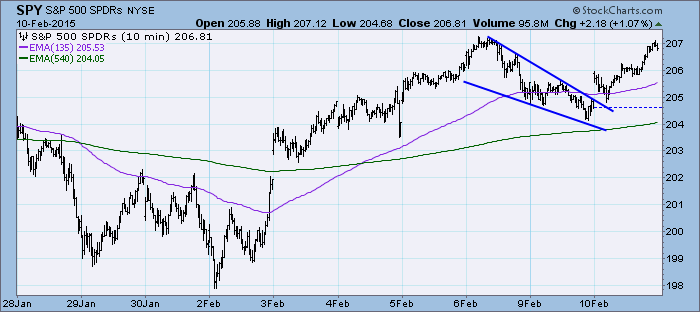
DP Market Update: Small Breakout - February 10, 2015
by Erin Swenlin,
Vice President, DecisionPoint.com
Today saw a breakout from the bullish descending wedge pattern that had formed over the past two trading days. In the last 20 minutes of the trading day, price hit overhead resistance at the 2/6 high and was turned back.
** Don't forget to sign up for tomorrow&...
READ MORE
MEMBERS ONLY
Finding Investments Using the Short-Term Trend Model and the PMO
by Erin Swenlin,
Vice President, DecisionPoint.com
Finding shorter-term investments especially in a volatile market is very challenging. DecisionPoint has many tools for narrowing in on opportunities. One of our little known tools is the Short-Term Trend Model (ST/TM). Combine that model with our powerful Price Momentum Oscillator (PMO) and you should be able to narrow...
READ MORE
MEMBERS ONLY
HOT: SPY and Financials Equal-Weighted ETF (RYF) - COLD: Gold and the Dollar
by Erin Swenlin,
Vice President, DecisionPoint.com
When I took a look at the DP Alert Daily Report today, I noticed it had some important Price Momentum Oscillator (PMO) crossover BUY/SELL signals that you should know about. Additionally, the DecisionPoint Intermediate-Term Trend Model generated a BUY signal on the equal-weighted Financials ETF (RYF) and that chart...
READ MORE
MEMBERS ONLY
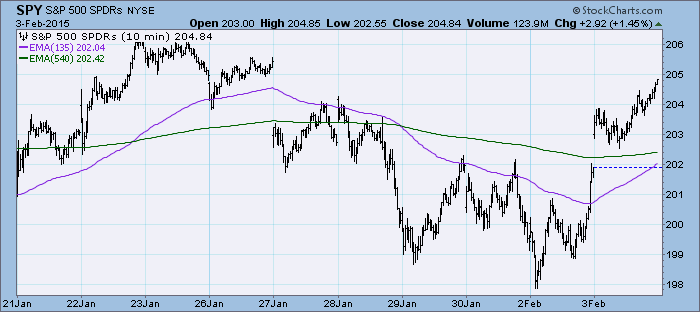
DP Market Update: Trading Range Holding On - February 3, 2015
by Erin Swenlin,
Vice President, DecisionPoint.com
** Don't forget to sign up for the DecisionPoint LIVE! webinar! Tweet your suggestions for the reader's request chart review @_DecisionPoint **
The market rallied above the previous three days' tops. A weaker dollar and stronger oil prices fueled the rally.
The purpose of the DecisionPoint Market...
READ MORE
MEMBERS ONLY
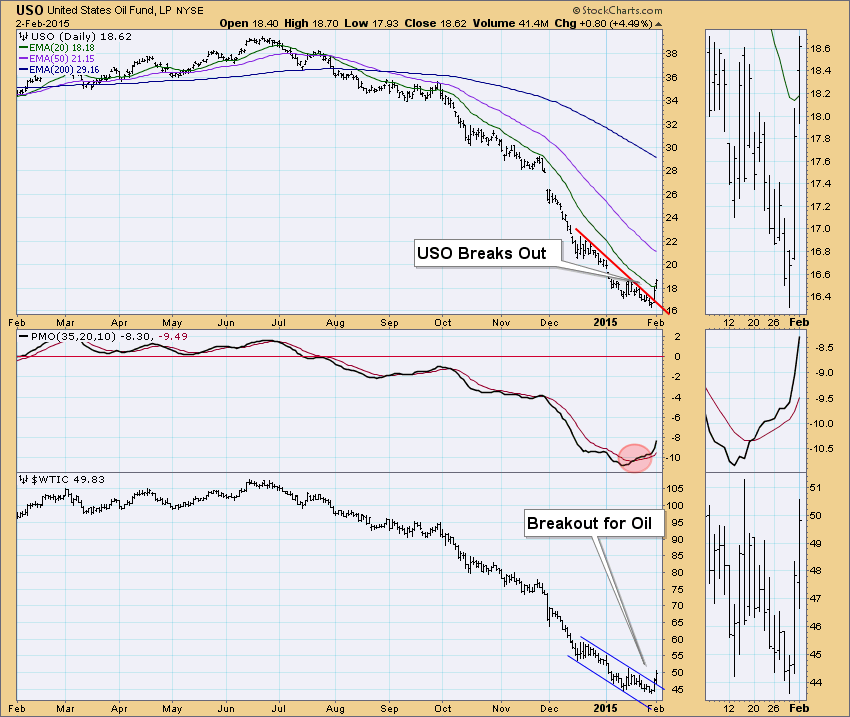
USO Breaks Out - Rydex Asset Analysis - Neutral Signals on Dow (DIA) and Technology Equal-Weight (RYT)
by Erin Swenlin,
Vice President, DecisionPoint.com
There were some exciting charts and interesting Trend Model signal changes today. We will look at the Oil breakout and determine if this is finally a buying opportunity for USO. Rydex Asset analysis suggests a possible price bottom for the market.
United States Oil Fund (USO) finally had a significant...
READ MORE
MEMBERS ONLY
Trend Model Neutral Signals for SPX, DOW, OEX and NYSE
by Erin Swenlin,
Vice President, DecisionPoint.com
We have been watching the SPX closely in anticipation of an Intermediate-Term Trend Model Neutral signal. It is extraordinarily close to reaching that 20/50-EMA crossover as are many of the other indexes. The DOW, OEX and NYSE are the first to generate Neutral signals as the 20-EMA crossed below...
READ MORE
MEMBERS ONLY
DP Trend Model Neutral Signal on Technology ETF (XLK)
by Erin Swenlin,
Vice President, DecisionPoint.com
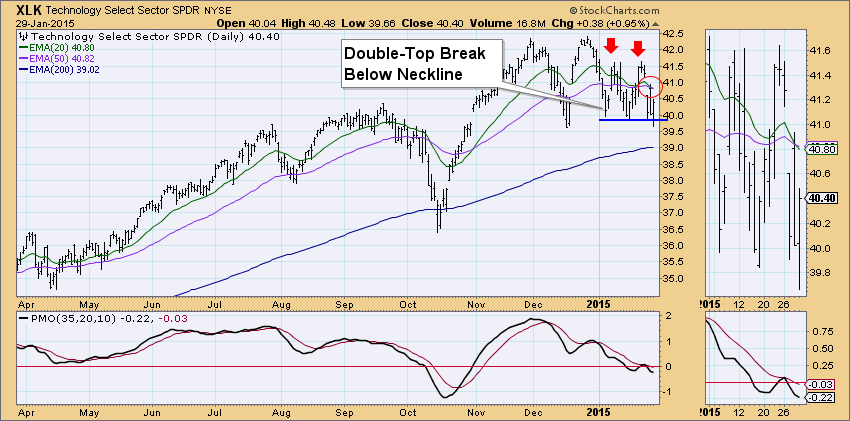
The Technology ETF (XLK) looks a lot like the SPY (see DecisionPoint Blog article, "Double-Top and Initiation Impulse Spell Trouble") which is not a good thing right now.
First, the DecisionPoint Intermediate-Term Trend Model generated a Neutral signal when the 20-EMA crossed below the 50-EMA. It was not...
READ MORE
MEMBERS ONLY
Double-Top and Initiation Impulse Spell Trouble
by Erin Swenlin,
Vice President, DecisionPoint.com
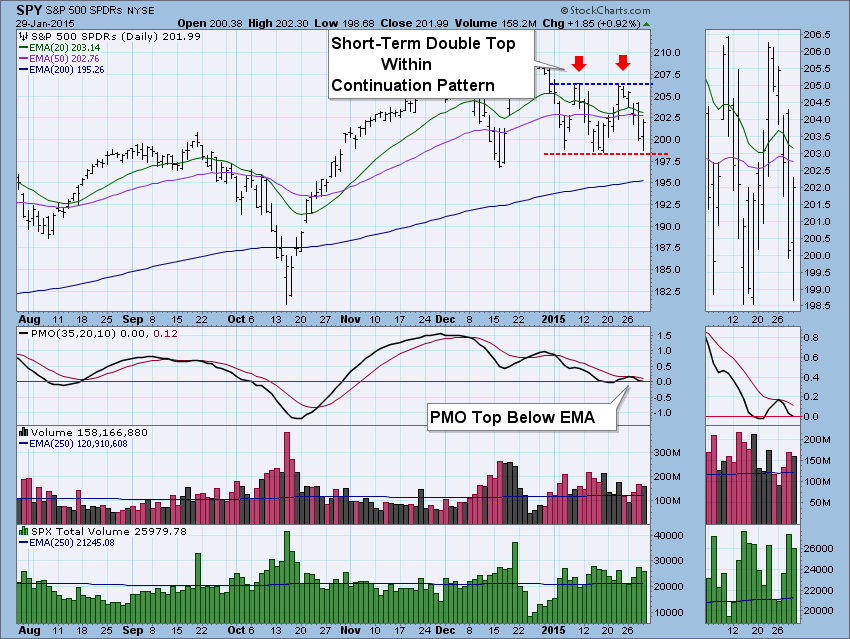
What looked like a short-term double-bottom formation, has now reconfigured into a double-top. So in the matter of a week, we've gone from positive indicators and a bullish double-bottom formation to negative indicators in all three time frames and a bearish double-top formation. We see price has been...
READ MORE
MEMBERS ONLY
DP Market Update: Double-Bottom Aborts - January 27, 2015
by Erin Swenlin,
Vice President, DecisionPoint.com
Earnings from big companies like Microsoft, P&G and Caterpillar were disappointing and are taking some of the blame for today's drop. On the flip side, Apple crushed previous estimates, but it didn't save it from the tidal wave of selling in the general market,...
READ MORE
MEMBERS ONLY
Intermediate-Term Indicators Positive Crossovers and Industrials Equal-Weighted ETF (RGI) BUY Signal
by Erin Swenlin,
Vice President, DecisionPoint.com
I've been watching our indicator charts very closely for quite sometime now as we prepare for a possible breakout from the double-bottom formation on the SPY. Additionally, we had a Trend Model signal change on our DP Alert Daily Report (found in the subscriber-only DP Reports Blog).
Intermediate-Term...
READ MORE
MEMBERS ONLY
DP Weekly Update: Price Stopped at Double-Bottom Neckline - January 23, 2015
by Erin Swenlin,
Vice President, DecisionPoint.com
**Please note the new DecisionPoint Blog publishing schedule. The Friday DP Weekly Update will only be available in the Subscriber-only DP Reports Blog starting next week.**
Join me Wednesday for the first DecisionPoint LIVE! Webinar at 4:30pm Eastern. Click here to register!
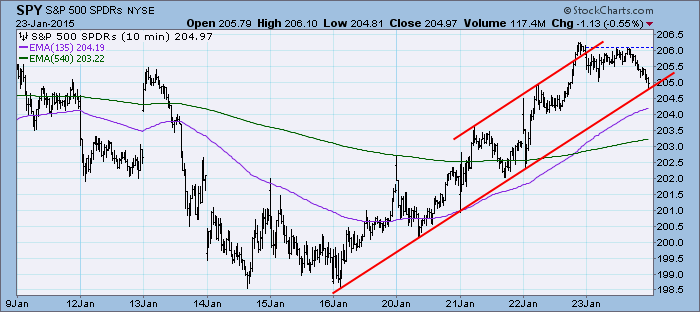
Price took a pause and moved back...
READ MORE
MEMBERS ONLY
DecisionPoint LIVE! Webinar Starts Wednesday + New Publishing Schedule
by Erin Swenlin,
Vice President, DecisionPoint.com
I'm pleased to announce that I will be hosting my first webinar, DecisionPoint LIVE! on Wednesday at 4:30pm Eastern. You'll get live market analysis from the DecisionPoint perspective every Wednesday. I'll be presenting my technical views on the markets and then take questions...
READ MORE
MEMBERS ONLY
Short-Term Indicators in Question
by Erin Swenlin,
Vice President, DecisionPoint.com
First, thank you for all of your well wishes and comments sent to my Dad, Carl as he continues to recover from quadruple bypass surgery. He's making progress, it is just slow going, especially as far as he's concerned!
My last two blog article titles were...
READ MORE
MEMBERS ONLY
DP Weekly Update: Short-Term Indicators Turn Up - January 16, 2015
by Erin Swenlin,
Vice President, DecisionPoint.com
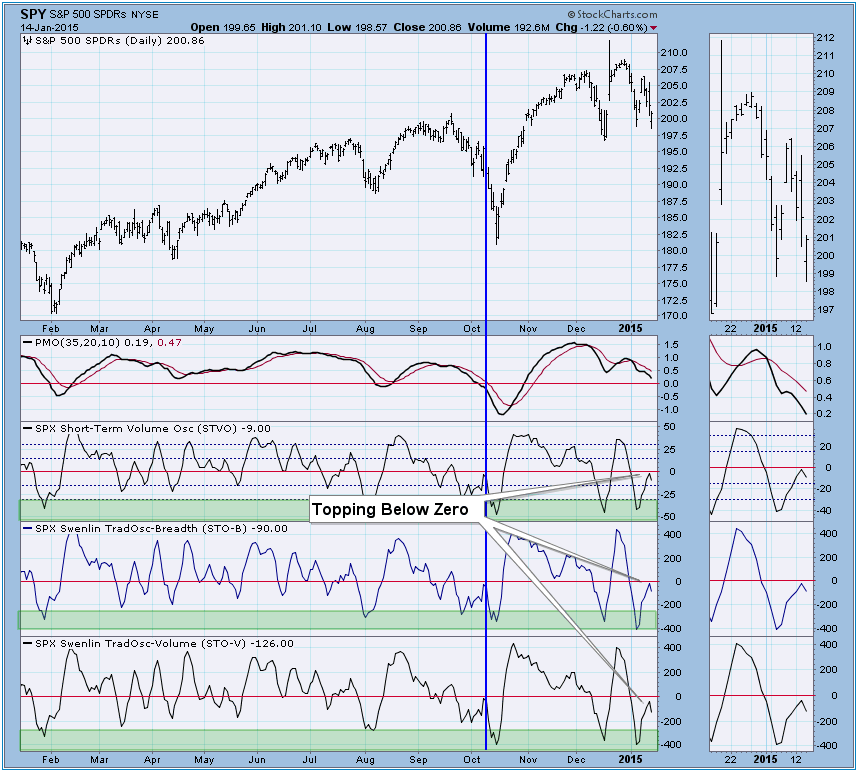
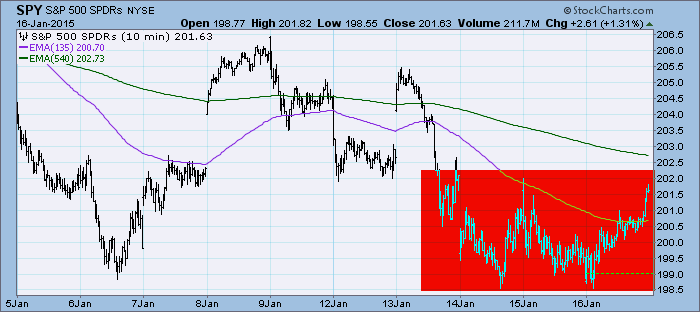
Price took a break from decline and spent the day climbing. For the past three days, the 10-minute bar chart shows price is trading in a range of possible consolidation. Let's look at the indicators to find out where they are suggesting the market will be heading.
The...
READ MORE
MEMBERS ONLY
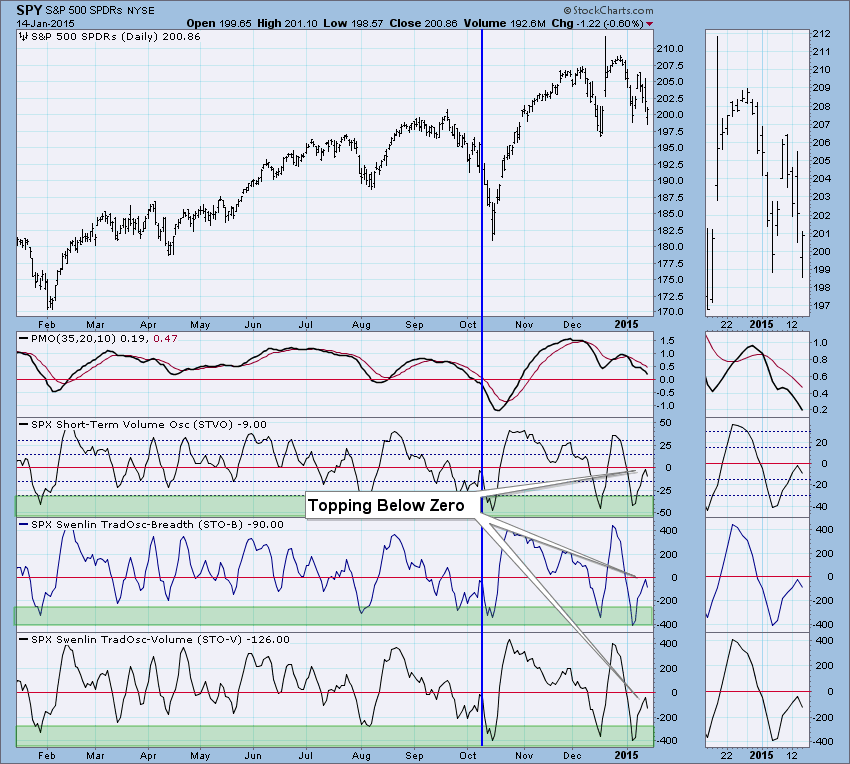
DecisionPoint Short-Term Indicators Move South
by Erin Swenlin,
Vice President, DecisionPoint.com
The DecisionPoint analysis process reviews indicators in three time frames: ultra-short term (typically hours/days), short term (typically days/weeks) and intermediate term (typically weeks). I'll cover short-term indicators today. If you'd like to see where our other indicators stand, you can check out the DP...
READ MORE