MEMBERS ONLY
On-Balance Volume (OBV) Indicator Suite Short-Term Divergences
by Erin Swenlin,
Vice President, DecisionPoint.com
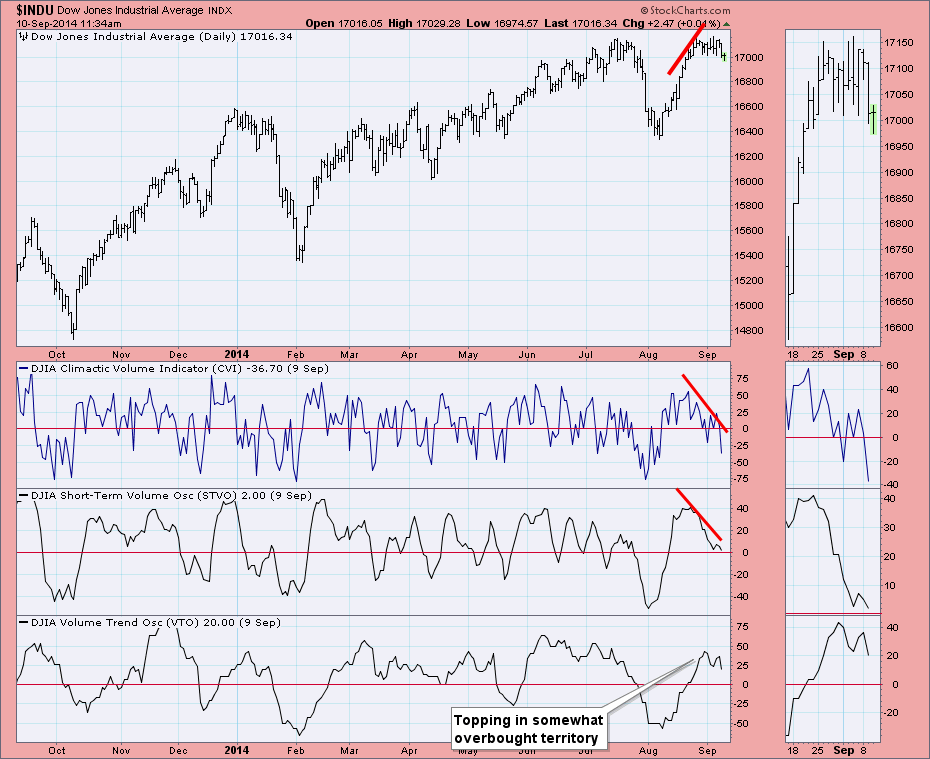
The DecisionPoint On Balance Volume (OBV) indicator suite that consists of three related indicators: Climactic Volume Indicator (CVI), Short-term Volume Oscillator (STVO), and Volume Trend Oscillator (VTO). All of these indicators are derived from the basic OBV calculation (To read more about On-Balance Volume click here). To construct the DecisionPoint...
READ MORE
MEMBERS ONLY
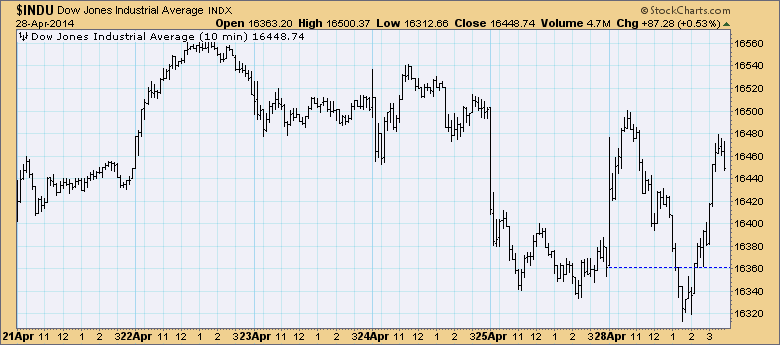
Volume Drying Up On DJIA
by Erin Swenlin,
Vice President, DecisionPoint.com
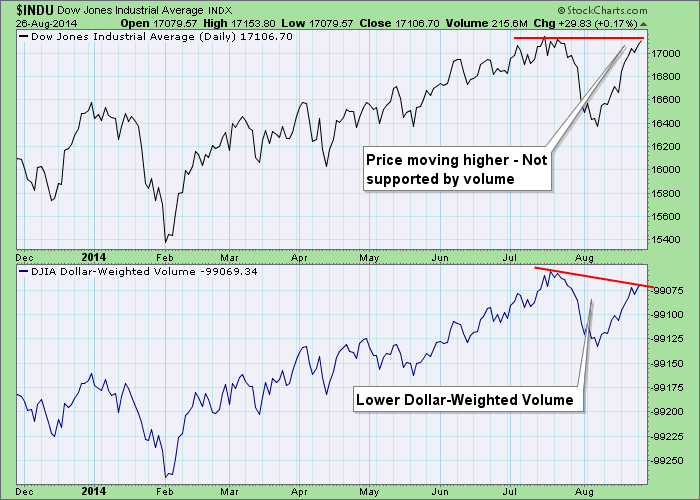
Dollar-Weighted Volume (DWV) is a short-term indicator. Generally the DWV and the price index run pretty close together, with tops confirming tops and bottoms confirming bottoms. What we look for are positive/negative divergences and for instances where volume doesn't confirm price, meaning that volume either leads or...
READ MORE
MEMBERS ONLY
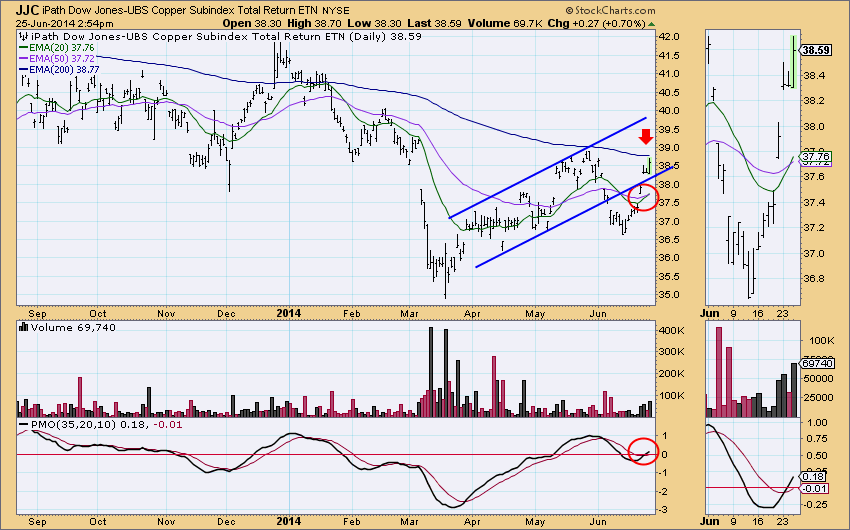
Three Metals Heat Up With New PMO BUY Signals
by Erin Swenlin,
Vice President, DecisionPoint.com
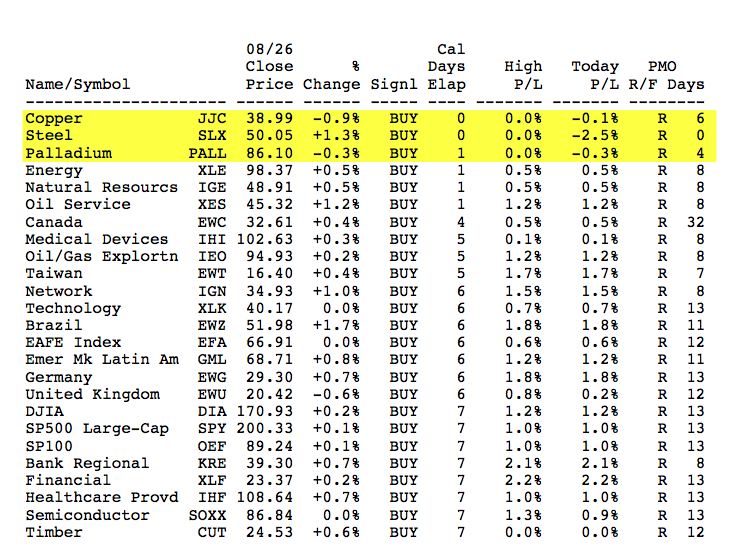
Looking at today's DecisionPoint ETF Tracker, I noticed three new PMO BUY signals on Copper (JJC), Steel (SLX) and Palladium (PALL). Gold (GLD) and Silver (SLV) are still suffering and haven't joined the party. Below is a cross-section of the DP ETF Tracker report where I...
READ MORE
MEMBERS ONLY
"Tracking" Down Investments With DecisionPoint Tracker Reports
by Erin Swenlin,
Vice President, DecisionPoint.com
I thoroughly enjoyed speaking at ChartCon 2014 and meeting so many that were thirsty to learn more about DecisionPoint indicators, charts and reports. At the end of my presentation, I briefly demonstrated how the DecisionPoint Tracker reports can be used to "bottom fish". It appears there are quite...
READ MORE
MEMBERS ONLY
Gold Breaks Out From Falling Wedge
by Erin Swenlin,
Vice President, DecisionPoint.com
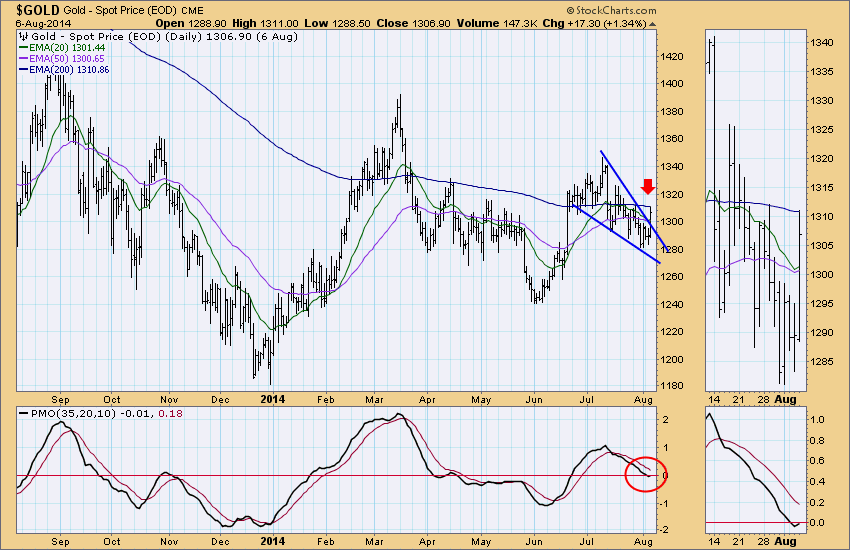
Yesterday, gold rallied and broke out from the bullish descending wedge that was formed over the past month or so. The technical expectation of a falling wedge pattern is a breakout and it happened. Remember, that the only expectation of wedge patterns is a breakout (falling wedge) or breakdown (rising...
READ MORE
MEMBERS ONLY
Indicators Oversold and Reaching Extremes
by Erin Swenlin,
Vice President, DecisionPoint.com
We've been watching our DecisionPoint indicators very closely over the past week as they have moved into neutral and now oversold territory. All three time frames are technically bearish as the indicators continue to fall without bottoming. Carl had written about a minor selling climax in the DecisionPoint...
READ MORE
MEMBERS ONLY
Five Charts To Keep An Eye On
by Erin Swenlin,
Vice President, DecisionPoint.com
Periodically I like to run a scan that gathers stocks and ETFs that have a PMO that has been rising for three days and has the 50-EMA above the 200-EMA. Here's what I like about this scan. First, if the 50-EMA is above 200-EMA that implies that the...
READ MORE
MEMBERS ONLY
Market Indexes Breaking Down
by Erin Swenlin,
Vice President, DecisionPoint.com
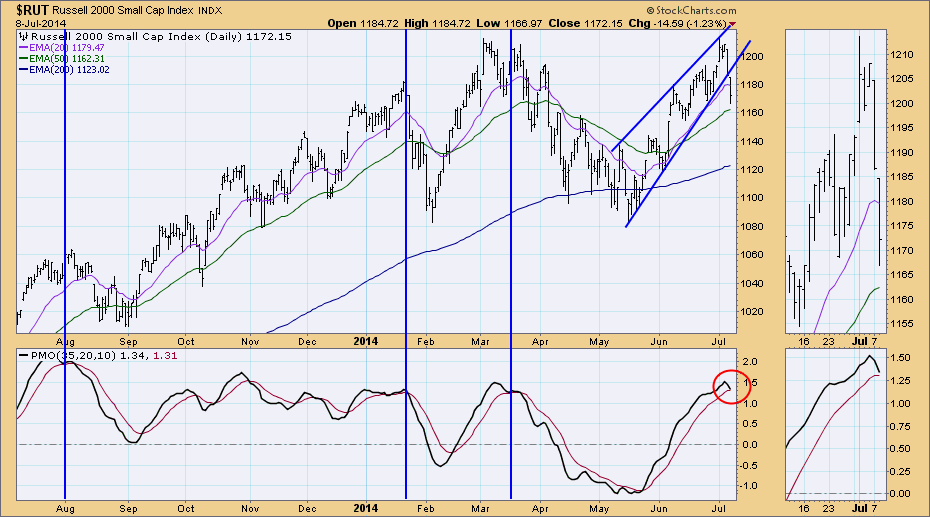
The Russell 2000 is not the only index struggling right now. If you look at the Nasdaq Composite, Dow Utilities, S&P 400 and S&P 600, you'll see similar breakdowns.
The Russell 2000 has been traveling upward in a bearish ascending wedge. The expectation was...
READ MORE
MEMBERS ONLY
DecisionPoint Gallery Review
by Erin Swenlin,
Vice President, DecisionPoint.com
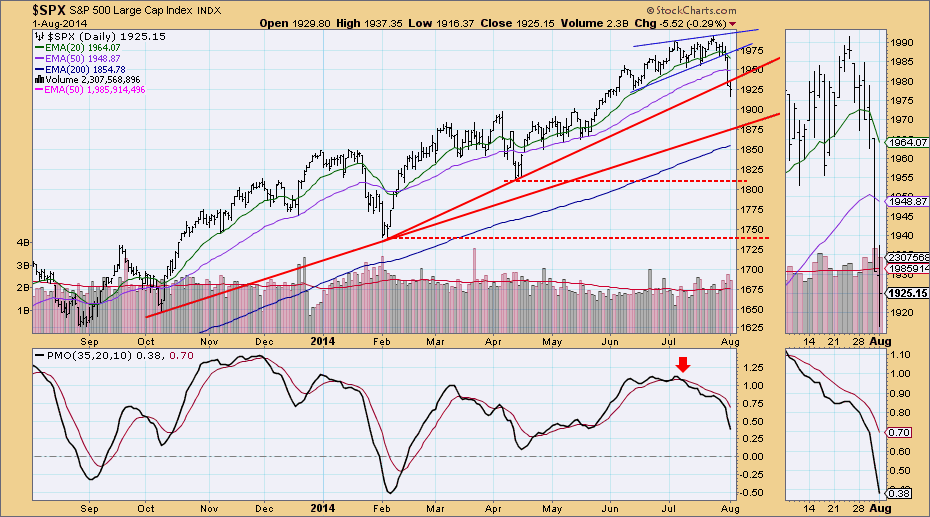
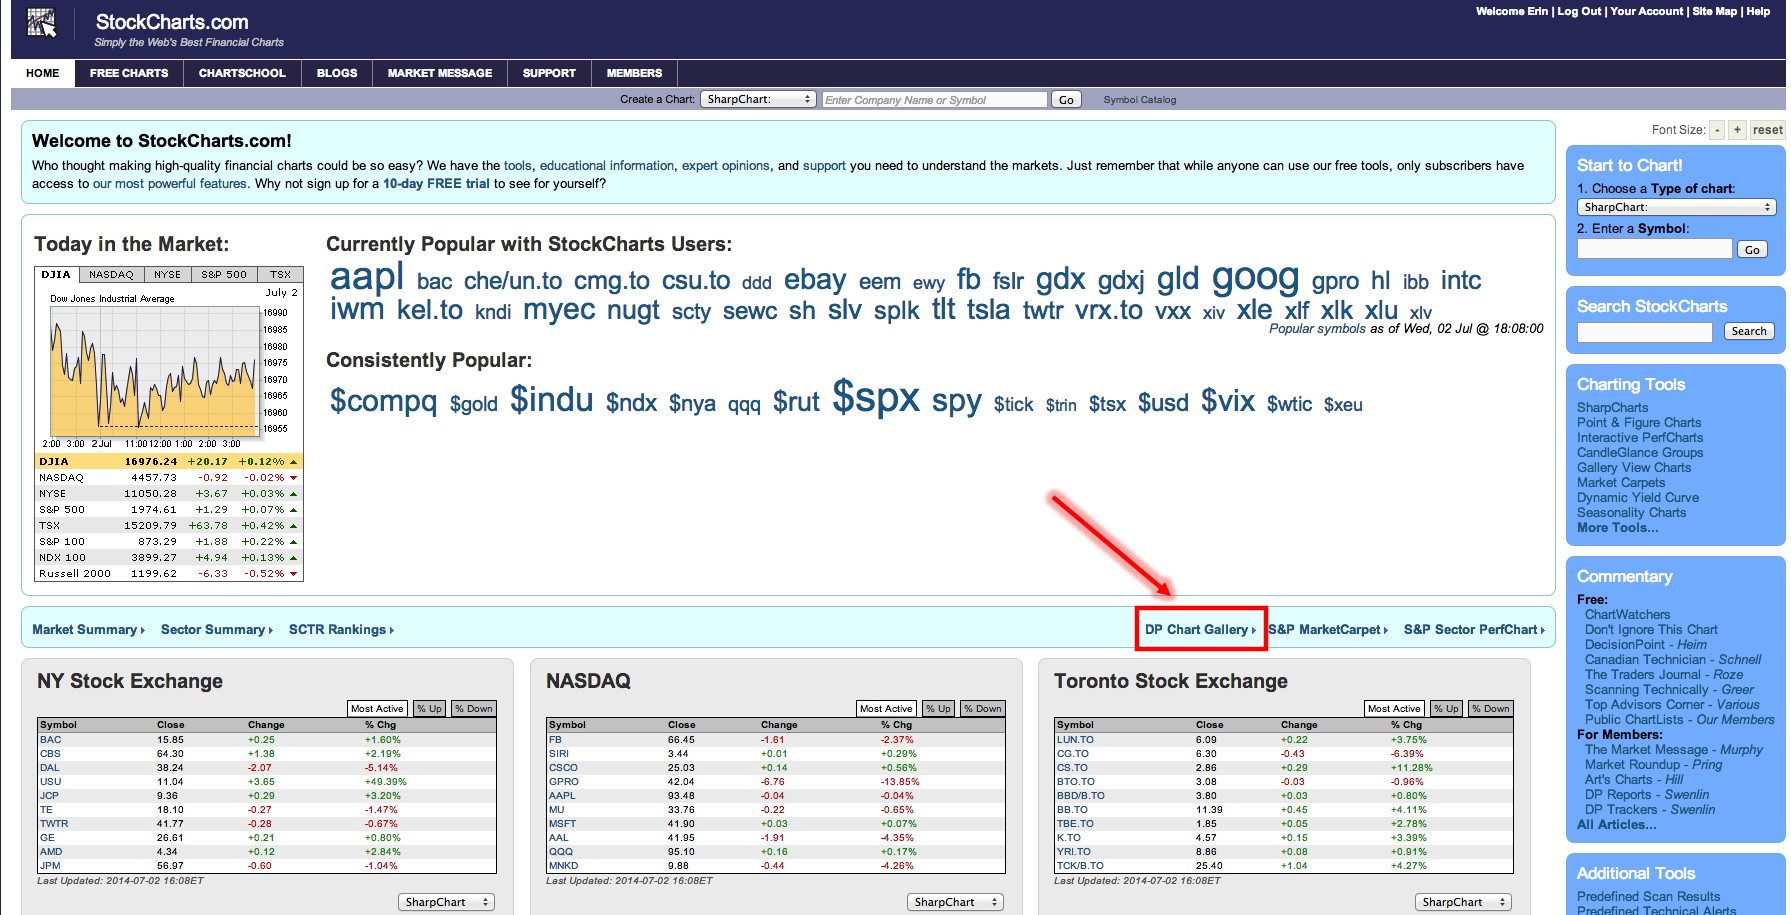
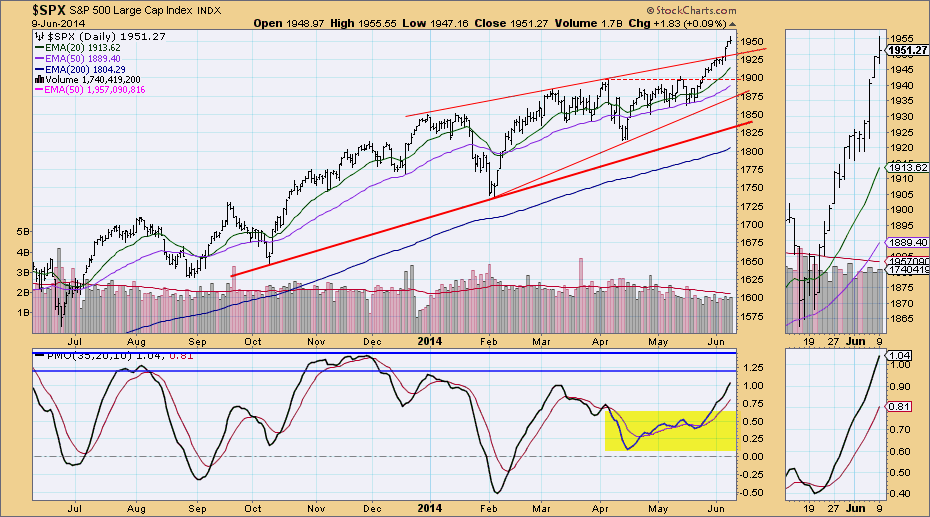
Periodically I like to do a review of the charts in the DecisionPoint Gallery, available in the 'free' area of StockCharts.com. You'll find the link to the gallery on the home page.
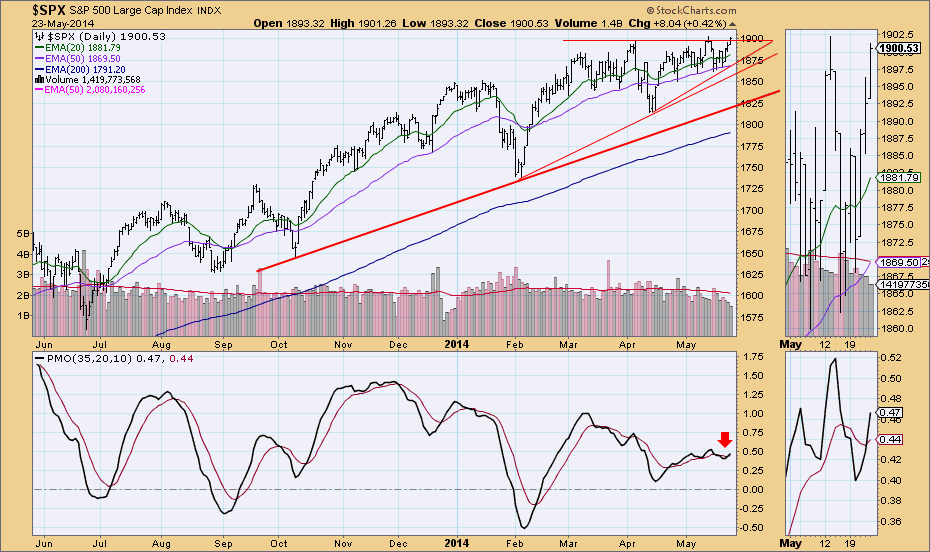
First is the $SPX daily chart. I've annotated the intermediate-term ascending...
READ MORE
MEMBERS ONLY
Copper - New PMO and Trend Model BUY Signals
by Erin Swenlin,
Vice President, DecisionPoint.com
The two cornerstone indicators for DecisionPoint analysis are the PMO and the intermediate- and long-term Trend Models. The DP ETF Tracker report, found in the DecisionPoint Trackers blog, lists not only percentage changes and PMO relative strength for the select ETFs we follow, it lists the PMO BUY and SELL...
READ MORE
MEMBERS ONLY
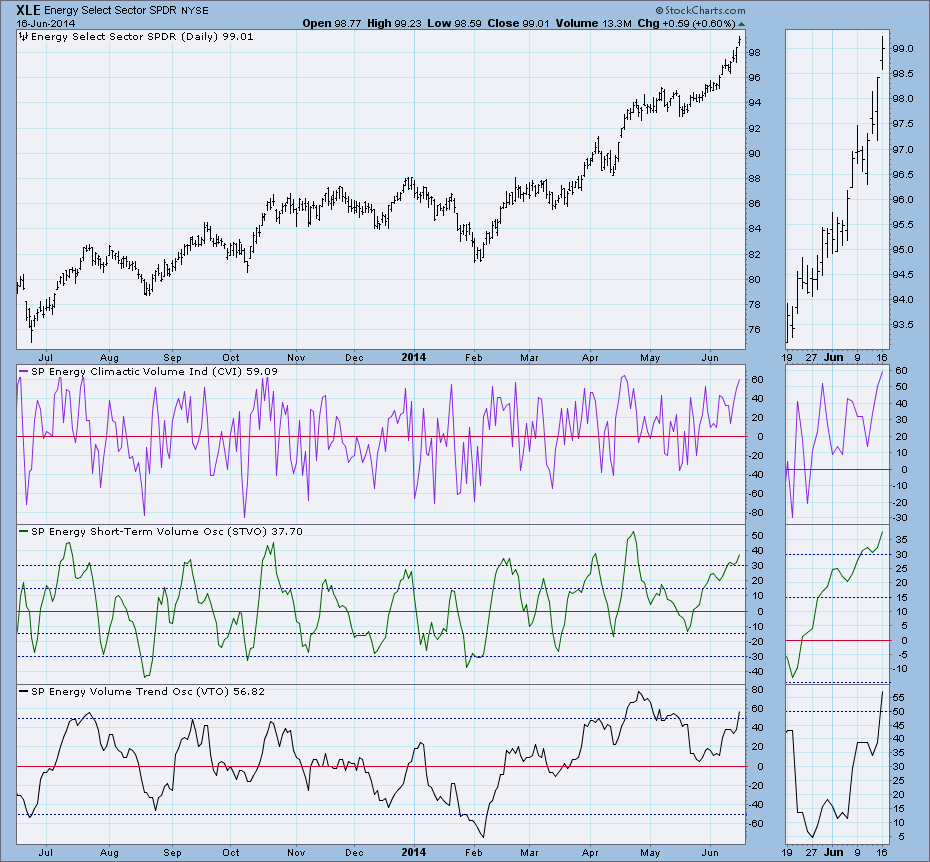
Analyzing On-Balance Volume Indicators On Select Sectors
by Erin Swenlin,
Vice President, DecisionPoint.com
The DecisionPoint On Balance Volume (OBV) indicator suite consists of three related indicators: Climactic Volume Indicator (CVI), Short-term Volume Oscillator (STVO), and Volume Trend Oscillator (VTO). All of these indicators are derived from the basic OBV calculation.
On-Balance Volume was invented by the late Joe Granville. It is a basic...
READ MORE
MEMBERS ONLY
Intermediate-Term Indicators No Longer Congested
by Erin Swenlin,
Vice President, DecisionPoint.com
For some time, our intermediate-term indicators have been oscillating in a tight range. But since the breakout rally began, readings are now setting themselves apart. Let's look at a few charts from the DP Chart Gallery.
First is the daily chart for the SPX. Price broke out above...
READ MORE
MEMBERS ONLY
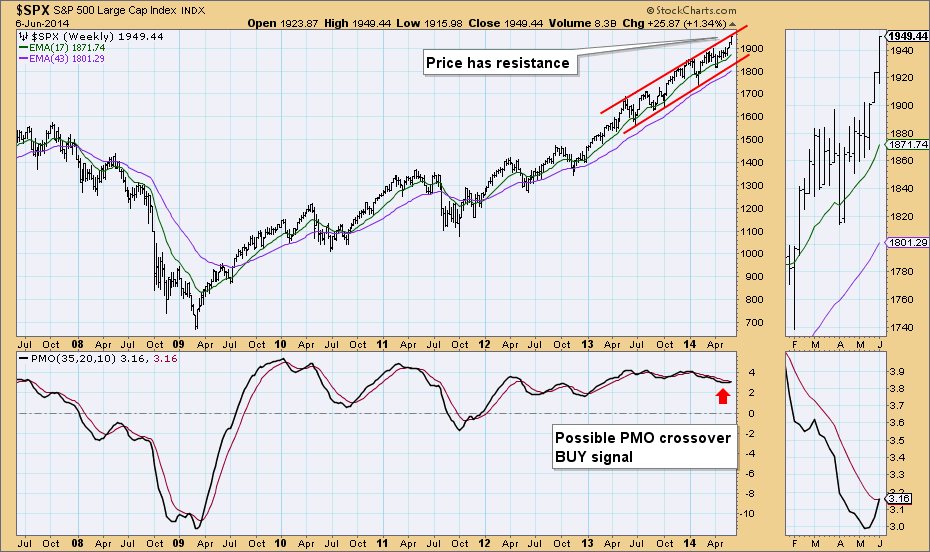
Weekly PMO Readings Insightful
by Erin Swenlin,
Vice President, DecisionPoint.com
In many cases, we all spend a lot of time looking at daily charts and varying indicators. The Price Momentum Oscillator (PMO) using daily, weekly and monthly data to create a unique value for the chart you're looking at. The daily PMO may be reacting quite differently in...
READ MORE
MEMBERS ONLY
New DecisionPoint Subscribers and StockCharts Beginners Welcome!
by Erin Swenlin,
Vice President, DecisionPoint.com
I'm sure that you have seen the information on the upcoming ChartCon 2014 in August, but you may not know that this convention is not just for StockCharts veterans. In fact, it will be invaluable to those new to StockCharts.com.
To the DecisionPoint subscribers that followed us...
READ MORE
MEMBERS ONLY
PMO BUY Signals Reviewed From DP 152 Blue Chip Tracker Report
by Erin Swenlin,
Vice President, DecisionPoint.com
The DP Tracker reports are full of information on a variety of stocks and ETFs. Here is a link to a blog with more information on DP Trackers and how to find and use them.
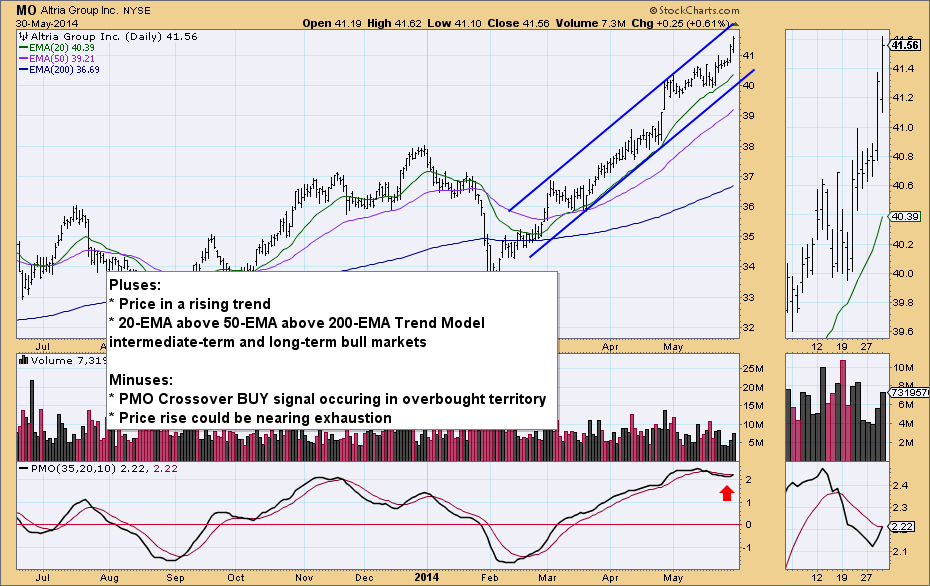
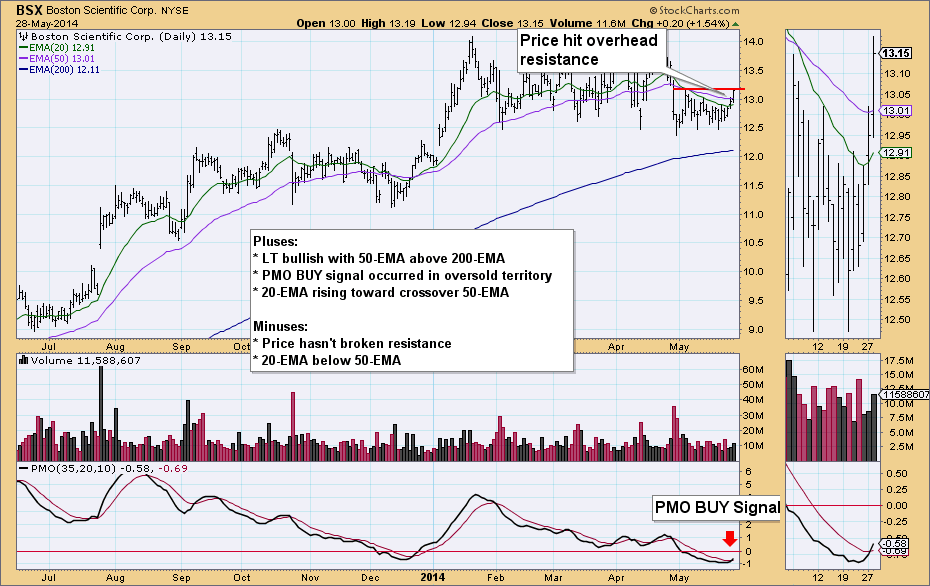
I took at look at Friday's DP 152 Blue Chip Tracker Report to...
READ MORE
MEMBERS ONLY
DP Subscribers: Renew Your StockCharts Subscription For Less Than Your DP Subscription!
by Erin Swenlin,
Vice President, DecisionPoint.com
Just a reminder that the majority of DecisionPoint.com subscribers will be losing their StockCharts.com access (and consequently access to the majority of DP content) unless they renew now. Questions have been coming in to the Support Team regarding the cost difference and what they are getting for their...
READ MORE
MEMBERS ONLY
Using PMO BUY Signals on DP SPX-Plus Tracker Report
by Erin Swenlin,
Vice President, DecisionPoint.com
One of my favorite ways to use the DP Tracker Reports is to call one up and take a look at brand new PMO BUY/SELL signals that have been generated by the PMO crossing over its EMA. Today I specifically pulled up the DP SPX-Plus Tracker Report 4. This...
READ MORE
MEMBERS ONLY
Market at a Decision Point - DP Gallery Review
by Erin Swenlin,
Vice President, DecisionPoint.com
A week-end look at the charts in the DP Chart Gallery tells us that the market, having just reached and pushed above horizontal resistance, is at a decision point. Will price be turned away or will it make a decisive breakout move? Let's look at what the DecisionPoint...
READ MORE
MEMBERS ONLY
USO Breaks Out
by Erin Swenlin,
Vice President, DecisionPoint.com
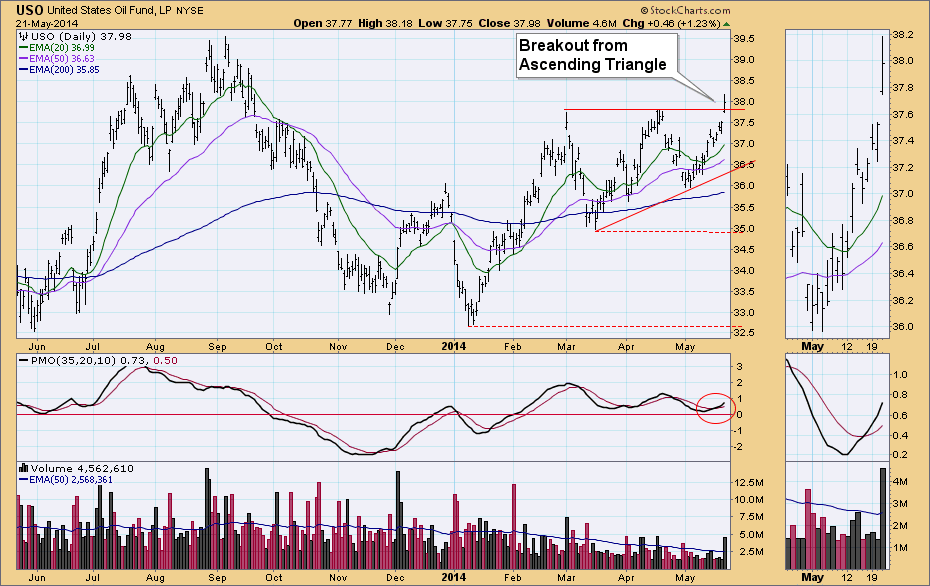
Today, USO broke out above overhead resistance from the bullish ascending triangle. This move confirms the PMO BUY signal that was generated two days ago when the PMO crossed above its 10-EMA.
This breakout came on high volume which is positive. The next area of resistance would be at the...
READ MORE
MEMBERS ONLY
DecisionPoint Trackers: Timing Signals and Strength Rankings Across the Markets
by Erin Swenlin,
Vice President, DecisionPoint.com
Before there were scans, there were DecisionPoint Tracker Reports. While my scans are useful, the Tracker reports still provide some of the best timing and ranking information around to help you sniff out investment opportunities across the major indexes, ETFs, S&P 400, 500 & 600, mutual funds and...
READ MORE
MEMBERS ONLY
Don't Lose Your DecisionPoint Content! Renew Now!
by Erin Swenlin,
Vice President, DecisionPoint.com
This article is directed mainly at current DecisionPoint.com subscribers, but if you need information on how to renew your subscription, read on! As part of the merger between StockCharts.com and DecisionPoint.com, all DP subscribers were given complimentary "Extra" StockCharts membership accounts so that they could...
READ MORE
MEMBERS ONLY
DecisionPoint Market Recap and Expanded Market Summary
by Erin Swenlin,
Vice President, DecisionPoint.com
The last two days I filled you in on the DP Alert Daily Report and the DP Daily Update, both in the DP Reports blog. Today I'll cover the Market Recap and Expanded Market Summary Reports. Both are concise summaries of market action from not only today, but...
READ MORE
MEMBERS ONLY
The DP Alert Daily Report - One Stop For Market Posture and Timing Signals
by Erin Swenlin,
Vice President, DecisionPoint.com
DecisionPoint.com has been providing table/spreadsheet reports for years. Each report provides a complete review of the market day, in addition to comparisons to previous days and to other indexes and sectors. In a glance you can see numerically what the market has accomplished as well as the actual...
READ MORE
MEMBERS ONLY
DecisionPoint Daily Blog Now On StockCharts.com!
by Erin Swenlin,
Vice President, DecisionPoint.com
I received numerous emails and concerns throughout this DP to StockCharts transition period from DecisionPoint subscribers regarding the possible loss of the DP Daily Blog. I'm happy to report that it has been moved to the StockCharts.com blog section under "DP Reports". It has a...
READ MORE
MEMBERS ONLY
Revisiting the PMO Watch List - Looking Good!
by Erin Swenlin,
Vice President, DecisionPoint.com
About a week ago I wrote a blog article that looked at momentum changes that I picked up from my favorite PMO scan. The charts were interesting but needed confirmation of the momentum change with a breakouts and/or PMO BUY signals. I checked these charts out again and they...
READ MORE
MEMBERS ONLY
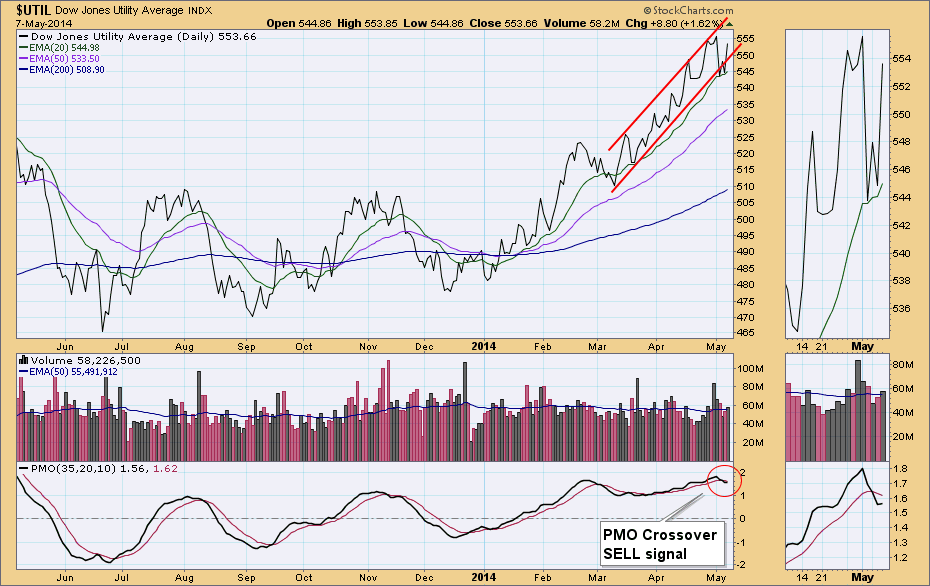
Equal-Weight Utilities ETF (RYU) Hits All-Time Closing High
by Erin Swenlin,
Vice President, DecisionPoint.com
The Utilities sector in general has been doing well with price traveling higher and higher within a rising trend channel since mid-March. In the past few weeks, price did falter and break slightly below the trend channel, but it has recuperated and it stayed above its 20-EMA. The PMO during...
READ MORE
MEMBERS ONLY
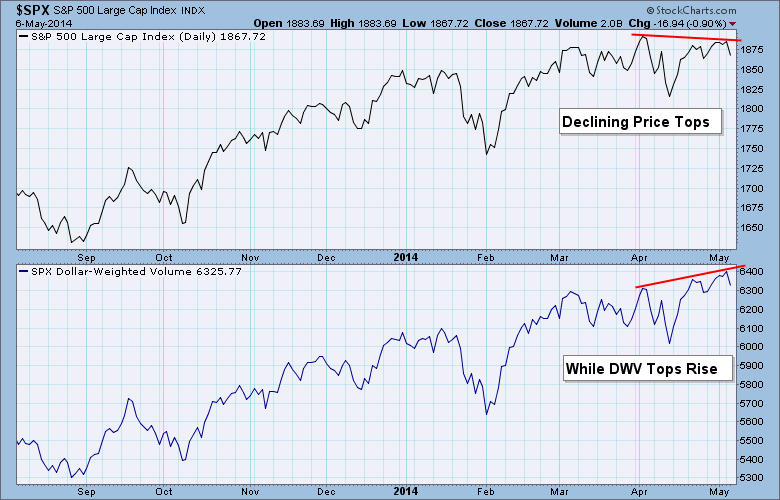
Bearish: Dollar-Weighted Volume Rises While Prices Fall
by Erin Swenlin,
Vice President, DecisionPoint.com
Over 10 years ago, Carl Swenlin developed an indicator called Dollar-Weighted Volume (DWV). DWV is variation of On-Balance Volume (OBV), which was developed by the late Joe Granville. DWV is calculated by multiplying the daily volume of each stock in a given market index by the closing price, then adding...
READ MORE
MEMBERS ONLY
Bull Kiss
by Erin Swenlin,
Vice President, DecisionPoint.com
I wrote an article a few days ago pointing out that the PMO had a positive crossover generating a PMO crossover BUY signal on the SPX. Indicators were not behind the BUY signal and a day later the PMO turned back down toward its EMA, leaving us wondering whether it...
READ MORE
MEMBERS ONLY
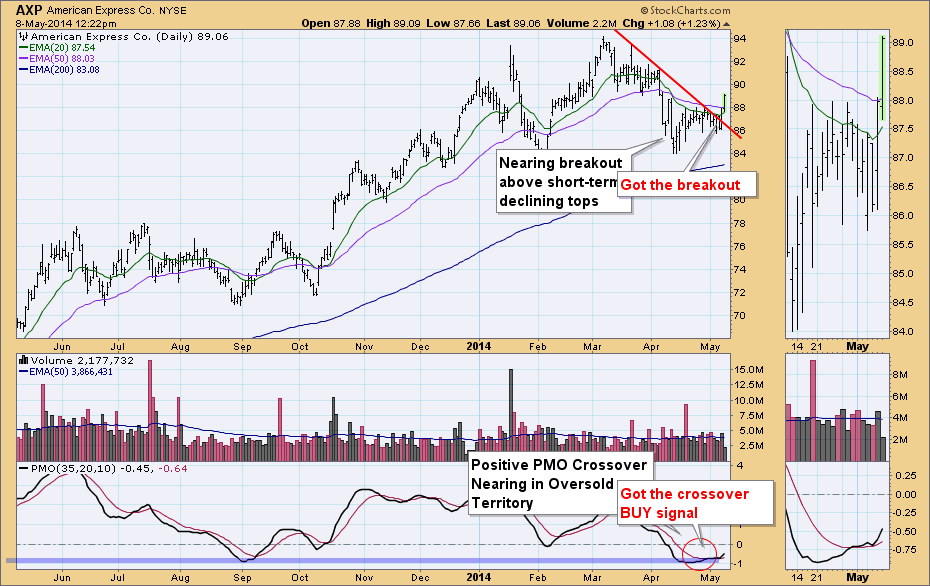
American Express (AXP) and PIMCO (PMX) Added To PMO Rising Watch List
by Erin Swenlin,
Vice President, DecisionPoint.com
I hadn't run my favorite PMO Rising scan in about a week so I decided to see if any charts showed up that were worthy of adding to my PMO Watch List. The scan I use is below:
[exchange is NYSE]
AND [Daily SMA(20,Daily Volume) >...
READ MORE
MEMBERS ONLY
Short-Term Indicators Ignore Positive Close
by Erin Swenlin,
Vice President, DecisionPoint.com
The market had a volatile day, swinging up, dipping low and then recovering to close up. Expectation on a rally would be short-term indicators switching direction and maybe even making climactic moves.
Looking at the daily bar chart, price still looks like it is topping out. Yesterday's high...
READ MORE
MEMBERS ONLY
PMO Buy Signal Lacks Confirmation
by Erin Swenlin,
Vice President, DecisionPoint.com
After breaking out from a short-term declining trend channel, the market seems to be losing steam. But, is it? The PMO has just had a positive crossover its 10-EMA triggering a PMO Buy signal.
We may be looking at a fake-out PMO Buy signal like we saw in early April....
READ MORE
MEMBERS ONLY
Customizing Gallery View For DecisionPoint (Or Your Personal Style)
by Erin Swenlin,
Vice President, DecisionPoint.com
One of the features that I used frequently on the DecisionPoint.com website was Gallery View in the ChartTool. I was happy to learn that you can not only use Gallery View on Stockcharts.com to get an in depth view on a stock, ETF, etc., but you can customize...
READ MORE
MEMBERS ONLY
Creating A Workflow ChartList
by Erin Swenlin,
Vice President, DecisionPoint.com
With the release of several DecisionPoint ChartPacks (to learn more about them and how to install them click here), many users have expressed that they are overwhelmed by the quantity of quality indicator charts. This is not news to me, we had the same feedback from new users to the...
READ MORE
MEMBERS ONLY
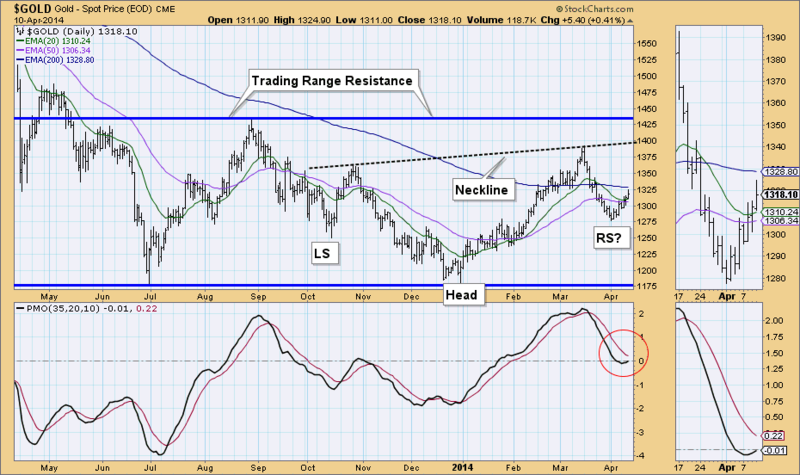
Gold Making A Move
by Erin Swenlin,
Vice President, DecisionPoint.com
I pointed out a bullish Reverse Head and Shoulders possibly forming last week on Gold. It's still in play in my opinion, but the longer-term horizontal trading range, being a pattern that has been around longer, holds a bit more weight on what gold's next move...
READ MORE
MEMBERS ONLY
Jury Duty, Blackjack and Crystal Balls
by Erin Swenlin,
Vice President, DecisionPoint.com
Today, I decided to pull from my archives of blogs written for Decision Point. In my opinion, this blog article states the simplicity of Decision Point Analysis. I have retooled it to include more up to date charts, as it was originally written in February of 2012. Enjoy!
JURY DUTY,...
READ MORE
MEMBERS ONLY
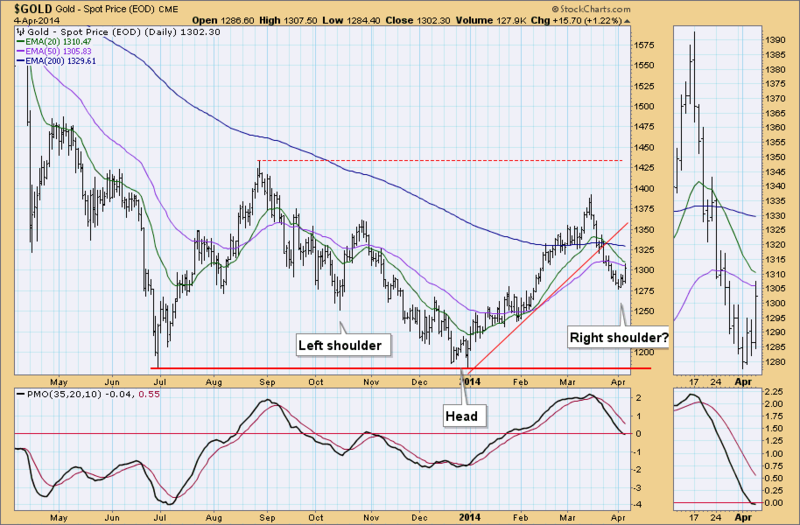
GOLD Reverse Head and Shoulders
by Erin Swenlin,
Vice President, DecisionPoint.com
While I was reviewing the Gold daily 1-year chart, I noticed after Friday's close that we could be looking at a bullish reverse head and shoulders pattern forming up. I've annotated what I view as a left shoulder and head along with where we would look...
READ MORE
MEMBERS ONLY
Anemic Breakout Through Double-Bottom Neckline
by Erin Swenlin,
Vice President, DecisionPoint.com
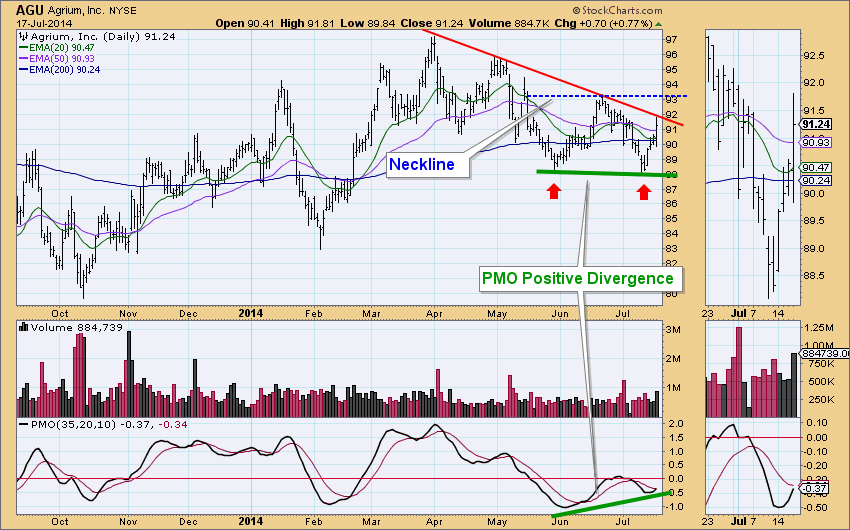
On Monday I wrote a blog "Double-Top to Double-Bottom?". I thought a review and update would be a great follow-up today, especially given the story the charts are telling.
We did get a breakout above the neckline of the double-bottom formation and if you look at this formation...
READ MORE
MEMBERS ONLY
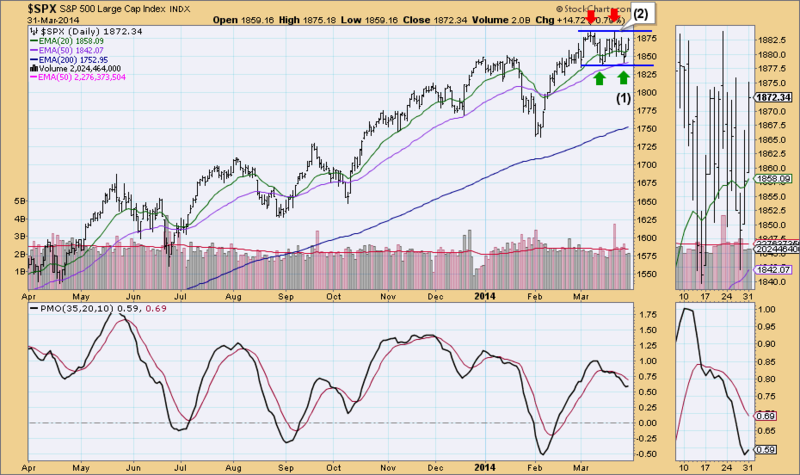
Double-Top To Double-Bottom?
by Erin Swenlin,
Vice President, DecisionPoint.com
Ah, the bull market that wouldn't die. The DP Chart Gallery revealed some interesting charts today, starting with the SP500 Daily Chart. What appeared to be a bearish double-top formation is now looking like a bullish double-bottom. Maybe it is time to chalk it up to being a...
READ MORE
MEMBERS ONLY
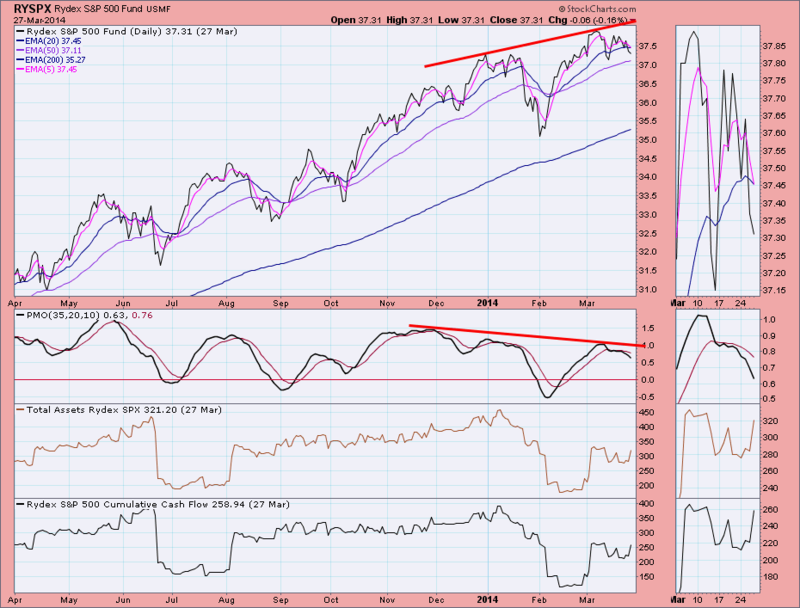
Numerous Negative PMO Divergences On Rydex Funds
by Erin Swenlin,
Vice President, DecisionPoint.com
I noticed a number of PMO negative divergences appearing on the Rydex Funds while clicking through the assets and cashflow charts in the DecisionPoint Rydex ChartPack. Not only are there negative divergences, many of these funds are still showing a large amount of assets and cashflow into them.
Take a...
READ MORE
MEMBERS ONLY
Reading Sentiment Using ICI Monthly Mutual Fund Statistics
by Erin Swenlin,
Vice President, DecisionPoint.com
The Investment Company Institute (ici.org) compiles statistics on mutual funds and publishes them monthly. There is a one month delay between the end of the month being reported and publication, so the data on the charts below, while being updated this week goes through Feburary. Amounts shown on the...
READ MORE